Features RSS

The Submillimeter Array at the summit of Maunakea in Hawaiʻi.

The Event Horizon Telescope (EHT), the facility that delivered humanity’s first-ever picture of a black hole, can produce some of the sharpest images in all of astronomy. But turning the EHT’s raw data into images is a complex process involving messy statistics and powerful algorithms. Recent work presents a potential upgrade to that process: for the first time in long-baseline interferometry, it may be possible to model everything everywhere all at once.

The Hardest Eye Test

The EHT has some of the sharpest eyes in all of astronomy. With its effective resolution of just 20 microarcseconds, in principle you could use it to read a newspaper in New York while sitting at a cafe in Paris. But this planet-spanning instrument (it relies on data from radio telescopes on four continents) doesn’t snap pictures like an ordinary camera. Instead, each pair of telescopes measures something called an “interferometric visibility,” which is related to a single Fourier component of the actual underlying image.

A photograph of an orange ring surrounding a dark center.

The first image of a black hole, constructed from Event Horizon Telescope data taken in 2017. [EHT Collaboration; CC BY 4.0]

Combining these components into an image is a process fraught with assumptions and modeling choices. Since the EHT doesn’t have an infinite number of telescopes, each measurement can be mapped to infinitely many images. This forces researchers to choose how to “regularize” this space of images to select one best picture. Making things harder, they also must contend with all the typical issues of real-world data collection. Each telescope has slight calibration errors, and every data point is affected by weather and temperature-dependent processes.

Typically researchers break the problem down into several stages: first calibrate the data, then regularize and construct the best-fitting image, then analyze that image to constrain the actual physics you care about like the width of the ring surrounding a black hole. This is how the original EHT publications went about their groundbreaking work on the now-iconic glowing ring around the supermassive black hole in the galaxy Messier 87 (M87*).

A New Approach

Recent work led by Paul Tiede (Black Hole Initiative at Harvard University) suggests an alternative process. Instead of separating the stages of analysis as described above, the team demonstrated that one could fit everything simultaneously in a framework they call hierarchical interferometric Bayesian imaging, or HIBI.

A multi-panel plot of images of an orange blob with a tail. All images are very similar.

A comparison of the new HIBI technique (referred to as “Comrade” here) and a traditional algorithm called CLEAN. Click to enlarge. [Tiede et al. 2026]

By fitting all parameters that go into an image together, the method doesn’t select one “best” image. Instead, by allowing the pixel-by-pixel intensities, calibration parameters, and underlying physics to inform one another during inference, HIBI explores the full range of images consistent with the data. This prevents the degeneracies that plague the traditional approach, where image and calibration estimates can trade off against each other in misleading ways. The team validated HIBI on synthetic data mimicking the EHT’s 2017 setup, showing that it reliably recovered a range of source shapes with well-calibrated uncertainty estimates.

Even more exciting, the team demonstrated that it’s possible to skip the image construction step altogether and go straight to the science. By fitting parameters describing the physics underlying a scene, the team was able to constrain the width of the ring around M87* without any reference to a picture. They predict that this technique could be crucial for extracting information when future instruments like the Next Generation Event Horizon Telescope observe more distant black holes that are only marginally resolved. Though we’ll likely have to wait years for these next-generation telescopes, work like this ensures that astronomers will be able to squeeze as much science from them as possible once these new facilities are ready.

Citation

“Hierarchical Interferometric Bayesian Imaging,” Paul Tiede et al 2026 ApJ 997 262. doi:10.3847/1538-4357/ae2749

comet C/2023 P1

Researchers tracked the tail of comet C/2023 P1 (Nishimura) as it interacted with a string of coronal mass ejections, leading to the first-ever quantitative analysis of a cometary tail detachment event.

C/2020 F3 (NEOWISE)

A photo of comet C/2020 F3 (NEOWISE) showing its narrow bluish ion tail and broader white dust tail. [Juan lacruz; CC BY-SA 4.0]

A Comet’s Journey

When comets journey into the inner solar system, they tend to do so sporting two tails: a dust tail that sweeps back from the comet along its curved trajectory and an ion tail that points away from the Sun, in the direction of the interplanetary magnetic field.

The ion tail, which forms when ultraviolet light from the Sun ionizes gas in a comet’s fuzzy coma, interacts with structures in the solar wind, causing it to shift, sputter, and sometimes even disconnect entirely. Now, for the first time, researchers have quantified the timescales involved when a comet loses — and regrows — its tail.

The Tale of a Tail

Shaheda Begum Shaik (George Mason University; US Naval Research Laboratory) and collaborators studied this phenomenon in observations of the comet C/2023 P1 (Nishimura) from 1 to 14 September 2023. In high-resolution images from the Solar Orbiter Heliospheric Imager, Shaik’s team analyzed the dynamics of C/2023 P1’s tail as the comet braved blustery solar wind conditions in the inner solar system.

In a two-week period, the comet underwent four separate tail disconnection events, in which the connection between the ion tail and the comet was severed. Each of these events coincided with the passage of a coronal mass ejection: a tangled mass of solar plasma and magnetic fields ejected from the Sun’s outer atmosphere.

tail disconnection event observations

Solar Orbiter Heliospheric Imager observations of the 11 September 2023 tail disconnection event, which was driven by a passing coronal mass ejection (CME). [Shaik et al. 2026]

Lizard-Like Regrowth

Focusing on the tail disconnection event with the highest-resolution and highest-cadence data, Shaik’s team observed constant small-scale fluttering of the ion tail, reflecting the buffeting of the tail by the solar wind. The tail then developed a kink, which the team speculated is due to compressed solar wind plasma piling up in front of an oncoming coronal mass ejection. The wide-field images show the coronal mass ejection advancing upon the comet and the comet’s tail seemingly being sliced in two.

The free-floating tail segment sped away from the comet at roughly 295 km/s, likely indicating that the tail became caught up in and was transported by the flank of the coronal mass ejection as it barreled past the comet. The timescale and geometry of the event suggest that the interaction of the coronal mass ejection’s magnetic field with the comet’s tail was responsible for the disconnection.

Over the following 24 hours, the comet’s tail slowly regrew at a rate of 86 km/s to its original length of 1.9 million kilometers. The rate of regrowth is likely determined by several factors, such as the rate at which the comet produces ions and the local magnetic field configuration. This work represents a first look at the quantitative behavior of a tail disconnection event, paving the way for future investigations of cometary behavior and a greater understanding of the complex magnetic and plasma environment of the inner solar system.

Citation

“The First Quantitative Study of Cometary Tail Regrowth Following a Coronal Mass Ejection-Driven Disconnection Event,” Shaheda Begum Shaik et al 2026 ApJ 999 60. doi:10.3847/1538-4357/ae3bdb

merging galaxies

The galaxy NGC 4486B appears calm and collected, but its center may have been roiled by a recent merger of supermassive black holes. New modeling explores the stellar dynamics that support this hypothesis.

Strange Center

NGC 4486B double nucleus

Kinematic maps of NGC 4486B showing the locations of the two peaks of its double nucleus. Click to enlarge. [Adapted from Tahmasebzadeh et al. 2026]

Astronomers have known for 30 years that NGC 4486B, a compact elliptical galaxy near the center of the Virgo cluster, has a double nucleus. More recently, JWST observations revealed that the galaxy houses a black hole of 360 million solar masses, which is unusually large compared to the galaxy’s stellar mass of 9 billion solar masses. The two nuclei are roughly 40 light-years from the apparent center of the galaxy, and the black hole also appears to be offset from the galactic center by 20 light-years.

Now, a team led by Behzad Tahmasebzadeh (University of Michigan; Villanova University) has investigated the possibility that NGC 4486B’s double nucleus and off-center black hole can be traced to the aftermath of a supermassive black hole merger.

Simulating Kinematics

In this scenario, the black hole is displaced from the galaxy’s center because of a “kick” it received when it underwent a merger. The double nucleus is a sign of an eccentric nuclear disk: a central disk of stars on aligned elliptical orbits created when merging supermassive black holes disturb an initially orderly disk of stars.

plot of kick magnitude versus mass ratio

Estimated black hole kick magnitude as a function of the initial mass ratio of the black hole binary. Click to enlarge. [Tahmasebzadeh et al. 2026]

Tahmasebzadeh and collaborators performed dynamical modeling to test this hypothesis and understand what types of stellar orbits would be necessary to reproduce the kinematic signature of NGC 4486B’s center seen with JWST. The simulation results called for a blend of prograde and retrograde stellar orbits that closely resembled what is expected for an eccentric nuclear disk. From the properties of the simulated stellar disk, the team estimated that the mass ratio of the merging black holes was >0.15.

To explore this scenario further, the team carried out N-body simulations of the post-merger black hole’s behavior. These simulations showed that after being booted from the galactic center by the post-merger kick, the black hole returns to the center quickly — within 10–80 million years, depending on the kick strength. Because NGC 4486B’s supermassive black hole is notably off center, this suggests that the merger occurred recently.

Galaxy Merger Versus Black Hole Merger

Tahmasebzadeh’s team tested two other theories that could explain the appearance of NGC 4486B’s nucleus: dynamical buoyancy and a pre-merger supermassive black hole binary. Neither of these scenarios could reproduce the offsets seen in the center of the galaxy.

The team noted that NGC 4486B appears to be in equilibrium, with no sign of a recent merger that could have plunked a second supermassive black hole into the galaxy. How can this fact be reconciled with the evidence for a recent black hole merger? Turning again to simulations, the team found that if the black hole binary’s orbit was aligned with the galaxy’s rotation, the binary could have become trapped in a resonance that greatly delayed the merger of the black holes. This makes it possible that NGC 4486B underwent a galaxy merger in the distant past, but its central black hole merged only recently, leaving signs of a long-ago merger that has otherwise faded from view.

Citation

“JWST Observations of the Double Nucleus in NGC 4486B: Possible Evidence for a Recent Binary SMBH Merger and Recoil,” Behzad Tahmasebzadeh et al 2026 ApJL 1001 L14. doi:10.3847/2041-8213/ae52ef

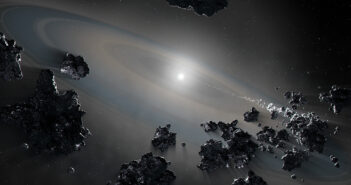
gas giant orbiting white dwarf

Orbiting a white dwarf, the exoplanet WD 0806b is the subject of a recent study using JWST to measure the atmospheric conditions governing the planet.

Directly Imaged Exoplanet WD 0806b

Most of the 6,000 and counting exoplanets discovered thus far have been detected due to their impacts on their host star — passing in front of the star and causing it to dim, or gravitationally tugging on the star and causing it to wobble. On rare occasions, though, astronomers have been able to catch the exoplanet itself through direct imaging. Directly imaged exoplanets offer key insights that cannot be obtained through indirect detection methods. Luminosity measurements and spectral emission features allow astronomers to more directly measure planet mass, radius, and composition otherwise inferred from the host star.

WD 0806b system

NIRCam image showing host star WD 0806 circled in orange and the location of exoplanet WD 0806b marked by the orange arrow. [Lew et al 2026]

Included in the about 90 distant planets that have posed for a picture is WD 0806b, a rare exoplanet companion trotting around a white dwarf at an orbital distance of 2,500 au (50 times the distance from the Sun to the Kuiper belt!). Originally discovered with the Spitzer Infrared Array Camera in 2011, WD 0806b is the second-coldest directly imaged exoplanet to date. With JWST’s high-precision photometric and spectroscopic capabilities, WD 0806b provides a unique opportunity to probe the atmospheric chemistry of cold giant planets and take steps toward understanding the co-evolution of white dwarfs and their surviving exoplanets.

WD 0806b’s Atmospheric Abundances from JWST

Aiming to characterize the physical properties and atmospheric composition of WD 0806b, Ben W.P. Lew (Bay Area Environmental Research Institute; NASA Ames Research Center) and collaborators used JWST’s Near-Infrared Camera (NIRCam) and Near-Infrared Spectrograph (NIRSpec) to obtain high-resolution imaging and spectroscopy of the exoplanet. Combining these observations, prior lower-resolution observations, and evolutionary planet models, the authors estimated the physical properties of WD 0806b including mass, radius, surface gravity, and effective temperature.

WD 0806b spectrum

NIRSpec spectrum of WD 0806b with best-fit model spectra overlaid. [Lew et al 2026]

From the derived physical properties, the authors modeled the NIRSpec spectrum to estimate molecular abundances and elemental abundance ratios in the atmosphere of WD 0806b. They obtained measurements of multiple molecules including carbon dioxide, carbon monoxide, and ammonia; these molecular abundances offer the opportunity to test chemical equilibrium and disequilibrium as well as eddy diffusion, or bulk mixing, in the planet’s atmosphere. The authors developed a novel chemical analysis framework to determine how bulk mixing varies with altitude in WD 0806b and reported the first observational evidence that mixing becomes weaker at higher altitudes in exoplanet atmospheres. This result points to the need for future studies exploring the impact of these chemical processes on spectra and photometry, which are essential to characterizing cold giant planets.

This study highlights how high-precision JWST data can reveal a rich collection of atmospheric conditions, chemical composition, and physical processes occurring in cold giant planets. With such a wide orbit from its host white dwarf, WD 0806b serves as an interesting case study for how giant planet composition may reflect the formation and evolutionary history of the overall system. Future observations of and comparisons to similarly cold giant planets will further uncover how atmospheric characterization may fit into our understanding of exoplanets and their histories.

Citation

“JWST Spectral Retrieval of Cold Directly Imaged Planet WD 0806b and the First Measurement of Altitude-dependent Kzz in Exoplanet Atmospheres,” Ben W.P. Lew et al 2026 AJ 171 227. doi:10.3847/1538-3881/ae4747

Artist's impression of a pulsar

Neutron stars are composed of some of the most extreme material in the universe, and their internal properties are challenging to determine. Recently, researchers investigated an unusual spectral feature that may help to probe the interiors of neutron stars.

Examining Extreme Matter

supernova remnant 1E 0102.2-7219

This composite X-ray and optical image shows the supernova remnant 1E 0102.2-7219. The blue source at the center of the bright red ring inside the remnant is a neutron star that was created in the supernova explosion. [X-ray (NASA/CXC/ESO/F.Vogt et al); Optical (ESO/VLT/MUSE & NASA/STScI)]

When a massive star expires in a supernova explosion, it can leave behind its condensed core in the form of a neutron star: an exceptionally dense sphere roughly as wide as Manhattan is long, composed almost entirely of neutrons. Neutron stars represent an extreme state of matter and contain some of the densest and strongest material in the universe.

By observing neutron stars, astronomers attempt to pin down their equation of state, or the relationship between their interior density and pressure. In a recent research article led by Rosario Iaria (University of Palermo) described a promising way to probe the interior of a neutron star.

This method relies on measurements of a spectral line that originates near the neutron star’s surface and is gravitationally redshifted as it escapes from the intense gravitational pull of the star. The gravitational redshift provides a direct measurement of the compactness of the neutron star, or the ratio of its radius to its mass. Despite the promise of this method, definitive identification of gravitationally redshifted absorption lines has been challenging.

Directly Measuring Compactness

Iaria’s team identified potential evidence of this phenomenon in Neutron star Interior Composition Explorer (NICER) observations of 4U 1820-30, a close binary system containing a neutron star that is accreting matter from a white dwarf companion. (4U 1820-30 is famous for having one of the most rapidly rotating neutron stars known, with a blistering rate of 716 rotations per second.)

MAXI observations of 4U 1820-30

Observations of 4U 1820-30 from the Monitor of All-Sky X-ray Image (MAXI) showing the sudden increase in counts during the superburst, which was followed by two observing epochs by NICER, marked with red and blue vertical lines. Click to enlarge. [Iaria et al. 2026]

Iaria and collaborators focused on a strong iron absorption line at 3.8 keV, which arose three hours after a carbon superburst: a rare burst of high-energy radiation from thermonuclear burning of carbon deep in the neutron star’s atmosphere. The signal persisted for nearly 17 hours before subsiding.

The team proposed that the rare superburst paved the way for the gravitationally redshifted absorption line to appear. During the superburst, a powerful radiation-driven wind swept away most or all of the neutron star’s corona, a diffuse cloud of plasma floating above and below the accretion disk. After the superburst ended and the wind subsided, but before the obscuring corona reformed, the tell-tale absorption line was visible for a short time.

Cracking the Mystery of Neutron Star Structure

By interpreting the 3.8 keV absorption feature as a gravitationally redshifted spectral line arising near the neutron star’s surface, Iaria and collaborators measured a redshift of 1 + z ≅ 1.72. This corresponds to a compactness of 4.46 kilometers per solar mass, which translates to a radius of 6.4 km for a typical mass of 1.4 solar masses or a mass of 2.2 solar masses for a typical radius of 10 km.

The interpretation of the 3.8 keV absorption line as a gravitationally redshifted iron line is still tentative. Further measurements with NICER, or with future facilities like the Advanced Telescope for High-ENergy Astrophysics (Athena) X-ray observatory (planned launch in 2037) or the enhanced X-ray Timing and Polarimetry (eXTP) mission (planned launch in 2030), may help to advance the study of neutron star interiors using this technique.

Citation

“A Mysterious Feature in the NICER Spectrum of 4U 1820-30: A Gravitationally Redshifted Absorption Line?” R. Iaria et al 2026 ApJ 998 58. doi:10.3847/1538-4357/ae2758

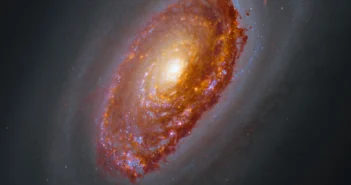
composite image of the active galaxy Centaurus A

Many galaxies, including our own, have a central supermassive black hole. In certain galaxies, gas becomes ensnared in the black hole’s gravitational pull and collects in a disk that feeds the black hole, forming an active galactic nucleus (AGN). An AGN can feast on this disk of gas and dust for millions to billions of years — glowing across the electromagnetic spectrum, brandishing relativistic jets, and creating a brilliant, variable light show visible from billions of light-years away.

Today’s Monthly Roundup investigates the connection between AGNs and neutrinos, considers the question of AGN variability, and explores modeling techniques for relativistic environments.

A Search for Neutrinos from X-Ray-Bright AGNs

Where do neutrinos — neutral, nearly massless elementary particles — come from? AGNs have emerged as one likely source; in 2022, the IceCube collaboration reported evidence for neutrinos from the nearby galaxy Messier 77, which hosts an X-ray-bright AGN, and earlier observations potentially linked a neutrino to the blazar TXS 0506+056.

NGC 7469

The spiral galaxy NGC 7469, shown here in this JWST image, contains an AGN that may be a source of neutrinos. [ESA/Webb, NASA & CSA, L. Armus, A. S. Evans; CC BY 4.0]

To investigate the possible connection between neutrinos and X-ray-bright AGNs, the IceCube collaboration performed a dedicated search for neutrinos toward a collection of X-ray-bright AGNs in the northern sky. The team’s initial analysis confirmed that Messier 77 is the strongest source of neutrinos in that area. Focusing specifically on X-ray-bright AGNs with hard X-ray fluxes at least 20% of Messier 77’s flux — 47 AGNs in total — the team found evidence for a possible neutrino excess toward 11 of the galaxies, with NGC 7469 being the strongest candidate.

This result suggests that X-ray-bright AGNs are indeed a plausible source of neutrinos. As for the specific physical origin of these AGN-generated neutrinos, the data provide a few clues. The X-ray emission of an AGN is thought to arise from a billion-degree cloud of plasma called the corona. The interaction of coronal X-rays with high-energy protons is thought to produce neutrinos in the energy range of 1–10 teraelectronvolts — roughly the energies of the neutrinos associated with Messier 77 in this study. However, NGC 7469 was associated with neutrinos more energetic than this range, suggesting that not all AGN-produced neutrinos have a coronal origin. Thus, though the body of evidence suggesting that X-ray-bright AGN are a source of neutrinos, the precise mechanism through which these neutrinos are produced remains unknown.

diagram of the unified model of active galactic nuclei

A diagram of the unified model of active galactic nuclei, showing an accretion disk, dusty torus, and jets. Click to enlarge. [B. Saxton NRAO/AUI/NSF; CC BY 4.0]

Disk or Jet: Which Varies More?

If there’s one constant when it comes to AGNs, it’s change; observations show that the emission from active galaxies varies on timescales from minutes to decades. Though both the accretion disk and the jet contribute to the overall multiwavelength behavior of an AGN, it’s not yet clear which of these structures is a greater contributor to an AGN’s variability.

Vineet Ojha (Peking University) and coauthors considered AGN variability at optical and mid-infrared wavelengths. Ojha’s team collected a sample of AGN that lie at similar redshifts and fall into one of three categories: narrow-line Seyfert 1 galaxies detected in gamma rays, narrow-line Seyfert 1 galaxies not detected in gamma rays, and broad-line Seyfert 1 galaxies detected in gamma rays. These three classes are distinguished by the presence or absence of relativistic jets as well as their accretion rate; gamma-ray-detected Seyfert 1s likely host jets, and narrow-line Seyfert 1s likely have higher accretion rates than broad-line Seyfert 1s.

Using optical data from the Zwicky Transient Facility and mid-infrared data from the Wide-field Infrared Survey Explorer, the team separated statistical wiggles from true variability and determined which sample of AGNs was most variable. They found that broad-line AGNs detected in gamma rays are the most variable, suggesting that jets are major contributors to AGN variability. Narrow-line AGNs detected in gamma rays are next in line, likely because these AGNs have jets but also have a strong thermal emission component from their accretion disks due to their high rate of accretion. Narrow-line AGNs not detected in gamma rays are the least variable, lacking a jet and dominated by thermal emission. Taken together, these results suggest that AGN variability is mostly jet driven, with some contribution from accretion disk instabilities.

More on AGN Jets: The Slow-Light Effect

The galaxy Messier 87 (M87) hosts one of the most studied AGN jets. M87’s jet is visibly structured, and it exhibits superluminal motion, in which the relativistic plasma appears to move faster than the speed of light. Because the plasma accelerated by an AGN moves so quickly, researchers attempting to model this plasma may opt to use the slow-light approach, in which the evolution of the ambient plasma is modeled simultaneously with the propagation of light through the medium. Though more computationally intensive than the fast-light approach, in which photons zip through a static medium, slow-light techniques are needed in regions of relativistic flows or strong acceleration.

comparison of slow light and fast light results for M87's jet

Comparison of the jet morphology from the slow-light (top row) and fast-light (bottom row) methods. [Adapted from Tsunetoe et al. 2026]

Yuh Tsunetoe (Chinese Academy of Sciences; University of Tsukuba) and collaborators demonstrated their use of the slow-light approach in models of M87’s jet-launching region, where plasma is accelerated to relativistic velocities. The team performed general relativistic magnetohydrodynamics simulations of the accretion disk and jet from M87’s supermassive black hole and compared the results from slow-light and fast-light methods.

The team found that slow-light images tended to be smoother, lacking the looping, helical structures within the jet seen in fast-light images. Slow-light images show more evidence for the superluminal motion that is observed in relativistic jets like M87’s, as well as greater limb brightening and less wobbling motion. The team also investigated the effects of changing the black hole spin, finding greater wobbling in the jet for slow black hole spins and a straighter, wider jet for rapid black hole spins. Overall, Tsunetoe and coauthors found that the slow-light approach generated images that are more consistent with the properties of M87’s jet, demonstrating that the slow-light approach is necessary to capture the behavior of relativistic jets.

Citation

“Evidence for Neutrino Emission from X-Ray-Bright Active Galactic Nuclei with IceCube,” R. Abbasi et al 2026 ApJL 1000 L26. doi:10.3847/2041-8213/ae4aad

“The Relative Contributions of Accretion Disk Versus Jet to the Optical and Mid-Infrared Variability of Seyfert Galaxies,” Vineet Ojha et al 2025 ApJ 994 84. doi:10.3847/1538-4357/ae0a38

“Slow-Light Effect in the Jet-Launching Region of M87,” Yuh Tsunetoe et al 2026 ApJ 1000 29. doi:10.3847/1538-4357/ae43e7

A rendering of two purple jets streaming away from a central explosion.

Over many centuries of observing the night sky, astronomers have found only a single visible afterglow of a collision between neutron stars. For a few days in the summer of 2025, it seemed like observers may have found another of these treasured but elusive prizes; unfortunately, the promising candidate turned out to be a supernova in disguise.

A Rare Prize

kilonova as seen by Hubble

These images from the Hubble Space Telescope show the fading light of the kilonova associated with the gravitational wave event GW170817. [NASA and ESA Acknowledgment: A. Levan (U. Warwick), N. Tanvir (U. Leicester), and A. Fruchter and O. Fox (STScI)]

When two neutron stars (the ultra-dense remnants of massive stellar explosions) spiral together and collide, the cataclysm is energetic enough to release strong gravitational waves, forge heavy elements, and briefly glow across the electromagnetic spectrum. These events are called kilonovae, and they’re quite rare; while we may have detected a handful at high energies, there is only one event for which astronomers managed to record both gravitational waves and an optical transient.

That one kilonova, found back in 2017, taught astronomers much about how heavy elements are formed and left the scientific community hungry for more data. Since then, each time a gravitational wave detector like LIGO reports that it may have spotted a neutron star merger, telescopes across the world scramble to look in the probable region of the sky, hoping to find the short-lived electromagnetic counterpart.

Too Good to Be True

On 18 August 2025, the LIGO/Virgo/KAGRA collaboration sent out an alert that it may have detected a neutron star–neutron star merger. The odds that their signal was real weren’t great, and the researchers gave it just a 29% chance of being a genuine astrophysical signal. Still, given the potential payoff of finding the next kilonova, several telescopes quickly began searches for the optical counterpart. The gravitational wave signal suggested that the event likely came from a curved patch of sky delightfully referred to as the “northern banana,” and after trawling that region for a few nights, astronomers hauled in 47 new transients. Any one of these could have been the kilonova, and all of them received extensive follow-up observations.

A team led by James Gillanders (University of Oxford) recently summarized some of these follow-up observations carried out with the Pan-STARRS and ATLAS telescopes. In the initial exciting few days after the alert went out, one candidate transient stood out as the most promising. Named AT2025ulz, it was first spotted by the Zwicky Transient Facility and initially started fading rapidly and changing colors, just as models of kilonovae predict. For four days, it seemed like the world may have witnessed its second-ever kilonova. But then the telescopes began their fifth night of observations.

Supernova Unmasked

A scatter plot showing a rapidly fading, then reversing and spiking, light curve.

The light curve of SN2025ulz. Note that the source appeared to grow brighter again after about 5 days. Click to enlarge. [Gillanders et al. 2025]

The light curve of AT2025ulz, after fading steadily in the preceding days, suddenly turned upwards; in other words, whatever was causing the transient got brighter. Models of kilonova evolution predict no such brightening, but Type IIb supernovae are known to follow just this behavior. AT2025ulz showed itself to be another run-of-the-mill stellar explosion, not the sought-after fireworks of two neutron stars slamming together.

Frustrating as this particular result may be, the effort was far from wasted. The team could use their non-detection of the true kilonova to place limits on its timing and peak magnitude, assuming it existed in the first place. And, as gravitational wave detectors grow more sensitive and alerts like this more common, hindsight will likely frame this scramble as a dress rehearsal for an ultimately successful kilonova recovery effort. Until then, astronomers will keep searching, and will keep their guard up against cosmic impostors.

Citation

“Pan-STARRS Follow-Up of the Gravitational-Wave Event S250818k and the Light Curve of SN2025ulz,” J. H. Gillanders et al 2025 ApJL 995 L27. doi:10.3847/2041-8213/ae2125

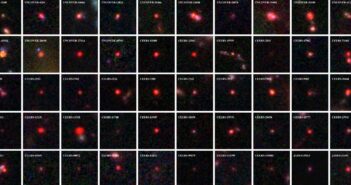
NIRCam JADES image

JWST has uncovered a peculiar population of very distant objects known as “little red dots.” The mechanisms powering these objects’ peculiar properties — high luminosities, compact radii, and “V”-shaped spectra — remain uncertain. Could little red dots be the result of supermassive stars, galaxy mergers, or, as a recent study explores, black hole stars?

Direct-Collapse Black Holes and Little Red Dots

Since their discovery, little red dots have been the subject of many studies, but a complete explanation for their unique combination of properties remains elusive. Multiple studies have explored the growing population of peculiar dots, with some postulating that they are the result of stars thousands of times the mass of the Sun, supermassive stars entrenched in gas from a galaxy merger, or black holes embedded in dense accretion disks. 

Even more recently, studies have proposed that little red dots may be the remnants of direct-collapse black holes. In this scenario, a large cloud of gas in the early universe directly collapses into a stellar-mass black hole, and the remaining gas envelops the black hole, forming what is known as a quasi-star (or black hole star). Researchers have suggested that little red dots may be the late stage of this process when the black hole has accreted at least 10% of the total mass of the system. Direct comparisons between quasi-star evolutionary models and JWST observations of little red dots have yet to be explored but are necessary to confirm the potential of quasi-star origins.

Evolutionary Models of Quasi-Stars

Quasi-star HR diagram

Evolution of a theoretical quasi-star model on a Hertzsprung–Russell diagram. [Modified from Santarelli et al 2026]

Seeking to compare quasi-star evolutionary models to JWST observations of little red dots, Andrew D. Santarelli (Yale University) and collaborators developed a modeling framework to simulate quasi-star evolution. In this framework, a quasi-star is modeled as a black hole at the core of a massive star that accretes material from the stellar envelope over its lifetime. The authors computed models for a range of initial masses and tracked the evolution of the quasi-stars, predicting luminosities, temperatures, surface gravities, and lifetimes of these objects.

After a short initial phase of contraction lasting around 10,000 years, the quasi-star spends the rest of its approximately 20–40-million-year lifetime in the “late stage” as the central black hole continues to eat up the surrounding envelope. In the end, the quasi-star becomes a supermassive black hole a million times the mass of the Sun.

SED comparison of quasi-star + LRDs

Predicted spectral energy distributions of 1 million solar mass, late-stage quasi-stars both alone (black dashed line) and embedded in a host galaxy (solid blue line). Each panel compares the quasi-star to a little red dot observed by JWST. [Modified from Santarelli 2026]

From these models, the authors extracted synthetic spectral energy distributions for late-stage quasi-stars. In comparing the simulated quasi-star spectra to those of three observed little red dots, the authors found that the synthetic quasi-star spectra generally reproduce the main continuum features seen in all three of the little red dots. While the models do not account for specific emission lines, the continuum slopes of the ultraviolet and near-infrared parts of the spectral energy distributions that form the signature “V” shape generally agree with those seen in the three comparison little red dots.

Plausible Progenitors

The results of this study indicate that late-stage quasi-stars can naturally produce the defining continuum features of little red dot spectra. While further modeling is required to trace specific emission line features, the initial modeling presented in this study establishes quasi-stars as plausible progenitors of not only little red dots but also the universe’s first supermassive black holes. 

As the authors noted, the short lifetimes of quasi-stars shown in their models in conjunction with the observed number density of little red dots implies that a significant fraction of supermassive black holes formed through this mechanism. Continued observations of little red dots and advanced modeling of direct-collapse black holes will aid in determining if these peculiar dots are showing off the birth of supermassive black holes in the universe.

Citation

“Evolutionary Tracks and Spectral Properties of Quasi-stars and Their Correlation with Little Red Dots,” Andrew D. Santarelli et al 2026 ApJL 998 L4. doi:10.3847/2041-8213/ae3713

Dinkinesh and Selam

The Lucy spacecraft, en route to its primary mission targets, zipped past the main-belt asteroid Dinkinesh and revealed its tiny satellite, Selam. New research examines the surfaces and histories of these small rocky worlds.

A Stop Along the Way

In 2021, the Lucy spacecraft embarked on a 12-year mission to study several Jupiter trojan asteroids, which share Jupiter’s orbit. The spacecraft won’t have its first encounter with a Jupiter trojan until 2027, but it hasn’t been idle during its long journey. In November 2023, Lucy performed a dress rehearsal of its trojan-encounter maneuvers during a flyby of a 738-meter-wide main-belt asteroid called (152830) Dinkinesh.

Dinkinesh and Selam

Two images of Dinkinesh from the Lucy mission. The second image features its satellite, Selam. [Bierhaus et al. 2025]

During this flyby, Lucy flew within 430 km (267 mi) of the asteroid and made a surprise discovery: Dinkinesh has a tiny companion, which has been named Selam. (The name Dinkinesh comes from the Amharic name for the Lucy fossil discovered in 1974; Selam is similarly named after a hominid fossil that is sometimes called “Lucy’s baby.”) Remarkably, Selam is the first known asteroid satellite that is a contact binary, made up of two separate bodies that have gently merged into one.

Craters and Boulders

In a recent research article, Edward Bierhaus (Lockheed Martin Space) and collaborators analyzed Lucy flyby images to study the surfaces of Dinkinesh and Selam. The team analyzed global features like troughs and ridges and measured visible craters and boulders.

craters on Dinkinesh and Selam

Locations of craters on Dinkinesh and Selam. The blue lines indicate the most confidently identified craters; orange and green lines mark craters identified less confidently. Click to enlarge. [Bierhaus et al. 2025]

While the small numbers of craters detected — 29 for Dinkinesh and 3 for Selam — makes further analysis difficult, the team determined that Dinkinesh’s crater size–frequency distribution is shallower than expected, though similar to that of small near-Earth asteroids (e.g., Ryugu). The seemingly shallow distribution may be an effect of the phase angle and resolution of the observations, or it could be a sign of impact armoring or other surface processes.

The size–frequency distribution of Dinkinesh’s boulders, on the other hand, is somewhat steeper. This discovery may mean that S-type (stony) asteroids like Dinkinesh have different boulder size distributions than C-type (carbonaceous) asteroids.

Possible Histories

An analysis of the collisional timescales in the main asteroid belt suggests that Dinkinesh is a fragment of a larger asteroid that was split apart at least once, though it’s not yet possible to say which parent body it might have come from. After splitting off from its parent asteroid, Dinkinesh appears to have been subjected to the Yarkovsky–O’Keefe–Radzievskii–Paddack (YORP) effect. This effect arises when sunlight falls on a small asymmetric asteroid, creating a torque that can alter its spin rate. In extreme cases, the YORP effect can crank up an asteroid’s spin rate so much that it sheds some of its surface material or flies apart altogether.

Sumak Fossa and Fab Dorsum on Dinkinesh

Locations of Sumak Fossa (top) and Fab Dorsum (bottom) indicated with arrows. [Adapted from Bierhaus et al. 2025]

Dinkinesh seems to show clear signs of YORP-driven structural failure. Sumak Fossa (a large trough) and Fab Dorsum (a ridge running along the asteroid’s equator) may have formed through this process. If Sumak Fossa was excavated by a YORP-induced mass-shedding event, both Fab Dorsum and Selam could have formed out of the cast-off material.

With Lucy en route to its primary objective, there’s still much for us to learn from this mission about the small bodies of our solar system. In the meantime, be sure to check out the full article linked below, as there are far more details about Dinkinesh and Selam than could be included in this short summary!

Citation

“The Geology of a Small Main-Belt S-Class Binary Asteroid System: Dinkinesh and Its Contact Binary Satellite Selam as Observed by the Lucy Mission,” E. B. Bierhaus et al 2025 Planet. Sci. J. 6 299. doi:10.3847/PSJ/ae1968

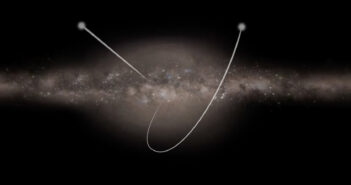
simulation of a supermassive black hole binary system

Researchers have undertaken a new search for a supermassive black hole binary, placing limits on its properties and exploring a promising technique for simultaneously analyzing electromagnetic and gravitational wave data.

Narrowing the Search for Supermassive Black Hole Binaries

In 2023, astronomers announced the discovery of compelling evidence for the gravitational wave background: the collective murmurs and rumblings of distant supermassive black hole binaries. The time may now be ripe for the natural next phase of discovery: the detection of gravitational waves from an individual supermassive black hole binary.

predicted frequency evolution of gravitational waves from 3C 66B

The predicted frequency evolution of gravitational waves from the black hole binary candidate in 3C 66B. Click to enlarge. [Cardinal Tremblay et al. 2026]

One of the most promising candidates for this search is 3C 66B, a poetically named elliptical galaxy roughly 300 million light-years away. More than 20 years ago, researchers discovered that the radio source at the heart of this galaxy wobbles to and fro in a way that’s consistent with the elliptical paths of supermassive black holes in a close binary. Further work predicted that the gravitational waves produced by this binary would have a frequency of about 60 nanohertz and potentially be within the observational reach of current methods.

Pulsar Timing Array

Jacob Cardinal Tremblay (Max Planck Institute for Gravitational Physics and Leibniz University Hannover) and collaborators conducted a search for gravitational waves from the candidate supermassive black hole binary in 3C 66B using the Parkes Pulsar Timing Array (PPTA).

artist's impression of the gravitational wave background from a supermassive black hole binary sweeping across an array of pulsars

Artist’s impression of a supermassive black hole binary generating gravitational waves that sweep across an array of pulsars. [Aurore Simonnet / NANOGrav; CC BY 4.0]

A pulsar timing array is a collection of pulsars monitored for signs of passing gravitational waves. Pulsars are the condensed, rapidly spinning cores of high-mass stars that exploded as supernovae. Named for their characteristics radio pulses, these extreme stars spin with exceptional regularity, and the passage of a gravitational wave can shrink or expand spacetime enough to speed up or delay the arrival of a pulsar’s pulses. By searching for coordinated changes in pulse arrival times from a collection of pulsars, researchers hope to detect low-frequency gravitational waves that are inaccessible to observatories like LIGO.

Researchers have previously searched for gravitational waves from 3C 66B in data from other pulsar timing arrays, such as the North American Nanohertz Observatory for Gravitational Waves, and no black hole binary has been detected. This is the first search of the third PPTA data release, which contains measurements of 32 pulsars over 18 years, providing a long baseline to search for the slow undulations of low-frequency gravitational waves.

Placing Limits

constraints on chirp mass of 3C 66B

Constraints placed on the chirp mass by this work (blue and green histograms) compared to constraints from electromagnetic observations (gray and peach shaded areas). Click to enlarge. [Cardinal Tremblay et al. 2026]

Using Bayesian statistical methods to analyze their pulsar timing data, the team was unable to confirm or rule out the presence of a supermassive black hole binary in 3C 66B. However, they were able to place limits on its properties, such as the chirp mass and the amplitude of the signal, and certain limits were more stringent than those placed by existing electromagnetic data.

While this analysis didn’t result in the first-ever detection of gravitational waves from a single supermassive black hole binary, it did allow the team to test a new method that could someday play a role in precision cosmology. This method simultaneously analyzes electromagnetic and gravitational wave data from known supermassive black hole binaries, establishing these sources as “standard sirens” that can complement standard candles like Type Ia supernovae for measurements of the expansion rate of the universe.

Citation

“A Multimessenger Search for the Supermassive Black Hole Binary in 3C 66B with the Parkes Pulsar Timing Array,” Jacob Cardinal Tremblay et al 2026 ApJL 998 L42. doi:10.3847/2041-8213/ae3c98

1 2 3 4 5 6 121