Across the universe and across the electromagnetic spectrum, flares, bursts, and waves are making their mark on the sky. Today, we’re giving an update on three exceptional transients that have been discussed previously on AAS Nova: AT 2024wpp, GRB 250702B, and GW231123.
The Most Luminous Known Fast Blue Optical Transient, AT 2024wpp
Discovered in September 2024, AT 2024wpp burst onto the scene as the most luminous example of a fast blue optical transient (FBOT) — a growing class of events that are more luminous, more rapidly evolving, and bluer than supernovae. In October 2025, astronomers published their findings on AT 2024wpp’s X-ray and radio evolution. Just last month, a research team led by Natalie LeBaron (University of California, Berkeley) described the results of a complementary investigation of the transient’s ultraviolet, optical, and near-infrared behavior.
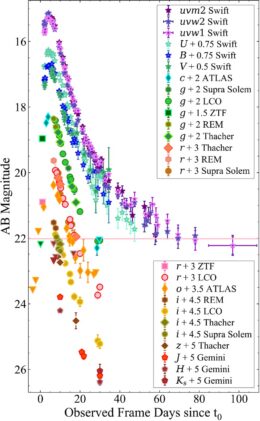
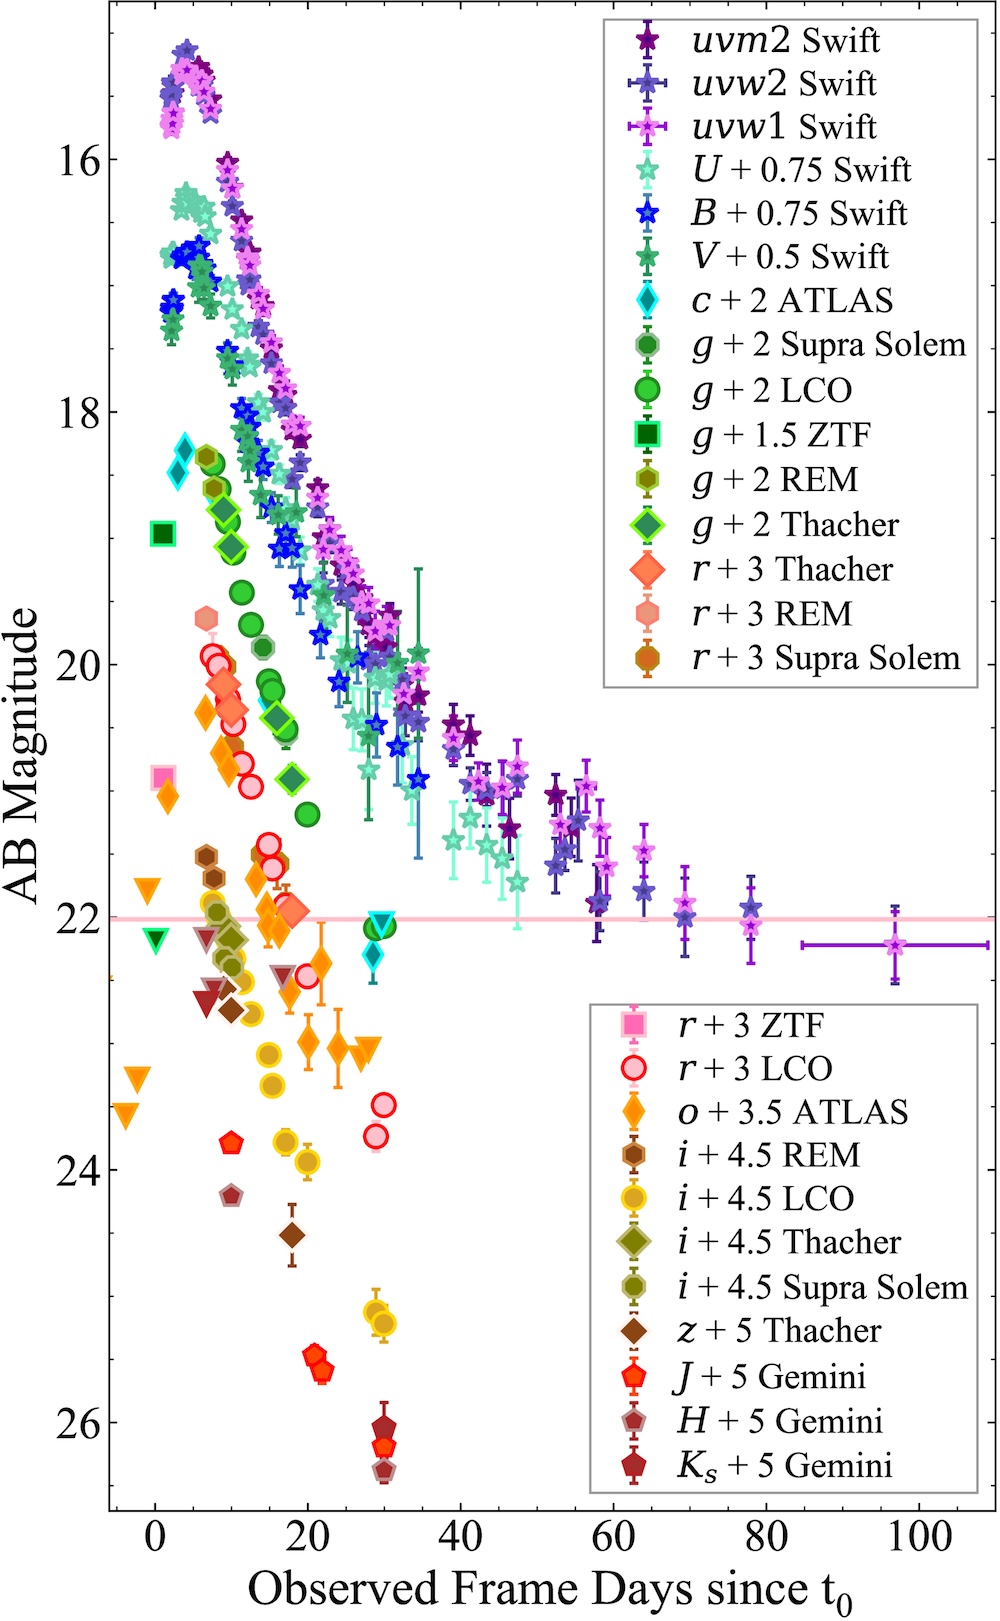
The ultraviolet through infrared light curve of AT 2024wpp. Results from different filters are offset vertically for clarity. [LeBaron et al. 2026]
LeBaron and collaborators collected ultraviolet through infrared photometry as well as optical and infrared spectroscopy to characterize the event. These efforts led to the first-ever collection of ultraviolet data during the rising period of an FBOT. Overall, the data reveal an almost featureless spectrum from the optical through the near-infrared and a persistent, weeks-long thermal continuum, both of which seem to be common for FBOTs.
The observations point to a luminous central energy source that continuously injects energy into its surroundings, powers multiple outflows, and ionizes the ejected material. These features can be explained by the rapid accretion of material by a neutron star or a black hole, in which the accreted material forms a disk and is ejected in both a fast-moving polar outflow and a slower-moving equatorial outflow.
Though the exact nature of the central object powering AT 2024wpp’s intense radiation isn’t known — the extreme luminosity of this event points to a stellar-mass black hole as the central object, but a neutron star cannot be ruled out — the overall picture of this event matches what has been found for previous FBOTs. Upcoming instruments and surveys will discover more FBOTs and spot them earlier in their evolution, transforming our understanding of these rare transients.
An Ultra-Long X-Ray and Gamma-Ray Transient, GRB 250702B
GRB 250702B is an exceptional gamma-ray burst: an intense flash of gamma rays lasting anywhere from a few milliseconds to several hours. GRB 250702B is unprecedented among events in this class because it features several bursts arising over the course of roughly 7 hours, plus X-ray precursor emission going back 24 hours before discovery. We’ve previously covered JWST follow-up observations of GRB 250702B, and today we’re taking a look at its high-energy evolution.
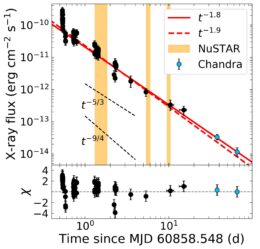
Swift (black circles) and Chandra (blue circles) observations of GRB 250702B. Click to enlarge. [Adapted from O’Connor et al. 2025]
Brendan O’Connor (Carnegie Mellon University) and collaborators collected observations of GRB 250702B from the Neil Gehrels Swift Observatory, the Nuclear Spectroscopic Telescope Array (NuSTAR), and the Chandra X-ray Observatory, stretching from just half a day after the transient was discovered to 65 days later. The team aimed to determine whether GRB 250702B fit the profile of an ultra-long gamma-ray burst accompanying a star’s collapse into a black hole or a relativistic tidal disruption event, in which a star is ripped apart by a massive black hole.
O’Connor’s team found that GRB 250702B didn’t fit neatly into either category. While many of the event’s properties closely resembled those of ultra-long gamma-ray bursts, the hours-long gamma-ray emission and the precursor X-ray emission were outliers. Certain features are more easily reconciled with the tidal disruption of a main-sequence star by an intermediate-mass black hole, but others are similarly hard to account for. Finding the smoking gun for a tidal disruption event — an abrupt shutoff to the X-ray emission — will require long-term X-ray monitoring.
Because GRB 250702B has features that align with both ultra-long gamma-ray bursts and tidal disruption events, O’Connor and coauthors proposed scenarios that combine aspects of both possibilities: either a stellar-mass black hole tidally disrupting a star or the merger of a helium star with a stellar-mass black hole.
The Most Massive Gravitational Wave Source, GW231123
When compact objects like neutron stars and black holes merge, their collisions produce ripples in spacetime that are accessible to detectors on Earth. One of the most exciting events so far from the fourth gravitational wave transient catalog is GW231123, which appears to be caused by the merger of two black holes, each at least 100 times the mass of the Sun. The LIGO, Virgo, and KAGRA (LVK) collaborations reported a total mass of 238 solar masses for the event, which would make it the most massive binary black hole merger yet observed.
In a recent article, Ilya Mandel (Monash University and OzGrav) urged caution when interpreting seemingly extreme events like GW231123. Mandel’s argument is a statistical one, highlighting how certain aspects of the Bayesian techniques used to estimate GW231123’s mass could have skewed that estimate toward an artificially high value.

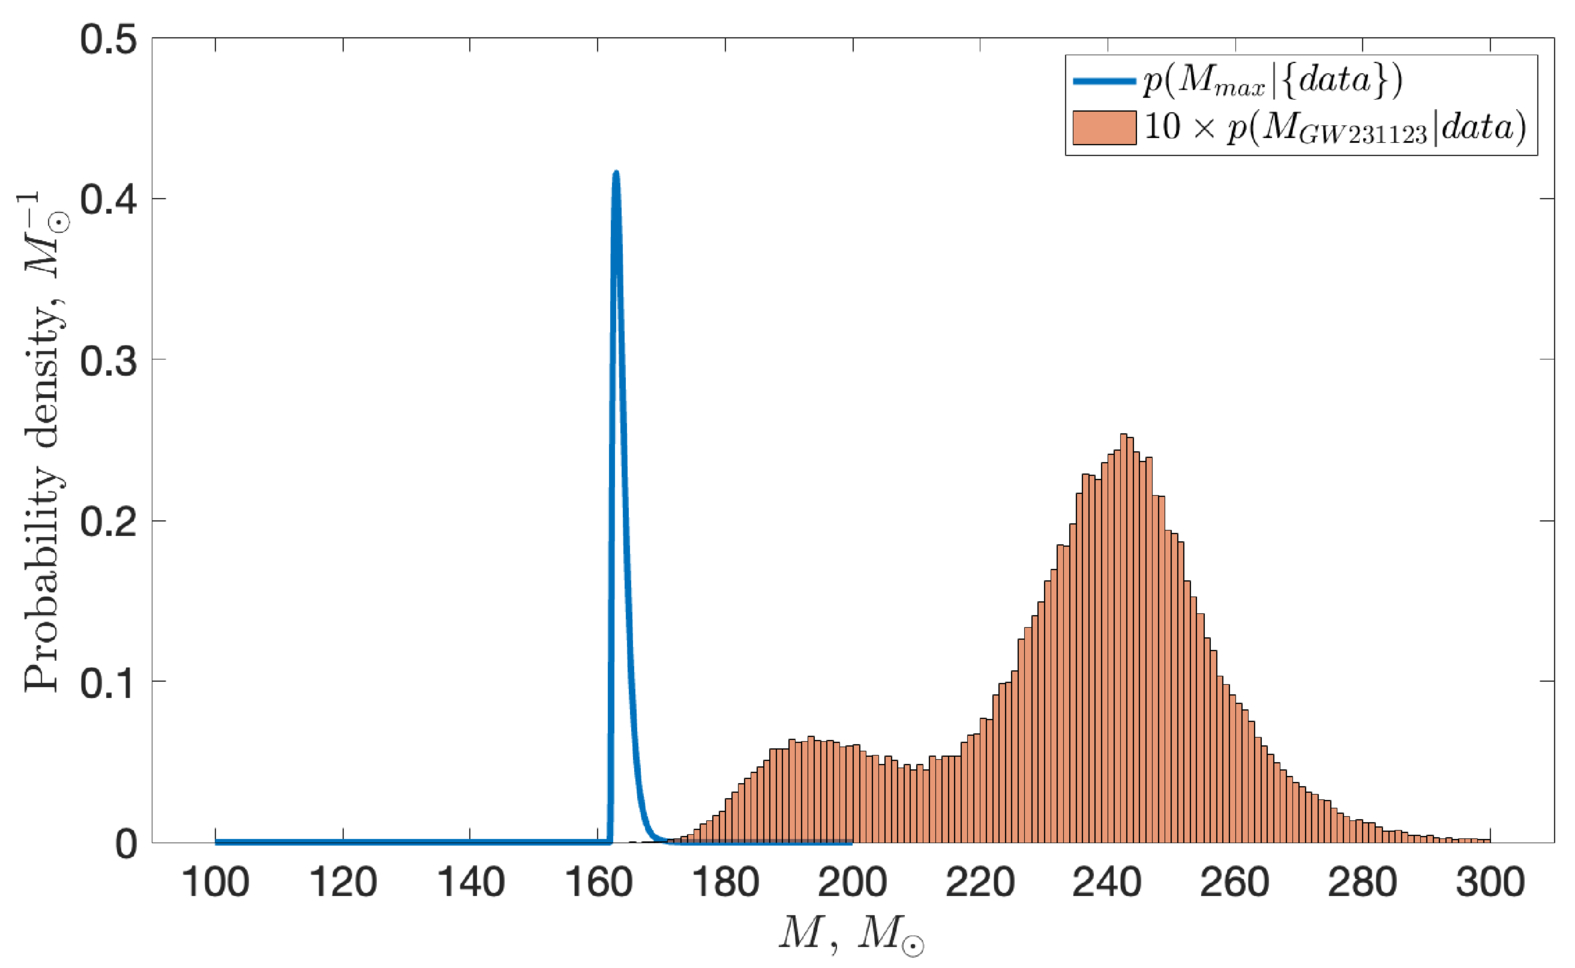
The posterior probability distribution on the maximum mass as derived from the total LVK catalog (blue), compared to the posterior for GW231123 (orange; multiplied by 10 for visibility). Click to enlarge. [Mandel 2026]
In general, Mandel points out, events that appear extreme are simply more likely to be statistical fluctuations. As an example, consider a large group of people having their heights measured, but with very large measurement uncertainties. The highest reported height in this situation is likely to be associated with a reasonably tall person whose height had a large upward measurement error, not necessarily someone who is exceptionally tall. Similarly, the reported most massive gravitational wave source is likely not quite as massive as claimed.
Mandel also demonstrated how considering the population of black hole mergers detected by LVK as a whole can provide a different perspective on GW231123’s likely mass. By analyzing this entire sample together, Mandel showed that the maximum mass for the population of merging black holes appears to be considerably lower than the mass estimated for GW231123, again raising the possibility that the true mass of the event is lower than the current estimate.
Ultimately, Mandel pointed out that at present it’s impossible to distinguish between three possibilities: that GW231123 is a true outlier among the population of merging black holes, representing a member of a new, unexplored population; that it’s a member of the same population as other black hole mergers seen by LVK but inhabits an extreme high-mass tail; or its high mass estimate is a statistical artifact.
Citation
“The Most Luminous Known Fast Blue Optical Transient AT 2024wpp: Unprecedented Evolution and Properties in the Ultraviolet to the Near-Infrared,” Natalie LeBaron et al 2026 ApJL 997 L10. doi:10.3847/2041-8213/ae2910
“Comprehensive X-Ray Observations of the Exceptional Ultralong X-Ray and Gamma-Ray Transient GRB 250702B with Swift, NuSTAR, and Chandra: Insights from the X-Ray Afterglow Properties,” Brendan O’Connor et al 2025 ApJL 994 L17. doi:10.3847/2041-8213/ae1741
“What Is the Most Massive Gravitational-Wave Source?” Ilya Mandel 2026 ApJL 996 L4. doi:10.3847/2041-8213/ae278d