Features RSS

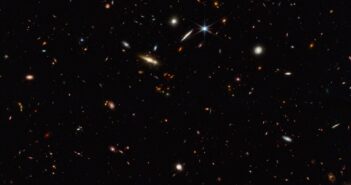
JWST image of a field of distant galaxies

JWST observations are poised to help astronomers study the surroundings of quasars — extremely luminous cores of galaxies in the early universe. The first analysis of a new survey of quasars reveals the structure of the cosmic web in the first billion years after the Big Bang.

Quasars in the Spotlight

illustration of a quasar

An artist’s illustration of a young galaxy hosting a quasar: an extremely luminous galactic nucleus powered by a supermassive black hole. [S. Munro; CC BY 4.0]

In the first few billion years of our universe, black holes at the centers of galaxies gained an incredible amount of mass. Their growth is apparent from the existence of quasars: blazingly bright centers of young galaxies powered by the rapid accretion of gas onto supermassive black holes.

Exactly how these supermassive black holes grew so quickly, bulking up to a billion solar masses in less than a billion years, is still up for debate. Researchers predict that in order for these black holes to reach their immense masses in such a short time, they must be located in areas densely populated with galaxies, where they’re constantly fed streams of cold gas.

Won’t You Be My Neighbor?

However, only some quasars in the early universe have been found to live in crowded regions. This might mean that the intense radiation from a quasar prevents galaxies from forming around it, or it might mean that the surrounding galaxies are simply very dusty, making them difficult to detect without a powerful infrared telescope.

JWST image of the quasar field

An infrared JWST image of the field containing J0305–3150. The colored circles indicate the 41 newly identified reionization-era galaxies. Red galaxies are at approximately the same redshift as the quasar, while orange and magenta indicate galaxies at redshifts of z = 5.4 and 6.2, respectively. All other galaxies in the sample are in green. Click to enlarge. [Wang et al. 2023]

Now, researchers are using JWST to carry out A SPectroscopic survey of biased halos In the Reionization Era (ASPIRE), a program that aims to understand whether quasars truly reside in crowded neighborhoods. The ASPIRE program will survey the surroundings of 25 quasars during the epoch of reionization — the period when the first stars illuminated the universe — searching for concentrations of galaxies known as galaxy overdensities. In today’s article,

Feige Wang (University of Arizona) and collaborators introduced the first results of this survey, focusing on a quasar called J0305–3150.

Using JWST’s Near Infrared Camera (NIRCam), Wang and collaborators discovered 41 epoch of reionization galaxies in the field of view containing J0305–3150. And while previous observations found no sign of a galaxy overdensity, the new observations revealed three galaxy overdensities! One of the galaxy clumps is located at the same redshift as J0305–3150, suggesting that this quasar resides in a crowded neighborhood.

Signs of the Cosmic Web

a three-dimensional map of the galaxies located near the quasar

A three-dimensional map of the galaxies located near J0305–3150. Galaxies identified via carbon emission lines are shown as orange circles while those identified via their oxygen emission lines are indicated with red circles. Click to enlarge. [Adapted from Wang et al. 2023]

The galaxies in J0305–3150’s neighborhood aren’t distributed randomly. Instead, they’re lined up in a narrow column. Wang and collaborators suggest that this arrangement is evidence for the formation of the filamentary structure of the cosmic web — the strands along which galaxies form, separated by vast bubbles called cosmic voids.

The filament found in this work happens to be about the size of protoclusters seen in cosmological simulations. After comparing their results against the predictions from simulations, Wang and collaborators suggest that J0305–3150 and the galaxies that surround it could someday collapse into a massive galaxy cluster like those present in the universe today. This study gives us a first look into what the ASPIRE team will discover — stay tuned for observations of 24 more quasars!

Citation

“A SPectroscopic Survey of Biased Halos in the Reionization Era (ASPIRE): JWST Reveals a Filamentary Structure around a z = 6.61 Quasar,” Feige Wang et al 2023 ApJL 951 L4. doi:10.3847/2041-8213/accd6f

illustration of a magnetar

New research proposes a way for fast radio bursts to escape the confines of a magnetized star and jet out into space — by getting help from theoretical particles called axions.

How to Make Cosmic Fireworks

example pulse and spectrum of a fast radio burst

An example band-averaged pulse (top) and spectrum (bottom) of a fast radio burst, FRB 170107. [Bannister et al. 2017]

Fast radio bursts — intense flashes of radio waves lasting a fraction of a second — were discovered by chance in 2007 and have puzzled astronomers ever since. Now, nearly two decades on from the discovery of these cosmic fireworks, we have plenty of theories for what causes them. Many theories have homed in on magnetars, the highly magnetized, extremely dense remnants of exploded massive stars.

Magnetar-based fast radio burst theories come in two main flavors: those in which the burst is generated close to the magnetar’s surface, and those in which the burst forms in the tangled stream of plasma that constantly flows out from the magnetar. The latter crop of models easily explains how fast radio bursts jet out into space, but they’re stymied by the bursts’ rapid variability. The former group of models naturally produces highly variable bursts, but they can’t yet explain how a burst escapes the magnetar’s surroundings, where there is a sea of plasma that scatters the burst and saps its energy.

There and Back Again

In a recent research article, Anirudh Prabhu (Princeton University) proposed a way for fast radio bursts to break free with a little help from theoretical particles called axions. Axions are thought to be extremely light, and their existence might solve a lingering problem in particle physics related to the properties of neutrons. These particles have also been proposed to be an important component of cold dark matter. (Prabhu emphasized that while axions happen to be a dark matter candidate, the validity of the fast radio burst model doesn’t hinge on axions actually being dark matter.)

Axions are thought to couple to photons, and under the right conditions, they can convert into photons and vice versa. Because of this property, Prabhu suggested that fast radio burst photons can sneak through the plasma surrounding the magnetar disguised as axions. When the coast is clear, so to speak, the axions convert back to photons and the burst continues on its journey into space.

diagram showing the axion-mediated fast radio burst model

A schematic of the proposed process. Axions (black dashed line) are produced close to the magnetar’s surface, at the distance indicated by the yellow circle. They travel outward through the magnetar wind (purple) and reconvert into radio photons (blue wavy line). [Prabhu 2023]

An Axion Answer

Here’s how that might work, physically. After a radio burst is generated near the magnetar’s surface, strong electric fields pointing parallel to the background magnetic field transform photons into axions, creating an axion burst. The axion burst travels outward, streaming along with the outflowing plasma wind as the magnetar’s magnetic field weakens. At a certain point, the axion burst begins to resonate with the surrounding plasma, regenerating a radio burst with properties similar to the original radio burst.

Prabhu notes that this theory works for any process that generates a strong parallel electric field close to the magnetar’s surface, such as a magnetar flare. The clincher for the axion theory would be the detection of axions associated with a fast radio burst, the feasibility of which Prabhu plans to explore in upcoming work.

Citation

“Axion-Mediated Transport of Fast Radio Bursts Originating in Inner Magnetospheres of Magnetars,” Anirudh Prabhu 2023 ApJL 946 L52. doi:10.3847/2041-8213/acc7a7

artist's impression of the gravitational wave background from a supermassive black hole binary sweeping across an array of pulsars

For the first time, researchers using pulsar timing arrays have found evidence for the long-sought-after gravitational wave background. Though the exact source of this low-frequency gravitational wave hum is not yet known, further observations may reveal it to be from pairs of supermassive black holes orbiting one another or from entirely new physics at work in our universe.

A New Window onto Gravitational Waves

In 2016, researchers reported the first detection of gravitational waves by the Laser Interferometer Gravitational-Wave Observatory (LIGO), opening a new window onto a universe’s worth of collisions between extreme objects like black holes and neutron stars. Though this discovery marked the beginning of a new observational era, many sources of gravitational waves remained beyond the reach of our current detectors on Earth.

simulation of a supermassive black hole binary system

Visualization of a simulation of a supermassive black hole binary system. [NASA’s Goddard Space Flight Center/Scott Noble; simulation data, d’Ascoli et al. 2018]

In particular, while existing gravitational wave observatories can spot the collision of two stellar-mass black holes, they can’t access the low-frequency gravitational waves expected to come from massive objects like pairs of supermassive black holes slowly spiraling toward each other at the centers of merging galaxies. The overlapping low-frequency rumblings of supermassive black hole binaries across the universe are theorized to create a constant low-amplitude hum known as the gravitational wave background.

Decades ago, researchers proposed that large numbers of stellar remnants called pulsars could provide a way to detect the low-frequency signal of the gravitational wave background. Today, several international collaborations announced their discovery of significant evidence for the gravitational wave background as seen by pulsar timing arrays.

Keeping Time with the Best Clocks in the Universe

Let’s break down exactly what that means, starting with the precise timing of pulsars. Pulsars are extremely dense, rapidly spinning remnants of massive stars that exploded as supernovae. Just one teaspoon of pulsar matter, brought to Earth, would weigh billions of tons. As pulsars spin, they emit narrow beams of radio waves along their poles. When these beams sweep past Earth, we detect the pulses of radio emission from which pulsars get their name. Typical pulsars spin once every few seconds to milliseconds, and they do so with incredible regularity, varying by only one part in 10 quadrillion from pulse to pulse.

composite image of the Crab Nebula

A composite X-ray, optical, and infrared image of the Crab Nebula, which is energized by the pulsar at its center. [X-ray: NASA/CXC/SAO; Optical: NASA/STScI; Infrared: NASA-JPL-Caltech]

Even among pulsars, the most precise timepieces in the universe, there are superlatives — millisecond pulsars that spin hundreds of times each second keep the best time of all. Surprisingly, though pulsars tend to slow down over time, millisecond pulsars are among the oldest of their kind; these pulsars have spun up to their incredible speeds by accreting gas from a stellar companion. Because millisecond pulsars are so regular, it’s theoretically possible to identify a passing gravitational wave by keeping tabs on their pulses; a minuscule compression in spacetime between us and a pulsar will hasten the approach of a pulse, while a tiny expansion in spacetime will delay it.

An Array of Spinning Stars

In reality, there are several reasons why an individual pulse’s arrival time at Earth might vary. The many light-years between us and these radio beacons is filled with ever-shifting clouds of gas and dust, which scatter and delay radio signals. Many millisecond pulsars are constantly swinging in a gravitational dance with their stellar companions. Some pulsars also undergo sudden increases in their spin rate, called glitches, due to starquakes or changes in their interiors.

This is where keeping tabs on many pulsars at once comes in handy. If you survey a collection of pulsars scattered across our galaxy, intervening dust or glitches will affect some pulsars and not others. Gravitational waves from distant sources, on the other hand, send ripples through spacetime that will affect the pulse arrival times of widely separated pulsars in a coordinated way. By searching for correlations among the arrival times of pulses from dozens of pulsars at once — i.e., using a pulsar timing array — researchers hope to uncover the signature of gravitational waves.

Bringing the Background to the Foreground

graphic showing the locations of stars in the pulsar timing array

Locations of pulsars (blue stars) in the NANOGrav pulsar timing array relative to the location of the Sun (yellow star). Some pulsar locations are approximate. Click to enlarge. [Ross Jennings / NANOGrav; CC BY 4.0]

International collaborations located in North America, Europe, India, Australia, and China have surveyed multiple pulsar timing arrays for this purpose, and today several collaborations have announced their discovery of significant, compelling evidence for the gravitational wave background. In a new Focus Issue published in the Astrophysical Journal Letters, a pulsar timing array monitored by radio telescopes across North America — the North American Nanohertz Observatory for Gravitational Waves, or NANOGrav — has laid out their new findings and the implications of their work.

Over the past 15 years, the NANOGrav collaboration has collected radio data from 68 pulsars in the Milky Way to search for gravitational waves. This long baseline of observations is necessary to capture the years- or decades-long undulation of gravitational waves from circling supermassive black holes.

Not only does the search for the gravitational wave background require years of observations, it also needs the utmost precision: the signal caused by passing gravitational waves is incredibly small, causing spacetime to stretch or compress by just one part in one quadrillion. This is far smaller than the normal fluctuations in an individual pulsar’s timing due to intervening gas and dust.

Plot of correlation strength as a function of the angle between pulsars in the array

Observed correlation between pulse arrival time discrepancies (blue points) and the correlation predicted by general relativity from a background due to supermassive black hole binaries (black dashed line). [NANOGrav]

To extract the gravitational wave signal from the array, researchers with the NANOGrav collaboration modeled the expected arrival time for the pulses from each pulsar in the array, then searched for correlations among the deviations in the pulse arrival times. The correlations that emerged from this analysis appear to match the predictions of Einstein’s general theory of relativity for the impact of gravitational waves. By running statistical tests on their data, the team concluded that the odds of the correlations they see being random are less than 1 in 1,000 — in other words, it’s highly likely that they’ve detected the anticipated low-frequency gravitational wave background and the rumblings of supermassive black hole binaries at last.

Are supermassive black hole binaries the only possible source of the gravitational wave background? No, though they’re still the leading candidate; the NANOGrav team reports that their observations are consistent with black holes that sink toward each other purely due to emitting gravitational waves as well as those that are interacting with their environment, engulfing and flinging nearby gas as the black holes swing around each other. However, exotic new physics, such as certain cosmic inflation scenarios or the existence of ultra-light dark matter, are a potential source as well. Some of these new physics models fit the data better than models of supermassive black hole binaries do, but the team notes that the models rely on major assumptions that are not yet proven valid.

From Evidence to Detection

The NANOGrav collaboration has been careful to refer to their findings as evidence for the gravitational wave background rather than a detection of it. What’s needed to push this discovery into coveted 5-sigma territory? Luckily, the answer is probably just that we need more time — time for the NANOGrav team to combine their observations with those of other pulsar timing array collaborations, or simply time to let the already impressive 15-year baseline of the project increase. In addition to declaring a firm detection of the gravitational wave background, the NANOGrav team expects that future observations should allow us to disentangle the source of the background hum and even pinpoint individual supermassive black hole binaries for further study. It’ll be fascinating to watch the frontier of this new field advance in leaps and bounds!

For more information, check out the Focus Issue in the Astrophysical Journal Letters here: Focus on NANOGrav’s 15 yr Data Set and the Gravitational Wave Background

Citation

“The NANOGrav 15-year Data Set: Evidence for a Gravitational-Wave Background,” Sarah Vigeland et al 2023 ApJL 951 L8. doi:10.3847/2041-8213/acdac6

“The NANOGrav 15-year Data Set: Observations and Timing of 68 Millisecond Pulsars,” Joseph Swiggum et al 2023 ApJL 951 L9. doi:10.3847/2041-8213/acda9a

“The NANOGrav 15-Year Data Set: Detector Characterization and Noise Budget,” Jeffrey Hazboun et al 2023 ApJL 951 L10. doi:10.3847/2041-8213/acda88

“The NANOGrav 15-year Data Set: Search for Signals from New Physics,” Andrea Mitridate et al 2023 ApJL 951 L11. doi:10.3847/2041-8213/acdc91

An image of a large, bright white star, center, and a much fainter, smaller, red star at lower left.

Having caught the gigantic, golden eye of JWST several times now, brown dwarfs are having a moment. A new article in The Astrophysical Journal Letters describes the latest planetary-mass companion to take the spotlight, and how our understanding of these mysterious objects is rapidly evolving.

A Popular Runt

Of all the known tiny, barely glowing “failed stars” known to astronomers as brown dwarfs, TWA 27B stands out as a particularly rich target for a number of reasons. As a member of the TW Hydrae association, the youngest group of stars within the nearest few hundred light-years of the Sun, TWA 27B is both exceptionally young and helpfully close by. Also, as a product of the earliest successful campaign to directly image small companions of larger objects, it has the longest track record of observations that can compared with new measurements. Acting on these temptations, JWST took a look at TWA 27B and its slightly larger partner, TWA 27A, in February of this year.

A six-panel arrangement of images, each of which shows close-up images of what looks like two stars. In the bottom row, the brighter star is partially subtracted away, emphasizing the dimmer one.

Images of the TWA 27 system created using three different grisms aboard the NIRSpec instrument. The top row shows both objects, while the bottom shows an enhanced view of TWA 27B created by subtracting out its brighter companion. [Luhman et al. 2023]

Methane-Free Zone

For about half an hour, JWST aimed at the TWA 27 system and dutifully collected photons with its onboard Near-Infrared Spectrograph (NIRSpec) instrument across three different wavelength ranges. Piecing the data together back on the ground, a team led by Kevin Luhman, Pennsylvania State University, revealed the atmosphere of a 10 million years young, 5–6-Jupiter-mass object, interestingly devoid of any methane and with only a small whiff of carbon monoxide. Both of these chemical species are common in older brown dwarfs but seem to vanish among younger ones due to non-equilibrium chemistry — a recently noted trend that these observations bolster.


A flux vs. wavelength plot, spanning 1 to 5 microns on the X axis and 0-1 on the Y axis, in units of (10^(-17) times erg per cm squared per second per angstrom). The data are shown in black, while the best fitting model is overplotted in red. The model traces the largest features of the data quite well.

The full 1–5-micron spectrum obtained of TWA 27B, compared to the best-fitting model spectrum derived from a simulation of a cloudless atmosphere. Although the model qualitatively follows the spectrum well, it overpredicts both the strength of the methane absorption and the object’s temperature. The discrepancies might be corrected with a more complex model that includes clouds. [Luhman et al. 2023]

Hungry Brown Dwarf?

Tantalizingly, the team also noticed that while their spectra did not indicate the smoking-gun signatures of a large circumstellar disk (an apparent “excess” of infrared emission), they did reveal that TWA 27B was emitting at specific wavelengths usually associated with accretion. This raises the possibility that the object is still growing slowly, and that it’s ringed by a tiny disk never before inferred over the long and distinguished trail of previous studies.

Thankfully, this cliffhanger provides a possible resolution: if such a disk exists, it will be obvious in observations taken at longer wavelengths. JWST, once again demonstrating its abilities to see what has never before been seen, has already taken these measurements. Data collected with its Mid-Infrared Instrument (MIRI) are being processed now, meaning the flood of unprecedented observations and accompanying discoveries about brown dwarfs is unlikely to stop soon.

Citation

“JWST/NIRSpec Observations of the Planetary Mass Companion TWA 27B,” K. L. Luhman et al 2023 ApJL 949 L36. doi:10.3847/2041-8213/acd635

Illustration of a gaseous exoplanet orbiting a Sun-like star

Researchers have measured the alignment between a sub-Saturn-mass exoplanet and its massive host star for the first time. This measurement, which shows that the planet is misaligned relative to its host star’s spin, prompted a new theory for how misalignment arises in planetary systems.

Stellar Spin vs. Planetary Orbit

illustration of spin–orbit alignment and misalignment

Star–planet systems demonstrating spin–orbit alignment (top) and spin–orbit misalignment (bottom). [AAS Nova/Kerry Hensley]

Observations of exoplanetary systems have revealed a wide variety of orbital geometries, including planets that orbit in a completely different direction than their host stars are spinning. Researchers have measured the spin–orbit misalignment for dozens of hot Jupiter exoplanets and unearthed a trend: hot Jupiters orbiting small, cool stars are aligned with their stars’ spins, while hot Jupiters orbiting larger, hotter stars can be either aligned or misaligned.

This trend in spin–orbit misalignment hints at how these planetary systems formed and evolved. Previously, researchers suggested that hot Jupiters around small, cool stars tend to be aligned because tidal forces acting on the star’s atmosphere cause it to reorient its spin to align with the orbit of the planet. Larger, hotter stars are less susceptible to this effect, making misaligned hot Jupiters in these systems more common. This seems to tidily explain what’s going on for massive planets, but what about smaller planets?

An animation of the Rossiter–McLaughlin effect

An animation of the Rossiter–McLaughlin effect. [Wikipedia user Amitchell125; CC BY-SA 4.0]

Into a New Domain

In a recent research article, a team led by Kyle Hixenbaugh (Indiana University) measured the spin–orbit misalignment between TOI-1842, a 1.45-solar-mass star, and its planet that is slightly less massive than Saturn. This is the first time this measurement has been made for a sub-Saturn-mass planet around a high-mass star (here, high mass means more than 1.2 solar masses).

To determine TOI-1842’s spin, the team observed the slight change in the star’s apparent radial velocity as the planet passed in front of the oncoming and receding sides of the star, known as the Rossiter–McLaughlin effect. Using models to simulate the star’s light curves and radial velocity measurements, the team found that the planet is considerably misaligned from its star.

Making Sense of Misalignment

Based on this measurement, Hixenbaugh and collaborators proposed a new framework to explain the observed trends in spin–orbit misalignment. Instead of tidal dissipation being the driving force, the team proposed that the number of planets in the system plays a defining role. Because the mass of a protoplanetary disk increases with the mass of the star, low-mass stars are likely only able to form a single Jupiter-mass planet, while higher-mass stars have enough material to create multiple Jupiter-mass planets. A single planet around a low-mass star thus forms in a calm environment and is likely to remain aligned to its star, while a planet with multiple Jupiter-mass siblings is knocked off kilter by gravitational interactions.

plot showing alignment versus misalignment for several exoplanetary system

Planetary mass versus stellar mass for systems for which the spin–orbit angle has been measured. Aligned systems are plotted as open circles and misaligned systems are plotted as filled triangles. Click to enlarge. [Hixenbaugh et al. 2023]

While low-mass stars can likely only form a single Jupiter-mass planet, they have enough material to form multiple Saturn-mass or sub-Saturn-mass planets. This means that a sub-Saturn-mass planet around a small, cool star could experience gravitational kicks and nudges from its siblings, knocking it out of alignment, while a Jupiter-mass planet could not. A sub-Saturn-mass planet around a large, hot star is also likely to have multiple planetary siblings and be misaligned. This framework is consistent with observations, though it doesn’t exclude the possibility that tidal forces play a role as well. Hixenbaugh’s team notes that more observations are needed to test the new hypothesis.

Citation

“The Spin–Orbit Misalignment of TOI-1842b: The First Measurement of the Rossiter–McLaughlin Effect for a Warm Sub-Saturn around a Massive Star,” Kyle Hixenbaugh et al 2023 ApJL 949 L35. doi:10.3847/2041-8213/acd6f5

Very Large Array antennas

What has 28 dishes, changes size every four months, and surveys the sky day and night? The Very Large Array, of course! After the conclusion of the 242nd AAS meeting in Albuquerque, NM, AAS Media Fellow Ben Cassese and I joined members of the media for a tour of this exceptional facility.

A Telescopic Tour

a view of a VLA dish from below

Looking up at one of the 25-meter dishes. [AAS Nova/Kerry Hensley]

The Very Large Array, or VLA, is a premier radio astronomy observatory located two hours south of Albuquerque in the Plains of San Agustin. The VLA’s storied history began in the 1960s, when astronomers began to push for an array of radio dishes to complement the science being done with single dishes like the ones at Green Bank and Arecibo. Science operations at the VLA began in 1976. The VLA’s dishes work together as an interferometer, in which signals from multiple telescopes are combined to give the sensitivity of a single dish with an area equal to the combined area of the dishes in the array and the resolution of a single dish as wide as the largest distance between dishes in the array.

The VLA is sited on a flat expanse of desert surrounded by mountains, and the dry climate, high altitude, and isolation from civilization make it an ideal location for a radio observatory. The isolation is necessary because of the dishes’ sensitivity, which makes them vulnerable to terrestrial radio interference — compare the strength of a typical 5-Watt cellphone signal from someone standing nearby to a 10-23 W/m2/Hz signal from a distant galaxy. Luckily, having multiple dishes working together provides another defense: signals spotted by only some of the antennas or that arrive at some antennas before the rest are suppressed.

A Very Large Array antenna transporter sitting on the railroad tracks

To enter or exit the maintenance barn, the antenna-laden transporter must execute a 90-degree turn. [AAS Nova/Kerry Hensley]

Another feature of the VLA is its maneuverability. Every four months, operators guide the VLA’s enormous dishes into a new configuration, cycling through four configurations every 16 months. Yes, that’s right — the 220-ton dishes move, taxiing to their new locations on the back of a transporter that glides along railroad tracks at 5 miles per hour. In its most compact form, the array’s antennas are snuggled together within a square mile. At its most extended, the dishes span 22 miles. Because of the need to cycle through the observing configurations, observations for a single project can take more than a year if the project requires several different observing configurations.

Astronomers who use the VLA for research will be familiar with the process of applying for time on the array and eagerly awaiting the data if time is awarded — but what goes on behind the scenes to support our science?

Getting a Bird’s-Eye View

A dish in the antenna assembly barn

Dish number 28 undergoing maintenance in the antenna assembly barn. Remarkably, there are only three points of contact between the base of the antenna and the transporter. [AAS Nova/Kerry Hensley]

As our tour of the observatory grounds began, Rob Selina and Bill Hojnowski explained what goes into maintaining and upgrading the VLA. In the antenna assembly barn, we were able to see one of the VLA’s 28 dishes undergoing maintenance. While the VLA contains 28 dishes, only 27 are active in the array at a time, with the final dish undergoing regular maintenance in the barn. An antenna typically spends about three years taking data in the array in between trips to the barn along the railroad tracks. The miles of railroad track along which the dishes travel are a considerable source of maintenance work, with about 2,000 railroad ties and 30,000 pounds of ballast needing to be replaced each year.

Next, we were treated to a rare opportunity: climbing into one of the dishes! After donning mandatory hard hats, our group scaled a narrow metal staircase that zigzagged up to the top of the support structure — not recommended if you have an intense fear of heights — and emerged through a trapdoor into the dish itself.

Kerry Hensley and Ben Cassese in a VLA antenna dish

Media Fellow Ben Cassese and I staying cool (and taking in the very cool views!) up in the dish. Hard hat required, sunglasses highly recommended! [AAS Nova/Kerry Hensley]

From that vantage point, we could see the dish’s eight radio receivers, each of which is optimized for a different frequency range. As Rick Perley (the VLA’s first postdoc, who has worked at the VLA since 1977) and Rob Long explained, having multiple receivers allows for observations at frequencies from 74 megahertz to 50 gigahertz, depending on what the science requires. Up in the dish, one thing was clear: things can get hot up here! Keeping things cool is a major challenge at the VLA; the New Mexico desert gets hot, and the sensitive instruments need to be cooled to perform their best. Most of the VLA’s $3 million annual electricity bill goes toward the compressors in the cooling system.

A view of a Very Large Array antenna from the ground

If you zoom in closely, you’ll see a bird’s nest in the supports. [AAS Nova/Kerry Hensley]

The cooling issue is just one of many engineering and maintenance challenges that have been surmounted by the VLA staff over the decades. They’ve handled everything from finding the best way to paint the dishes without affecting their performance, to figuring out how to connect wires from a rotating dish to a stationary platform, and even managing the birds that build their nests in the dish support structures — and as the VLA expands in the coming decade, new challenges are sure to arise.

A panorama of the interior of a VLA dish

A panoramic view from up in the dish. The receivers are visible jutting out from the surface of the disk. [AAS Nova/Kerry Hensley]

What’s Next for the VLA?

The next phase for the VLA, known as the Next Generation VLA or ngVLA, will include 263 antennas spread across 500 miles. Because of the immense distances involved, the dishes can no longer travel back to the barn when maintenance is needed. Instead, technicians will need to meet the dishes where they are, as far afield as Hawaii, Puerto Rico, and New Hampshire.

An artist's impression of the ngVLA

An artist’s impression of the ngVLA. [Sophia Dagnello, NRAO/AUI/NSF; CC BY 3.0]

Each dish will be roughly half the size of the current VLA dishes but more sensitive, yielding about the same observing power as the current dishes. The result will be an array with ten times the sensitivity of the VLA and up to one thousand times finer resolution. The new dishes passed preliminary design review in December 2022 and will be shipped to the site in early 2024. If things go smoothly, full science operations should be underway in 2035 — and I can’t wait to see the great research made possible by the ngVLA!

Visitation Information

If visiting the VLA sounds fun to you, you’re in luck — the VLA is open to the public 362 days a year with guided tours on the first and third Saturdays of each month. Unfortunately, the antenna climb isn’t part of the standard tour package! Visitation details can be found here.

Hubble image of the quasar 3C 273

Researchers have peered back to the first billion years of the universe to study the behavior of quasars. What they learned about the typical luminosities of quasars during that era can tell us about the role quasars played during the epoch of reionization.

Quasars in the Early Universe

simulation of galaxies during the epoch of reionization in the early universe

Simulation of galaxies ionizing hydrogen gas (bright areas) during the epoch of reionization. [M. Alvarez (http://www.cita.utoronto.ca/~malvarez), R. Kaehler, and T. Abel/ESO; CC BY 4.0]

Quasars are incredibly luminous galactic centers powered by growing supermassive black holes. The advent of all-sky surveys enabled the discovery of quasars in the first billion years of the universe’s history, and astronomers study these powerful objects to understand the conditions in the early universe and get a sense of how quickly supermassive black holes grew at that time.

With the population of known quasars ever growing, researchers can begin to study the characteristics of quasars as a whole rather than focusing on single objects. This means we can probe the role that quasars played during the epoch of reionization: the period during which the universe’s neutral hydrogen gas was ionized by light from the first stars. Researchers are still debating precisely when reionization occurred, how long this period lasted, and which galaxies or cosmic objects contributed the most ionizing photons to the cause.

Plot of quasar luminosity functions measured from several sources

The quasar luminosity function from this work (magneta circles and black lines) compared to luminosity functions measured in other studies. Click to enlarge. [Adapted from Matsuoka et al. 2023]

Finding a Functional Form

Yoshiki Matsuoka (Ehime University) and collaborators studied a sample of 35 quasars around a redshift of z = 7, which corresponds to roughly 800 million years after the Big Bang. The team set out to determine the quasar luminosity function, which describes the number of quasars present at a given luminosity. If the function is flat, that means that quasars of all luminosities are equally common, while a top-heavy function is skewed toward bright quasars and a bottom-heavy function is weighted toward faint quasars.

Using data from Pan-STARRS1, the DESI Legacy imaging Surveys, the UKIRT/VISTA Hemisphere Surveys, the WISE survey, and the Subaru High-z Exploration of Low-luminosity Quasars (SHELLQs) project, the team found that the “knee” of the distribution is located at a magnitude of –25.6. The shape of the quasar luminosity function at z = 7 is similar to the shapes of the luminosity functions at lower redshifts, though there are fewer quasars at any given luminosity at z = 7 than at lower redshifts.

Reckoning with Reionization

plot of quasar luminosity functions at different redshifts

The z = 7 quasar luminosity function determined in this work (magenta) compared to the luminosity functions at lower redshift. Click to enlarge. [Adapted from Matsuoka et al. 2023]

Matsuoka’s team used their measured quasar luminosity function to determine the number of ionizing photons contributed by quasars during reionization. Bright though quasars may be, the team found that they contributed less than 1% of the photons necessary to achieve the rate of reionization at that time.

There will be more to learn about quasars’ role during reionization once we establish observatories and surveys capable of detecting substantial numbers of quasars even farther back in the universe’s history; the team noted that upcoming data from the Vera C. Rubin Observatory, the Nancy Grace Roman Space Telescope, and the Euclid space telescope will push the quest for quasars out to even higher redshifts.

Citation

“Quasar Luminosity Function at z = 7,” Yoshiki Matsuoka et al 2023 ApJL 949 L42. doi:10.3847/2041-8213/acd69f

A photograph looking down a trail lined with tall trees and mossy rocks on either side. Fog obscures the view along the trail and up towards the sky.

In the coming decade, astronomers plan to discover thousands of rare, poorly understood, exotic transients. However, telling these apart from the torrent of “normal” flashes quickly enough for useful follow up observations will pose a daunting challenge. Thankfully, new algorithms powered by machine learning techniques may be able to triage for us.

Transient Triage

Though it may appear tranquil and unchanging to the casual observer, if one looks carefully, they find that the night sky is actually crackling with small, slow flashes. Thanks to modern cameras and computers, astronomers have grown increasingly attentive and now catch more of these flashes than ever before. The community flags about 20,000 so-called “transients” each year, and the rate is only expected to grow in the next decade.

A large number of astronomical events, such as thermonuclear and core collapse supernovae, produce roughly similar-looking flashes, so simply spotting one does not reveal much useful information. To better study the underlying physics powering each transient, astronomers must revisit each with different types of detectors. Unfortunately, the staggering pace of discovery is too fast to thoroughly follow up on every transient. Faced with finite telescope time, astronomers need to play a constant game of triage: which transients could uncover something interesting with additional follow up, and which are just more run-of-the-mill supernovae that we can allow to fade unwatched without worry of missing something exciting? An increasingly promising way to decide is to cede the choice to a machine learning algorithm.

FLEET and the Forest

A 2D scatterplot where each point represents a single archival transient. The X axis marks the probability assigned by FLEET 2.0 of a transient corresponding to a superluminous supernova, and the Y axis marks the same but from FLEET 1.0. True known superluminous supernovae are shown in blue, and in general, they either lie in the upper right corner, or further along the X axis than Y.

A comparison of the old FLEET 1.0 algorithm and the improved FLEET 2.0. Here, both random forests were asked to consider archived observations of many previous transients. FLEET 2.0 generally outperformed its predecessor and uncovered tens of transients that may have actually been superluminous supernovae but went undiagnosed before fading. [Gomez et al. 2023a]

A pair of recent articles in the Astrophysical Journal led by Sebastian Gomez (Space Telescope Science Institute) details the performance and recent upgrades of one such algorithm. Named “Finding Luminous and Exotic Extragalactic Transients,” or FLEET, this random-forest classifier takes in the first few days of observations of a transient and metadata about its host galaxy, then outputs the probability that the transient is a certain type of astronomical event.

Gomez and collaborators were particularly interested in two types of rare explosions: superluminous supernovae and tidal disruption events. The community has only ever observed a handful of each, though more are likely hiding in the constant stream of transient discoveries. By training FLEET to latch onto subtle differences between transients and quickly extract the underlying event, the team could prioritize follow-up resources to target promising candidates and expand their so-far sparse catalogs.

A histogram with redshift on the X axis and number of TDEs/year on the Y. Below a redshift of 1, LSST should find 10^4 TDEs/year, of which FLEET would recover roughly 1,000.

They expected number of tidal disruption events the Vera C. Rubin Observatory will observe each year during its LSST program, and the number of those which FLEET is expected to confidently flag as a candidate worthy of follow up. Note that currently astronomers have observed fewer than 100 tidal disruption events. [Gomez et al. 2023a]

Since its original release in 2020, FLEET is responsible for flagging 41% of all recorded superluminous supernovae. Even more exciting than its previously impressive performance, however, is its future potential. The team made sure that their algorithm could plug into data streams of future surveys, like the upcoming Vera C. Rubin Observatory Legacy Survey of Space and Time (LSST) and Roman High Latitude Time Domain Survey, the former of which is expected to observe, but not immediately recognize, up to 10,000 tidal disruption events alone each year. Using FLEET, the community could extract up to 2,000 of these events each year for further study. Considering that our current understanding of these chaotic processes is built on fewer than 100 observations, this would revolutionize the field in ways we can’t yet predict.

Citations

“Identifying Tidal Disruption Events with an Expansion of the FLEET Machine-learning Algorithm,” Sebastian Gomez et al 2023 ApJ 949 113. doi:10.3847/1538-4357/acc535

“The First Two Years of FLEET: An Active Search for Superluminous Supernovae,” Sebastian Gomez et al 2023 ApJ 949 114. doi:10.3847/1538-4357/acc536

JWST image of the Phantom Galaxy

The Physics at High Angular resolution in Nearby GalaxieS (PHANGS) program predates JWST, beginning with observations of carbon monoxide gas in 90 nearby spiral galaxies with the Atacama Large Millimeter/submillimeter Array (ALMA). Observations with the Hubble Space Telescope and the Very Large Telescope followed, diving deeper into a subset of these galaxies. Now, JWST has embarked on a new phase of the survey, aiming to perform 2–21 micron (1 micron = 10-6 meter) imaging of 19 galaxies in the PHANGS sample. The PHANGS–JWST First Results focus issue introduces JWST data of four galaxies, delving into the complex relationship between star formation, stellar feedback, and the conditions of the interstellar medium.

Janice Lee (NOIRLab and Steward Observatory) and collaborators introduced the survey, describing the 19 galaxies that JWST will observe by mid-2023. Importantly, all 19 of these galaxies have also been observed by Hubble, ALMA, and the Very Large Telescope, providing a broad multi-wavelength view of star formation in nearby galaxies. The four galaxies analyzed in the focus issue — NGC 7496, IC 5332, NGC 628, and NGC 1365 — were observed in summer 2022 using JWST’s Near Infrared Camera (NIRCam) and Mid-Infrared Instrument (MIRI). The articles published in the focus issue are introduced below, loosely grouped into four research themes.

Perspectives on Polycyclic Aromatic Hydrocarbons

Polycyclic aromatic hydrocarbons (PAHs) are organic molecules made up of multiple rings of carbon atoms. These sooty molecules are an important component of a galaxy’s interstellar medium; PAHs absorb the light from young stars and reprocess it, shining warmly in the infrared. About 20% of the infrared light we see from a star-forming galaxy comes from these molecules.

maps of NGC 628 showing emission from PAHs and stars

Maps of the galaxy NGC 628 showing the 3.3-micron emission due to PAHs (left) and stars (right). [Sandstrom et al. 2023]

Karin Sandstrom (University of California, San Diego) led two research groups on studies of PAHs in nearby galaxies. In the first article, the team mapped four galaxies at 3.3 microns, separating the PAH emission from the stellar emission. They showed that the proportion of 3.3-micron light arising from PAHs relative to stars varies from galaxy to galaxy and radially within each galaxy, reaching a value as high as 65% in some regions. In the second article, the team explored the possibility of using PAH emission as a way to trace the density of gas and dust in the interstellar medium. Ultimately, while the technique needs further refinement, calibration, and study, it’s a promising way to study the stuff between the stars.

Two research teams led by Jérémy Chastenet (Ghent University) also tackled aspects of PAH emission. In the first article, the team studied how the fraction of interstellar dust found in the form of PAHs changes with a variety of factors, including the abundance of metals (elements heavier than helium). In the second article, the team found that PAHs tend to be hotter and more ionized in the vicinity of HII regions — bubbles of glowing ionized hydrogen gas created by young stars.

images of three galaxies with star clusters indicated

Locations of star clusters (white circles) in three of the four galaxies in the sample. The background images are taken in JWST’s 7.7-micron filter. The scale bar is 1 kiloparsec/3,262 light-years. Click to enlarge. [Dale et al. 2023]

Daniel Dale (University of Wyoming) and collaborators studied how the intense radiation from young stars affects the properties of PAHs in their surroundings. By analyzing 1,063 tight-knit star clusters and 2,654 looser stellar associations and comparing the results to models, Dale’s team showed that PAHs tend to be more ionized in the vicinity of star clusters.

A collaboration led by Oleg Egorov (Heidelberg University) investigated how PAHs in star-forming regions might meet their demise. In their analysis of 1,529 HII regions across four galaxies, the team found that PAHs are likely destroyed by ultraviolet radiation from young stars.

Tracing Structures of Gas and Dust

Using JWST’s precision imaging, researchers can examine and interpret fine structures traced by gas and dust. David Thilker (Johns Hopkins University) and collaborators studied filamentary dust structures, creating maps that allowed them to compare structures seen in infrared PAH emission and those seen via scattering or absorption of visible photons.

Adam Leroy (Ohio State University) led two teams in using emission lines to trace gaseous structures. In one article, Leroy’s team compared JWST data to previous observations of the four galaxies in the sample made at optical and submillimeter wavelengths. The mid-infrared emission seen with JWST was well correlated with the optical (H-alpha) and submillimeter emission, suggesting that JWST can trace both the presence of dust and heating by stars. In the second article, the team explored correlations between the mid-infrared emission measured by JWST and submillimeter emission from carbon monoxide molecules. These correlations, many of which were remarkably intact across all of the galaxies studied, can be used to inform future studies of mid-infrared emissed seen by JWST.

Three-color multi-wavelength image of the galaxy NGC 628

A three-color image of NGC 628 composed of 21-micron JWST imaging (red), H-alpha emission imaged by the Very Large Telescope (green), and carbon monoxide emission imaged by ALMA (blue). The two spurs are outlined in orange and cyan. [Williams et al. 2023]

Sharon Meidt (Ghent University) and collaborators investigated the formation of the detailed gas and dust structures seen by JWST. The team found that the web of filamentary structures in the four galaxies follow patterns in their length, spacing, and orientation that suggest the structures formed as the result of the fragmentation and collapse of a rotating disk of gas.

A team led by Thomas Williams (University of Oxford; Max Planck Institute for Astronomy) focused on star formation in two spurs emerging from a spiral arm of NGC 628. This study showed that star formation does take place outside the galaxy’s spiral arms, within these two spurs, with similar star-formation efficiencies in each spur despite differences in the properties of the interstellar medium within them.

Pursuing Stellar Feedback

As young stars begin to form, they heat up their cold cradles and disrupt the surrounding gas with powerful winds. These processes, known as stellar feedback, impact the formation of future stars. JWST allows for precise tracing of dust and cool gas in star-forming galaxies, enabling a refined look at how stars forming today are impacted by previous generations of stars.

An annotated view of NGC 628 showing the location of its voids

Numerous bubbles populate the spiral structure of NGC 628. Click to enlarge. [Barnes et al. 2023]

Ashley Barnes (University of Bonn and European Southern Observatory) and collaborators report on numerous “bubbles” or voids of low-density gas that appear to have been blown by newly forming stars in the galaxy NGC 628. The largest bubble appears to have been created not just by young stars — though the authors expect baby stars got the bubble started — but also by supernovae pushing the walls of the bubble outward with explosive force.

Elizabeth Watkins (Heidelberg University) and coauthors analyzed NGC 628’s voids as well, amassing a catalog of 1,694 hand-selected bubbles ranging from 40 to 3,600 light-years in diameter. Analysis of the cataloged bubbles suggests that bubble mergers are common, and the presence of a bubble has important impacts on star formation down the line. In addition, elongation of bubbles along the curve of the galaxy’s spiral arms suggests that spiral arms play a defining role in star formation as well.

A team led by Jaeyeon Kim (Heidelberg University) tackled another aspect of the galaxy NGC 628: the earliest, most obscured phase of star formation. The team showed that young stars can remain embedded within their natal molecular cloud — and therefore hidden from the eyes of visible-light telescopes like Hubble — for 5 million years, which is about 20% the lifetime of a molecular cloud.

A Cluster of Star-Cluster Results

image of the galaxy NGC 1365 with known and new star clusters labeled

Hubble image of NGC 1365 showing the locations of previously known star clusters (yellow and white circles) and those newly discovered with JWST (red circles). Click to enlarge. [Whitmore et al. 2023]

A team led by Bradley Whitmore (Space Telescope Science Institute) used JWST’s infrared eyes to pierce the shroud of dense gas and dust surrounding young stars in the starburst galaxy NGC 1365. The team discovered 16 new massive star clusters, making NGC 1365 the uncontested star-cluster champ within about 100 million light-years. Given the ages of these newly discovered clusters, Whitmore and collaborators estimated that it takes a couple million years for young stars to start to peek out from beneath their natal dust blankets, finally becoming unobscured after about four million years.

Nils Hoyer (Donostia International Physics Center; Max Planck Institute for Astronomy; Heidelberg University) and collaborators tackled the nuclear star cluster at the heart of the spiral galaxy NGC 628. After determining the properties of the cluster, the team concluded that it likely hadn’t experienced much star formation over the past few billion years, though the reason for the cessation is unknown.

Infrared image of the galaxy IC 5332 showing newly discovered compact sources

Three-color image of IC 5332, a spiral galaxy 30 million light-years away, with compact sources indicated by the different symbols in the zoomed-in region. Click to enlarge. [Adapted from Hassani et al. 2023]

Jimena Rodríguez (Steward Observatory and Institute of Astrophysics of La Plata) and coauthors used a new technique to identify candidate star clusters in NGC 7496. The team picked out 67 cluster candidates, nearly all of which were invisible to Hubble in previous observations of the galaxy. These young clusters — six of them have yet to reach their millionth birthday — trace the galaxy’s well-defined spiral arms and follow previously observed patterns of dense, cold carbon monoxide gas.

Hamid Hassani (University of Alberta) scoured the 21-micron JWST data for signs of compact sources, which may indicate the presence of star clusters hidden within the dust. At such a long wavelength, even JWST isn’t capable of resolving individual star clusters, so Hassani’s team found a way to use the sources’ colors to classify them as interstellar medium sources, dusty stars, or background galaxies.

Photograph and diagram of the central regions of NGC 1365

Optical image of NGC 1365 from the Dark Energy Survey (left) and schematics illustrating the structures within the central galactic bar (right). Click to enlarge. [Schinnerer et al. 2023]

Daizhong Liu (Max Planck Institute for Extraterrestrial Physics) and coauthors studied star formation in the nucleus of NGC 1365, which hosts a starburst ring at its center. Their results illuminate the connection between star formation and the larger gas dynamics of the galactic center, showing that gas channeled by the galaxy’s central bar promotes the formation of massive star clusters.

Eva Schinnerer (Max Planck Institute for Astronomy) and collaborators also investigated the center of NGC 1365, pairing the new JWST images with archival ALMA data to probe the conditions within the galaxy’s central bar. This study revealed streams of gas within the bars, the convergence of which sets the stage for star formation.

Citation

The full list of research articles in the PHANGS–JWST First Results focus issue can be found here. Individual articles are linked to in the text above.

Distant Galaxy GN-z11 as seen in the GOODS North Survey field

One of the most distant known galaxies, GN-z11, might be unusually rich in nitrogen. Researchers suggest that supermassive stars could provide a pathway for nitrogen to be enhanced in this early galaxy.

A New Look at a Distant Galaxy

GN-z11 was once the most distant cosmic object known. This luminous galaxy was discovered with the Hubble Space Telescope in 2015, and now JWST has turned its exquisite spectrometer to the task of precisely determining the galaxy’s distance and extracting its properties.

illustration of a blazar

Artist’s impression of the jet from an active galactic nucleus directed toward Earth. [NASA/Goddard Space Flight Center Conceptual Image Lab]

A new spectrum of GN-z11 shows bright emission lines from several atoms including nitrogen. Strong emission lines in a galaxy’s spectrum can mean that the galaxy hosts an active galactic nucleus — a supermassive black hole that’s consuming superheated gas from its surroundings — but some researchers suspect that’s not the case for GN-z11. Instead, this galaxy’s strong nitrogen lines might mean that it’s unusually rich in that element, but it’s not clear where this supply of nitrogen might have come from. In a recent research article, Chris Nagele and Hideyuki Umeda of the University of Tokyo suggest that supermassive stars might be the cause.

Supermassive Stars in the Spotlight

Supermassive stars are hypothesized to contain more than a hundred times the mass of the Sun, and the most massive of them might have clocked in at more than 100,000 solar masses. If stars at the upper end of this mass range existed in the early universe, they could give rise to the seeds of supermassive black holes and explain the properties of galaxies like GN-z11.

Nagele and Umeda simulated the evolution of supermassive stars of 1,000, 10,000, 50,000, and 100,000 solar masses. Each of these enormous stars started out with an abundance of metals (elements heavier than helium) just one-tenth the Sun’s, which is representative of the conditions a few hundred million years after the Big Bang. The team’s simulations combined fluid dynamics, nuclear reactions, and general relativity to follow the stars as they evolve. The vastly different masses of the simulated stars resulted in vastly different outcomes; the 100,000-solar-mass star exploded and the 50,000-solar-mass star collapsed before the end of the hydrogen-burning phase, while the two less weighty stars evolved off the main sequence without incident.

A Matter of Timing

Plot of simulated elemental abundances relative to solar abundances

Abundances of chemical elements relative to the amount contained in the Sun. Note that the higher-mass models produce super-solar nitrogen (Z=7) and sub-solar oxygen (Z=8), while the lower-mass models produce super-solar amounts of both elements. Click to enlarge. [Nagele and Umeda 2023]

How long each star lived before exploding or collapsing determined how much it enriched its surroundings with metals, and it also determined the ratios of various metal species relative to one another. For example, the longer-lived lower-mass stars produced enhanced amounts of both nitrogen and oxygen via their powerful stellar winds. Because GN-z11 does not show signs of abundant oxygen, this means that 1,000- and 10,000-solar-mass stars are unlikely sources of the galaxy’s nitrogen.

The more massive stars, though, produced enhanced amounts of nitrogen but not oxygen, leading to a chemical abundance pattern that is consistent with what we see for GN-z11. Nagele and Umeda note that there are nuances that will need to be explored by future simulations with finer time resolution, but as of now supermassive stars remain a promising candidate source for GN-z11’s nitrogen. And as for the origins of the stars themselves, the authors pointed out that one way supermassive stars could form is through the collision of massive galaxies — and new observations show a “haze” around GN-z11 that might be a sign of such a collision.

Citation

“Multiple Channels for Nitrogen Pollution by Metal-enriched Supermassive Stars and Implications for GN-z11,” Chris Nagele and Hideyuki Umeda 2023 ApJL 949 L16. doi:10.3847/2041-8213/acd550

1 34 35 36 37 38 122