Features RSS

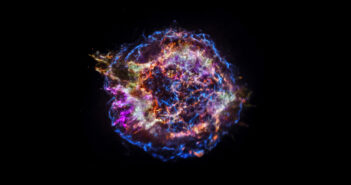
X-ray image of supernova remnant Cassiopeia A

Astronomers can get a better view of more distant supernova explosions by searching for high-energy neutrinos, according to a study conducted by researchers at Uppsala University in Sweden.

Detecting Ghostly Particles from Collapsing Stars

A photograph of the IceCube Neutrino Observatory

The IceCube Laboratory at the Amundsen-Scott South Pole Station in Antarctica. [Felipe Pedreros, IceCube/NSF]

A core-collapse supernova represents the cataclysmic end of a massive star’s life. As the star collapses, its iron core disintegrates, producing vast numbers of sub-atomic particles called neutrinos that stream outwards in unimaginable quantities — somewhere around 10 billion trillion trillion trillion trillion of them. Their outwards pressure blasts the star apart and detonates the supernova.

There are various neutrino detectors scattered across the planet, including IceCube in Antarctica. It can detect the neutrinos produced by core-collapse supernovae, which typically have energies in the mega-electronvolt range. However, the way its detectors work means that supernova neutrinos from farther away than the Magellanic Clouds — the largest satellite galaxies of the Milky Way — are too faint for it to see.

Circumstellar Collisions and Choked Jets

Nora Valtonen-Mattila and Erin O’Sullivan (both Uppsala University) think that there may be higher-energy neutrinos on offer, which would extend that range to more than a hundred million light-years. That would include supernovae in many other galaxies and local galaxy clusters.

These neutrinos — in the giga- to tera-electronvolt range — aren’t produced by the supernova itself, though. Instead Valtonen-Mattila and O’Sullivan consider two alternative production mechanisms.

Before stars go supernova they tend to eject vast amounts of material in fierce stellar winds. When the supernova detonates, the debris from the explosion hits this circumstellar material. Protons collide like they do in particle accelerators here on Earth and should produce high-energy neutrinos in the process. However, these neutrinos have yet to be observed.

A similar thing could be achieved through a jet of material that becomes trapped behind the star’s outer shell. This is called a choked jet. Ordinary particles may be trapped, but neutrinos are famously ghost-like and can stream through dense material with ease. In fact, a light-year of lead would only have fifty-fifty chance of stopping a neutrino.

Plot showing the predicted number of detectable neutrinos as a function of supernova distance

The predicted number of observable neutrinos in the northern sky based on the choked-jet model (top) for two detection methods. The bottom panel shows the cumulative number of supernovae observed by the Zwicky Transient Facility each year. [Adapted from Valtonen-Mattila and O’Sullivan 2023]

Expanding Our Horizons

It’s these high-energy neutrinos from choked jets that offer the greatest possible extension to IceCube’s range, pushing it out to 277 million light-years in the northern sky and 65 million light-years in the southern sky. However, choked jets are rare, with just 1–4% of core-collapse supernovae thought to have one.

These are important considerations, particularly in light of the ongoing upgrade to IceCube-Gen2, which should be completed by 2033. Perhaps then we’ll have a clearer picture of core-collapse supernovae and the neutrinos they produce.

Citation

“Prospects for Extending the Core-collapse Supernova Detection Horizon Using High-Energy Neutrinos,” Nora Valtonen-Mattila and Erin O’Sullivan 2023 ApJ 945 98. doi:10.3847/1538-4357/acb33f

a photograph of a supernova on the outskirts of a dusty galaxy

JWST observations of abundant galaxies in the early universe have the potential to upend our theories of when the first galaxies formed. New research suggests that some of these candidate galaxies are actually individual supernovae, slightly easing — but not eliminating — the tension between theory and reality.

Eyeing Early Galaxies

JWST image of the galaxy cluster SMACS

JWST image of the galaxy cluster SMACS J0723.3-7327. [NASA, ESA, CSA, STScI]

Understanding how and when galaxies formed in the early days of the universe is a central goal of astronomy, and the exceptional observations from JWST should help us advance toward that goal. As early data from JWST rolled in, researchers compiled lists of objects that appeared to be distant galaxies. As the lists grew, though, our theories of how quickly galaxies assembled after the Big Bang began to bend under the strain — JWST found more (and more massive) galaxies in the early universe than we expected.

Now, researchers are taking a closer look at these purported “high-redshift” galaxies, testing whether some of them are actually less-distant galaxies reddened with dust or even single objects in our own galaxy, like brown dwarfs. In a recent research article, a collaboration led by Haojing Yan (University of Missouri) has proposed a new type of object that might be contaminating our high-redshift galaxy samples: extragalactic supernovae.

Examples of four point-like galaxy candidates as seen in six JWST filters

Examples of four point-like galaxy candidates as seen in six JWST filters. The wavelength range of the observations increases from left to right. Click to enlarge. [Adapted from Yan et al. 2023]

Galactic or Stellar?

Yan and collaborators hunted for high-redshift galaxies in the first JWST image ever released, an expansive scene showing the galaxy cluster SMACS J0723.3-7327 (SMACS J0723 for short). Yan’s team collected a sample of nearly 90 candidate high-redshift galaxies with potential redshifts ranging from 12.7 to 24.7, which corresponds to roughly 340 to 130 million years after the Big Bang. Upon inspection, 10 of these sources appeared point-like, more like stars than galaxies.

The team suggested that these point-like “galaxies” might instead be extragalactic supernovae. To test this theory, they attempted to fit the photometric JWST observations with models of Type Ia (thermonuclear runaway) and Type II (core-collapse) supernovae.

Still in Disagreement

Two plots showing model fits to JWST data of a high-redshift galaxy candidate

An example of the model fitting. This source, F200DB-086, is well fit by both a Type Ia supernova (top) and a Type IIP supernova (bottom) model. Click to enlarge. [Adapted from Yan et al. 2023]

Most of the sources were well fit by either or both supernova models, with potential redshifts between 1 and 15. These results mean that the point sources could be supernovae, but it doesn’t mean that they are. Yan and coauthors noted that none of the sources are associated with a background galaxy, though that wouldn’t be unexpected if the supernovae occurred in faint dwarf galaxies. And while predictions based on star-formation rates suggest that only five such supernovae would be expected in the SMACS J0723 field, the observed number fits within the large uncertainties.

Ultimately, as is often the case, more data are needed to inspect these mysterious sources further. The team suggested that revisiting the SMACS J0723 field should clarify the situation, confirming that the objects are supernovae by watching them fade over time. And as for our understanding of galaxy growth in the early universe, the solution is still unclear — removing a handful of supernova sources still leaves more galaxies than our theories can handle.

Citation

“Pointlike Sources among z > 11 Galaxy Candidates: Contaminants due to Supernovae at High Redshifts?,” Haojing Yan et al 2023 ApJL 947 L1. doi:10.3847/2041-8213/acc93f

An image taken from orbit around the moon of Shackleton crater. The image is taken from an oblique angle such that only the very edge of the crater is visible; the surrounding landscape and crater interior are in shadow and too dark to resolve.

Three and a half billion years ago, a mile-wide rock haphazardly slammed into the south pole of the Moon. About three years from today, a human-made ship carrying the Artemis III crew will land much more gingerly in the same spot and survey the damage. To make the most of their limited time there, scientists are mapping out where they should go and what they might see.

Back to the Moon

While most exploration within astronomy centers on observing places beyond the physical reaches of humanity, there’s an undeniable romanticism behind our vision to visit our nearest neighbors in person. In the last 50 years, though, we’ve been collectively reclusive; although our robotic emissaries have been busy, no human has left the confines of Earth’s gravitational dominance since before the first personal computers hit shelves.

That’s likely about to change soon, however. While the political winds that govern such endeavors could shift, the previous two presidential administrations have stood by the Artemis program, which aims to send astronauts around the Moon in 2023, and to land on the lunar south pole in late 2025 the earliest. 

A geologic map of the area surrounding the likely Artemis III landing site. Individual boulders, rocky craters, and rock exposures mapped in this study are included as dots. Click for high-resolution version. [Adapted from Boazman et al. 2023 and Bernhardt et al. 2022]

Remote Cartography

These future moonwalkers will need a careful plan to maximize the scientific return of their precious few days on the surface. Recently, a team led by Sarah Boazman (European Space Research and Technology Centre) used data from the Lunar Reconnaissance Orbiter to get started on this necessary preparation. Published in the Planetary Science Journal, Boazman and collaborators created a new map of potential geologic sampling sites near the likely Artemis III landing site. Their survey specifically flags isolated boulders, rocky craters, and rock exposures that could be reached by astronauts on foot, adding context to previous geologic maps of the polar regions.

After a thorough analysis (they team flagged over 86,000 individual boulders alone), Boazman and collaborators conclude that many of the boulders near the probable Artemis III landing site are associated with the impact that formed Shackleton crater, the 21-kilometer depression that hosts several permanently shadowed regions packed with ices.

Map of boulders in the region studied

Isolated boulders flagged in the study, overlaid on a lower-resolution image of the same region. [Adapted from Boazman et al. 2023]

They also find several positions within the landing zone that would make ideal touchdown spots: flat, safe ground that would put the astronauts within walking distance of the maximum number of geologic targets. Although they were limited by the resolution of the spacecraft’s camera and the awkward viewing geometries, the team points out that “all errors in our mapping can be reduced with ground-truthing efforts by future surface missions.”

Although the Artemis III crew will be the only humans physically on the Moon once they land, they’ll carry with them the curiosity of thousands of planetary scientists back here on Earth. It is a thrilling time when astronomers can make maps of other worlds in preparation for a journey there, and hopefully the wait won’t be long for an astronaut to size up one of the targets on this map in person.

Citation

“The Distribution and Accessibility of Geologic Targets near the Lunar South Pole and Candidate Artemis Landing Sites,” Sarah. J. Boazman et al 2023 Planet Sci. J. 3 275. doi:10.3847/PSJ/aca590

artist's impression of a white dwarf accreting material from a companion star

Extremely compact stellar remnants made of a mixture of normal matter and dark matter could explain a variety of puzzling observations, but it’s not clear exactly how these objects might form. Now, researchers have modeled a potential formation pathway and proposed a way to track them down.

Where Dark Matter and Normal Matter Meet

infographic describing the gravitational wave event GW190814

An infographic describing the gravitational wave event GW190814, which contained a 2.50–2.67-solar-mass object of unknown type. Click to enlarge. [LIGO Scientific Collaboration]

In some parts of the universe, where dark matter is especially dense, normal matter and dark matter might intermingle and swirl together to form stars. If these dark-matter-containing stars evolve into neutron stars — extremely dense stellar remnants about the size of a city — such an object might explain the too-heavy neutron star thought to have participated in the gravitational wave event GW190814, among other curious observations.

A team led by Ho-Sang Chan (The Chinese University of Hong Kong) has proposed that neutron stars containing a small amount of dark matter might form through a circuitous route. First, a low- to intermediate-mass star composed of normal and dark matter evolves to become a white dwarf: an Earth-sized sphere containing roughly the mass of the Sun. If this white dwarf has a giant stellar companion, it can steal some of the companion’s gas and become so massive that it collapses under its own gravity. Usually, this would lead to a supernova explosion, but under certain conditions, the white dwarf might shrink down to become a neutron star instead.

Chan and collaborators suggest that observing these events, called accretion-induced collapse, might yield a way to study the properties of these unusual neutron stars and of dark matter itself.

Conceptualizing Collapse

While the visible-light signature of a white dwarf collapsing to form a neutron star would be faint, Chan and collaborators have suggested that we might be able to track them down via their gravitational wave emission. The team used two-dimensional fluid dynamics simulations to study how a dark-matter-containing white dwarf would collapse into a neutron star and estimated the gravitational waves that would be emitted in the collapse.

The team set the mass of their dark matter particles to a little more than a tenth of the mass of a proton, and they considered white dwarfs containing 1–20% dark matter by mass. Additionally, they considered different rotation profiles for the stars: rigid rotation (like a spinning top) and Keplerian rotation (like planets in the solar system, the velocity is highest near the center and lowest farther out).

Observational Prospects

Gravitational wave strain for different percentages of dark matter

Normalized gravitational wave strain (related to the wave amplitude) from the collapse of Kepler-rotating white dwarfs containing, from top to bottom, 0%, 1%, 5%, 10%, and 20% dark matter by mass. [Chan et al. 2023]

Chan and collaborators found that the rotation of the star is key to determining the shape of the gravitational wave profile. For rigid rotators, there was essentially no difference between the gravitational waves emitted by stars containing dark matter and those made of solely normal matter. For Keplerian rotators, though, the presence of dark matter softens some peaks in the gravitational wave signal, and these differences are likely detectable with current gravitational wave facilities.

Hopefully, future gravitational wave observations will yield new information about these theorized neutron stars, potentially illuminating the nature of dark matter.

Citation

“Accretion-induced Collapse of Dark Matter-admixed Rotating White Dwarfs: Dynamics and Gravitational-wave Signals,” Ho-Sang Chan et al 2023 ApJ 945 133. doi:10.3847/1538-4357/acbc1d

Researchers have detected hot molecular cloud cores in the Small Magellanic Cloud for the first time. This discovery enhances our understanding of star formation in the nearby universe and will guide future explorations of extragalactic star-forming regions.

From Cold Cloud to Hot Core

an infrared image of the Small Magellanic Cloud

A view of the Small Magellanic Cloud from the European Southern Observatory’s Visible and Infrared Survey Telescope for Astronomy. [ESO/VISTA VMC; CC BY 4.0]

New stars form in massive clouds of molecular hydrogen gas. As the cloud swirls, gas collects in cold, dense clumps, creating the conditions for star formation. When a massive star begins to form in one of these clumps, the gas heats up, creating a hot molecular cloud core. Researchers have previously detected hot molecular cloud cores in the Milky Way and in several nearby galaxies, but they have remained elusive in one of our nearest neighbors: the Small Magellanic Cloud.

The Small Magellanic Cloud is an interesting place to search for hot cores because this small, irregularly shaped galaxy is poor in metals — elements heavier than helium — compared to galaxies like the Milky Way. If we find hot cores in such a metal-poor galaxy, we can study how the formation of massive stars varies between metal-rich and metal-poor galaxies in the universe today. This can also help us understand star formation billions of years ago, when the universe was substantially less metal rich than it is now.

locations of the core candidates within the Small Magellanic Cloud

Locations of the two protostars/hot core candidates, S07 and S09, within the Small Magellanic Cloud. The observations were made at infrared wavelengths. [Shimonishi et al. 2023]

Core Candidates

Takashi Shimonishi (Niigata University) and collaborators began their search for hot cores with two sources in the Small Magellanic Cloud that had been flagged as high-mass protostars. Previous observations found that these two soon-to-be stars are swathed in clouds containing dust and ice, which suggests that the protostars might be embedded within dense gas.

The team combined new and archival data from the Atacama Large Millimeter/submillimeter Array (ALMA) to determine the properties of the gas surrounding the two sources. They detected spectral lines from numerous molecules and molecular ions, including carbon monoxide, methanol, and sulfur dioxide. The data suggested that the gas surrounding the protostars is dense, hot (here, “hot” means warmer than 100K), and concentrated in a small region around each protostar — exactly the characteristics of a hot core!

Testing Molecular Tracers

Finding hot cores in the metal-poor Small Magellanic Cloud suggests that hot core formation is an expected part of massive star formation for galaxies with a wide range of metal abundances. Specifically, Shimonishi and collaborators have shown that hot cores can form in galaxies in which metals are 80% less abundant relative to hydrogen than they are in the gas from which the Sun formed.

comparison of sulfur dioxide and methanol emission for one of the hot cores

Comparison of the sulfur dioxide (SO2) and methanol (CH3OH) emission for the hot core S07. The source region of the sulfur dioxide emission is more compact and warmer. Click to enlarge. [Adapted from Shimonishi et al. 2023]

Interestingly, the team found key differences between the Small Magellanic Cloud hot cores and those in other galaxies. Generally, researchers use methanol emission to find hot cores, but the methanol emission from the newly found cores was extended and cool — not what we’d expect for a hot core. Instead, it was sulfur dioxide emission that traced the cores effectively. Why might methanol be a poor core tracer in the Small Magellanic Cloud when it’s so effective in other environments? This might point to differences in how methanol and sulfur dioxide form in metal-poor hot cores, making sulfur dioxide a better indicator of hot cores in these regions.

Citation

“The Detection of Hot Molecular Cores in the Small Magellanic Cloud,” Takashi Shimonishi et al 2023 ApJL 946 L41. doi:10.3847/2041-8213/acc031

a photograph of a total solar eclipse with the solar corona showing

A recent research article describes a new way to measure the magnetic field of the Sun’s tenuous upper atmosphere, or corona, from images taken during total solar eclipses.

Illuminating the Solar Corona

An illustration of the regions of the Sun's atmosphere and interior.

An illustration of the regions of the Sun’s atmosphere and interior. Click to enlarge. [NASA/Goddard]

The outermost layer of the Sun’s atmosphere is normally hidden from view, but a total solar eclipse reveals ghostly tendrils flowing out from the Sun: the corona. The solar corona is exceptionally hot, sparse, and dynamic, and it’s the source of a variety of exciting space weather phenomena. It’s this last point that makes understanding the properties of the corona important, especially the strength and direction of its magnetic field.

Because direct measurements of the coronal magnetic field are hard to come by — the only spacecraft yet designed to travel into the harsh coronal environment, the Parker Solar Probe, has barely dipped a toe into the region — researchers must use complex models to reproduce measurements made from a distance to understand this important region of the Sun.

comparison of output from the two methods

A projection of the magnetic field strength derived using the total solar eclipse (TSE) method and the magnetohydrodynamic (MHD) modeling method. Click to enlarge. [Bemporad 2023]

A Simpler Solution?

Alessandro Bemporad (National Institute for Astrophysics, Italy; Purple Mountain Observatory) explored a simpler way. Bemporad’s analysis method starts with polarized-light images of the corona from the 21 August 2017 total solar eclipse. The author first used an established technique to calibrate the images and convert the brightness of each pixel to an important physical quantity: how densely packed or rarefied the plasma is within the corona.

To convert from plasma density to magnetic field strength, Bemporad made a bit of a leap. In many physical systems, energy is distributed fairly equally among different types — like thermal, kinetic, magnetic, or potential energy. For a system like the solar corona, the dominant forms of energy are magnetic and gravitational potential. By making the assumption that these forms of energy are balanced, Bemporad estimated the magnetic field strength without needing complex modeling.

Looking Forward, Looking Back

comparison of output from the new method and the more complex fluid dynamics modeling

Left: Relative difference between the magnetic field strength derived using the total solar eclipse method and the fluid modeling. Right: Cumulative distribution of relative differences between pixel values. Click to enlarge. [Bemporad 2023]

To test the validity of the new method, Bemporad compared his results against those from fluid dynamics models. In general, the output from the two methods differed by less than 50%. Given that the results from the more complicated fluid models aren’t ground truth, Bemporad considers these discrepancies small.

Bemporad notes that the new method can be applied to any white-light images of the solar corona, not just those taken during total solar eclipses. This means that any ground- or space-based images made using a coronagraph (an instrument that blocks the light from the Sun’s bright disk so that the fainter corona can be photographed) are ripe for further exploration, including images taken decades ago — opening a new window into the magnetic conditions of past solar cycles.

Citation

“Coronal Magnetic Fields Derived with Images Acquired during the 2017 August 21 Total Solar Eclipse,” A. Bemporad 2023 ApJ 946 14. doi:10.3847/1538-4357/acb8b8

A rendering of large star on the left, and a very nearby gaseous planet on the right.

JWST’s data are revolutionary, and exoplanet astronomers are learning to squeeze it for all it’s worth. Danger lies at the bleeding edges, though, and a recent study highlights how subtle assumptions can strongly influence final conclusions about a planet’s atmosphere.

Sniffing an atmosphere

As unprecedented as JWST data are, it is crucial to remember that after sniffing an exoplanet’s atmosphere, the telescope does not beam back a full inventory of the molecules it found. Instead, it sends back raw data from its distant perch at L2 that must be interpreted and analyzed by astronomers on the ground before any conclusions are drawn. Behind every discovery claim of a certain molecule in an exoplanet atmosphere is a laborious two-step process: “reduction” and “retrieval.”

A corner plot illustrating the results of an atmosphere retrieval, here computing different abundances and atmospheric profiles fit to a combination of the Tiberius output and Hubble data. [Constantinou et al. 2023]

The first of these, reduction, refers to the process of extracting the signal of interest from the raw data. For most exoplanet studies this means the transmission spectrum of the planet’s atmosphere, which is unfortunately convolved with other nuisance signals originating from quirks of the detector. To automate this extraction and cleaning, astronomers write software “pipelines” that turn the raw data downlinks into a clean final spectrum. Different pipelines often produce similar but slightly different outputs depending on the design choices underpinning each.

Once raw data are pushed through a pipeline and the spectrum is extracted, astronomers move on to the second step: retrieval. Here, the goal is to explain the spectrum by using complex models that simulate a planet’s atmosphere to match what was observed.

Products Depend on Pipelines

Two reduction pipelines popular in the JWST literature are named Tiberius and Eureka. When fed the exact same raw data, they return spectra that look qualitatively similar but differ slightly at each wavelength. Recently, a collaboration led by Savvas Constantinou (University of Cambridge) decided to investigate the implications of these subtle differences: they passed each pipeline an identical copy of observations of the “hot Saturn” exoplanet named WASP-39 b, then ran retrievals on each output spectrum to check how the final atmospheric profiles depended on the choice of pipeline.

Differences in retrieved parameters when using Tiberius and Eureka. Appending Hubble data to each lessened but did not fully resolve the discrepancies between them. [Constantinou et al. 2023]

They found that while the analyses agreed on the largest signals (both successfully recovered the much-lauded detections of CO2 and SO2), they differed in statistically meaningful ways when estimating more subtle parameters. For example, the inferred mixing ratio of most species differed by more than 1σ, and in some cases, one pipeline led to a molecule detection while the other concluded it wasn’t present. Although adding in older data from the Hubble Space Telescope helped reconcile the two somewhat, some serious differences remained even then.

The authors concluded that while there is no cause for concern when it comes to interpreting the most obvious whopping signals like the >15σ CO2 absorption, astronomers are going to need to take care when interpreting weaker signals. With many more JWST transit observations to come, the community will have to double check that they don’t miss any molecules, and that they ones they claim float in exo-airs are really there and aren’t just figments of our reductions.

Citation

“Early Insights for Atmospheric Retrievals of Exoplanets Using JWST Transit Spectroscopy,” Savvas Constantinou et al 2023 ApJL 943 L10. doi:10.3847/2041-8213/acaead

An X-ray image of GRB 221009A's emission scattering off of dust

Gamma-ray bursts are the most luminous explosions in the universe, and we’ve learned much about these superlative outbursts since their discovery in 1967. A new Focus Issue of the Astrophysical Journal Letters released yesterday showcases results related to the gamma-ray burst GRB 221009A: the brightest of all time. Today’s post briefly introduces the Focus Issue articles that have already been published or are in press — be sure to check out the full articles linked below, and keep an eye out for future articles in this issue!

A Superlative Burst

an image of the GRB 221009A afterglow in a field of stars

An infrared image of the afterglow of GRB 221009A (circled), taken 1–2 months after the onset of the burst. The burst’s host galaxy is the faint, extended source behind the burst. Click to enlarge. [NASA, ESA, CSA, STScI, A. Levan (Radboud University); Image Processing: Gladys Kober]

Gamma-ray bursts are brief flashes of high-energy emission, lasting anywhere from a fraction of a second to several hours. The shortest gamma-ray bursts likely mark the collision of two compact stellar remnants called neutron stars, and the longest bursts are thought to arise when a massive, rapidly spinning star collapses to form a black hole. After the initial burst of gamma-rays, dubbed the “prompt” emission, a sustained afterglow shines for days or weeks at radio to X-ray wavelengths.

On 9 October 2022, a remarkable new gamma-ray burst named GRB 221009A was picked up by 25 satellites, most of which weren’t designed to detect gamma-ray bursts — like Voyager 1 and a pair of Mars orbiters. The burst even made an impact on Earth’s atmosphere, creating a disturbance as large as a solar flare would. To put that into context, this means that an explosion roughly 2 billion light-years away had as large an effect on our atmosphere as a solar flare more than 100 trillion times closer!

GRB 221009A Across the Electromagnetic Spectrum

An article led by Maia Williams (Pennsylvania State University) describes the initial discovery and the properties of this extremely bright, long-lived burst. GRB 221009A’s X-ray afterglow is more than an order of magnitude brighter than other gamma-ray bursts observed by the Swift Observatory, and analysis of its emission suggests that the jet it produced is extremely narrow. However, the authors found that GRB 221009A’s afterglow emission isn’t fit well by some of our standard models for how the emission is produced — namely, a jet of energetic particles interacting with material surrounding the object — suggesting that further work is needed to understand the event.

Plot of the gamma-ray burst's flux density as a function of frequency for multiple time periods

Radio, optical, and X-ray observations of GRB 221009A at different times, with the observation day indicated by the symbol color. The solid lines indicate the results of a shock emission model. The model fails to capture the observed radio flux. Click to enlarge. [Laskar et al. 2023]

After its initial discovery at high energies, astronomers monitored GRB 221009A at wavelengths across the electromagnetic spectrum, aiming to understand the nature of the event and pin down its unusual properties. Tanmoy Laskar (University of Utah) and collaborators inspected GRB 221009A’s behavior from radio to gamma rays, finding evidence for a shock forming where the gamma-ray burst’s jet collides with surrounding material. The team noted that the radio emission should linger for years more, providing further opportunities to study this event.

In addition to space-based gamma-ray telescopes, researchers used a ground-based gamma-ray observatory to study the event. Luckily for life on Earth, most gamma rays fail to reach our planet’s surface, but we can detect the faint light emitted when gamma rays interact with particles in the atmosphere. Researchers used the High Energy Stereoscopic System (HESS) — a set of five telescopes located in Namibia — to search for emission linked to GRB 221009A, but found none. Despite this, the upper limits derived from the observations allowed the HESS team to constrain the possible emission mechanism for the burst.

David Kann (Goethe University Frankfurt) and collaborators presented optical and X-ray data spanning from the prompt phase of the burst out to 60 days post-burst. The team used these observations to study the dust along the path between the burst and Earth, finding that the burst’s host galaxy is probably moderately dusty. Modeling of the burst’s jet presented some curiosities: the simplest jet model failed to reproduce the observations, and adding structure and other features to the jet didn’t improve the fit.

Supernova or No?

In addition to the prompt and afterglow emission, gamma-ray bursts are often accompanied by a supernova, powered by nuclear reactions within the material expelled as the star collapses. As the emission from the burst fades, emission from the supernova brightens, eventually peeking out from beneath the fading afterglow as a bump in the light curve days or weeks after the onset of the burst. One of the many intriguing features of GRB 221009A’s evolution is that it might not show any supernova emission.

Optical and near-infrared light curves for GRB 221009A

Optical and near-infrared light curves for GRB 221009A. [Shrestha et al. 2023]

Manisha Shrestha (University of Arizona) and collaborators examined GRB 221009A’s light curves and spectra for signs of a supernova, but didn’t find a convincing supernova signal in either. The team’s modeling suggested that a supernova could be hidden beneath the bright afterglow, though, depending on how much the host galaxy’s dust stifles the light from the supernova. Michael Fulton (Queen’s University Belfast) and coauthors monitored the burst at optical wavelengths as it faded over the course of nearly two months, finding a potential but inconclusive supernova bump around 20 days after the burst.

Andrew Levan (Radboud University) and collaborators turned two exceptional telescopes toward the burst — JWST and the Hubble Space Telescope — and obtained the first mid-infrared spectrum ever taken of a gamma-ray burst. These observations suggest that if there is a supernova accompanying the burst, it’s faint or its spectrum peaks at wavelengths bluer than those covered by JWST and Hubble. Future work will help to disentangle the emission from the gamma-ray burst afterglow, the possible accompanying supernova, and the gamma-ray burst host galaxy that is visible in the Hubble images. If this burst occurred sans supernova, it might mean that the newly formed black hole swallowed the debris of the exploded star, or it could mean — though the team deems this unlikely — that GRB 221009A was instead caused by the merger of neutron stars.

Polarization, Particles, and Dusty Pathways

A team led by Michela Negro (University of Maryland, Baltimore County) observed the burst with the Imaging X-ray Polarimetry Explorer, obtaining the first measurement of polarized X-rays from a gamma-ray burst afterglow. The observations revealed a bright central core of emission surrounded by rings created by photons scattering off of dust grains. In other words, the team was able to study the prompt emission (in echo form) and the afterglow simultaneously! The team placed an upper limit on the polarization fraction of 13.8% for the afterglow emission and somewhere between 55% and 82% for the prompt emission.

plot of the electron flux during the gamma-ray burst

Electron flux measured by one of the three detectors making up the High-Energy Particle Package (black) and the scaled photon count from the High Energy Burst Searcher (blue). Click to enlarge. [Battison et al. 2023]

High-energy radiation from a gamma-ray burst can produce a significant increase in the ionization of Earth’s upper atmosphere. Some of these newly formed ions can be detected by spacecraft, yielding another way to study gamma-ray bursts as they happen. Robert Battison (University of Trento) and collaborators presented data from the High-Energy Particle Package on the China Seismo-Electromagnetic Satellite, which shows a sudden increase in the flux of charged particles at the time of the gamma-ray burst.

The IceCube Collaboration also searched for particles associated with the burst, but neutrinos — chargeless, nearly massless particles produced in a variety of high-energy astronomical phenomena — proved elusive. The link between neutrinos and gamma-ray bursts is theorized but yet to be proven, and the team detected no neutrinos from the event. Planned upgrades to the IceCube Neutrino Observatory might allow us to detect neutrinos, if present, from future gamma-ray bursts.

Images of the expanding rings

Images of the expanding rings at 0.7–4 kiloelectronvolts. Click to enlarge. [Tiengo et al. 2023]

To reach us on Earth, emission from GRB 221009A had to carve a path through the Milky Way. As the narrow beam of emission pierced our galaxy, it illuminated dust clouds along its path like the beam of a flashlight. Because of this, researchers observed shifting rings of X-ray emission for weeks after the event, showing where X-rays had scattered off of dust clouds within the Milky Way. Andrea Tiengo (IUSS – School for Advanced Studies and National Institute of Astrophysics, Italy) and collaborators reported the detection of 20 such rings, corresponding to echoes off dust clouds located 1,000–61,000 light-years from Earth.

Brightest of All Time… So Far

Since its discovery, GRB 221009A has been referred to as the BOAT — the Brightest Of All Time. In the final Focus Issue article published yesterday, Eric Burns (Louisiana State University) and collaborators explored whether that moniker is truly deserved. By comparing against decades of gamma-ray burst observations, the team found that GRB 221009A indeed had by far the highest peak flux of any gamma-ray burst measured to date, and it topped the list for two out of the remaining three measures of brightness. Looking more closely at the properties of events observed over the past 50 years, the team estimated that GRB 221009A is a once-in-ten-millennia event. So while GRB 221009A is certainly not the brightest gamma-ray burst in the history and future of the universe, it’s probably the brightest burst in the history of human civilization — and its rarity means we’re lucky it happened while we have working gamma-ray telescopes!

Over the past few months, GRB 221009A has been hidden from view, blocked by the Sun’s disk. Soon, though, its reemergence will give researchers the chance to study it further and hopefully solve some of the lingering mysteries about its evolution.

Bonus

In addition to the Focus Issue articles published yesterday and those still to come, you can watch a recording of the GRB 221009A press conference presented yesterday at the 20th meeting of the High Energy Astrophysics Division.

Citation

Articles belonging to the Focus Issue will be collected here: Focus on the Ultra-luminous GRB 221009A

Hubble image of a star cluster surrounded by some wispy gas clouds

Researchers have explored the best places to search for ultra-high-energy cosmic rays: charged particles that can travel at nearly the speed of light. New cosmic ray “treasure maps” bring us one step closer to tracking down the origins of these rare particles.

Cosmic Particle Accelerators

diagram of the particle shower created when a cosmic ray enters Earth's atmosphere

A diagram illustrating the shower of particles created when a cosmic ray enters Earth’s atmosphere. Click to enlarge. [CERN]

Across the universe, cosmic rays are accelerated to extraordinary velocities. These speedy particles are mostly protons or the nuclei of helium atoms, with electrons and the nuclei of atoms heavier than helium rounding out the population. When these particles reach Earth, they can make quite a splash — the highest-energy cosmic ray ever detected had an energy of 320 exaelectronvolts (that’s 3.2×10²⁰ electronvolts!) and earned the moniker the “Oh-My-God particle.”

Where in the universe cosmic rays reach their extreme speeds is still up for debate, though supernovae, accreting supermassive black holes, highly magnetized stellar remnants called magnetars, and gamma-ray bursts are all possible sites of cosmic-ray acceleration. Complicating the hunt for these sites is the fact that after cosmic rays are shot into space, they’re buffeted and misdirected by a tangled web of magnetic fields. As a result, where we see a cosmic ray come from might not be where it actually came from.

plot showing simulation results for the detectability of iron nuclei and nitrogen nuclei for sources of varying distance.

The loss-of-number density, aGZK, as a function of the distance of the cosmic-ray source, shown for nitrogen nuclei (dot-dashed green line) and iron nuclei (dashed orange line) with energies greater than 150 exaelectronvolts. The source distance at which 95% of particles fail to reach Earth is marked for each species with an arrow. In this simulation, the detector is sensitive to particles with masses greater than 12 atomic mass units. [Adapted from Globus et al. 2023]

Looking for Paired Particles

In a recent research article, a team led by Noémie Globus (University of California, Santa Cruz, and the Institute of Physical and Chemical Research, Japan) suggested that we may be able to identify the sites of cosmic-ray acceleration by detecting two cosmic rays from the same source arriving from the same direction at the same time. Magnetic fields between the cosmic-ray source and Earth make this kind of coordination unlikely. Globus and collaborators proposed that these paired particles might arrive more often from some parts of the sky than others.

The team focused on cosmic rays with energies in excess of 150 exaelectronvolts, about two of which are caught by our cosmic ray detectors each year. In addition to considering how magnetic fields affect the passage of these particles, the team also considered which cosmic rays are most likely to survive the journey to Earth. As cosmic rays zip through space, they interact with photons from the cosmic microwave background that suffuses the universe. This interaction strips protons and neutrons away from the cosmic ray, reducing its mass and energy. This means that the distance a cosmic ray can travel before being disassembled — and therefore, the distance of the cosmic-ray sources we can detect — depends on its initial mass and energy.

Treasure Maps for Rare Cosmic Rays

An example treasure map for a nitrogen nucleus with an energy of 150 exaelectronvolts. The projection is centered on the galactic anticenter (GA), while the galactic center (GC) appears at the right and left sides. [Adapted from Globus et al. 2023]

By modeling how cosmic rays of different masses, energies, and source locations navigate the magnetic fields within the Milky Way and beyond it, Globus and coauthors determined the likeliest places on the sky to search for paired cosmic rays. These “treasure maps” show that the detection probability depends on the location of the cosmic-ray observatory, the location on the sky, and the mass of the cosmic-ray particle.

In addition to suggesting where to look, the team notes that their work can be used to guide how to look. Because a cosmic ray’s mass determines how far it can travel before being destroyed, building detectors that can measure the mass of cosmic rays reaching Earth can help us pinpoint where the particles originated.

Citation

“Treasure Maps for Detections of Extreme Energy Cosmic Rays,” Noémie Globus et al 2023 ApJ 945 12. doi:10.3847/1538-4357/acaf5f

artist's impression of a magnetar

Astronomers have observed polarised X-rays emitted by a magnetar, opening the door to understanding these extreme objects in more detail.

Magnetic Remnants

an illustration of a neutron star placed next to a map of New York to show the object's size

A magnetar is a sub-type of a stellar remnant called a neutron star. Magnetars and neutron stars are made solely of neutrons, and they are about 10–15 miles across. This illustration places a neutron star next to Manhattan for comparison. [NASA/Goddard Space Flight Center]

A magnetar is the remnant of the death a medium-sized star. It is a type of rapidly spinning neutron star with a typical rotation period of between one and twelve seconds. However, its magnetic field is one thousand times stronger than an ordinary neutron star. In fact, if you were to replace the Moon with a magnetar it would wipe the credit card details of everyone on Earth.

Their strong magnetic fields make magnetars prone to dramatic outbursts, emitting radiation across the electromagnetic spectrum. A magnetar’s X-ray bursts are particularly spectacular, with their X-ray flux suddenly leaping by a factor of up to a thousand.

artist's rendition of the Imaging X-ray Polarimetry Explorer (IXPE) spacecraft with Earth in the background

An artist’s impression of the Imaging X-ray Polarimetry Explorer (IXPE) spacecraft. [NASA]

Focusing on Flares

It hasn’t always been clear, however, where these flares are coming from. They could spring from the crust of the magnetar itself, or they could launch from material trapped in an atmosphere around it. A team led by Silvia Zane (University College London) recently went looking for answers using the Imaging X-ray Polarimetry Explorer (IXPE). Launched at the end of 2021, it is a joint mission between NASA and the Italian Space Agency.

As its name suggests, IXPE observes the polarisation of X-rays. Light is polarised if its waves all vibrate in the same plane. Zane’s team used IXPE to observe the polarisation of the magnetar known as 1RXS J170849.0-40091 to see if they could work out what was corralling the X-rays.

Belts, Caps, and More

plot of the polarization percentage and polarization angle of the source in different energy bands

Polarisation of the magnetar in different energy bands. The colors of the circles represent different detector units (DUs), and the orange stars and green crosses show the predictions for the “belt plus cap” and “cap plus cap” models, respectively. [Adapted from Zane et al. 2023]

They found that about 20% of the low-energy X-rays produced by 1RXS J170849.0-40091 are polarised, but this rises to around 80% for higher-energy X-rays.

The team ran simulations of various magnetar configurations to see if they could explain this result, settling on two possibilities. The first, which they call “belt plus cap,” has a warm region around the magnetar’s equator and a hotter atmosphere confined to a circular polar cap. The second, called “cap plus cap,” has the X-ray emission emanating from two circular spots. One is on the surface of the magnetar, and there’s a hotter atmospheric spot located in the opposite hemisphere.

Further work to untangle these two possibilities could have wider implications. Astronomers have previously suggested that magnetars are the main source of fast radio bursts, for example. Understanding why magnetars flare could help cement this link and assist astronomers in explaining these mysterious events.

Citation

“A Strong X-Ray Polarization Signal from the Magnetar 1RXS J170849.0-400910,” Silvia Zane et al 2023 ApJL 944 L27. doi:10.3847/2041-8213/acb703

1 36 37 38 39 40 122