
Featured Image: A New Look at Fomalhaut
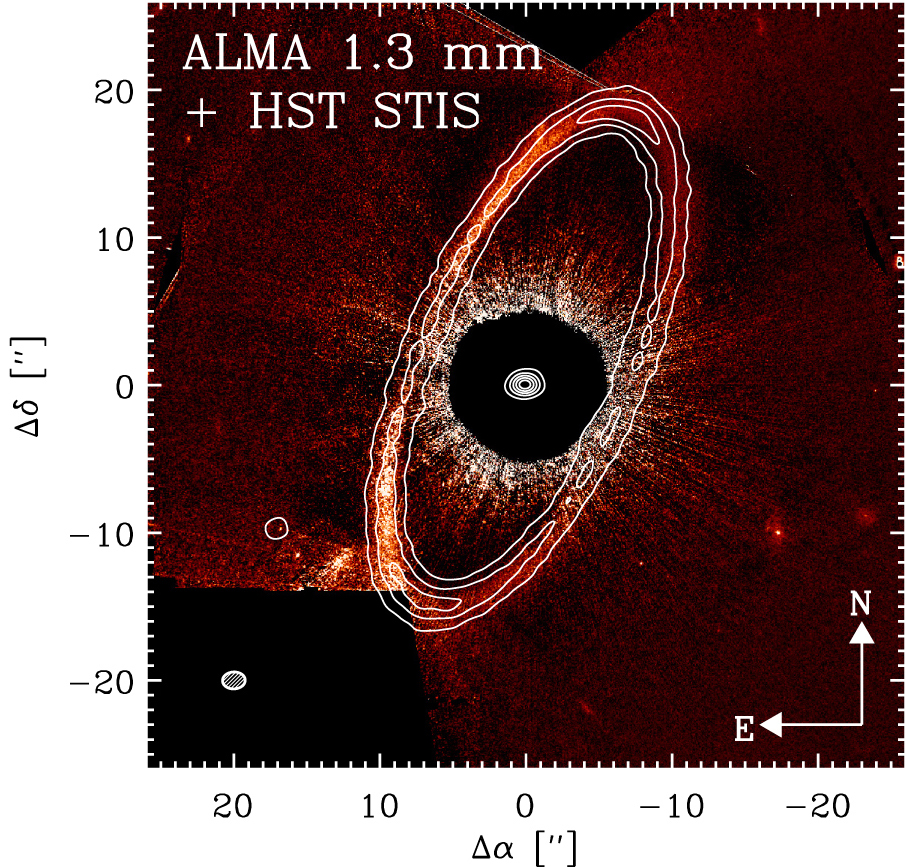
ALMA continuum image overlaid as contours on the Hubble STIS image of Fomalhaut. [MacGregor et al. 2017]
Citation
Meredith A. MacGregor et al 2017 ApJ 842 8. doi:10.3847/1538-4357/aa71ae
ALMA continuum image overlaid as contours on the Hubble STIS image of Fomalhaut. [MacGregor et al. 2017]
Meredith A. MacGregor et al 2017 ApJ 842 8. doi:10.3847/1538-4357/aa71ae

This beautiful image shows two galaxies, IC 2163 and NGC 2207, as they undergo a grazing collision 114 million light-years away. The image is composite, constructed from Hubble (blue), Spitzer (green), and ALMA (red) data. In a recent study, Debra Elmegreen (Vassar College) and collaborators used this ALMA data to trace the individual molecular clouds in the two interacting galaxies, identifying a total of over 200 clouds that each contain a mass of over a million solar masses. These clouds represent roughly half the molecular gas in the two galaxies total. Elmegreen and collaborators track the properties of these clouds and their relation to star-forming regions observed with Hubble. For more information about their observations, check out the paper linked below.
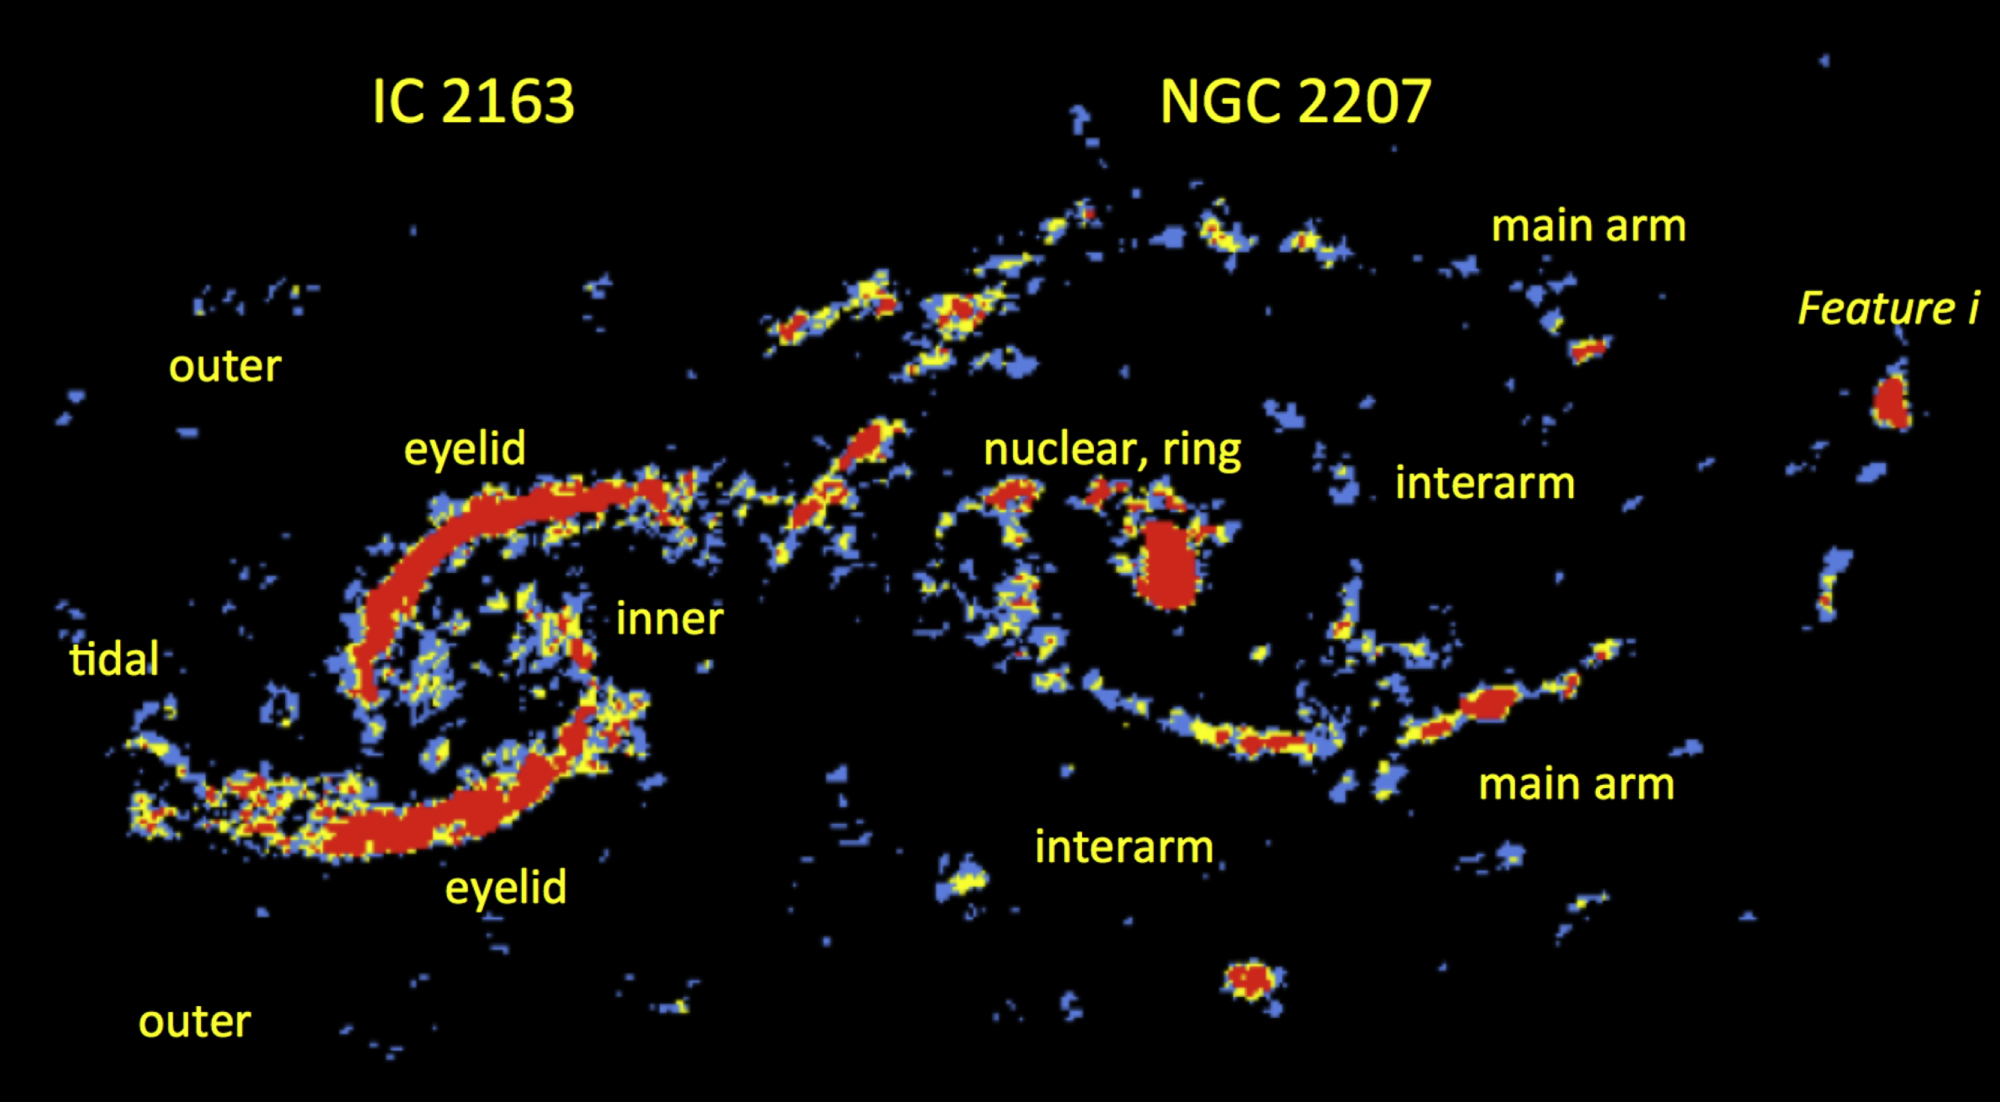
A closer look at the ALMA observations for these galaxies, with the different emission regions labeled. Most of the molecular gas emission comes from the eyelids of IC 2163, and the nuclear ring and Feature i in NGC 2207. [Elmegreen et al. 2017]
Debra Meloy Elmegreen et al 2017 ApJ 841 43. doi:10.3847/1538-4357/aa6ba5

This dynamic image of active region NOAA 12241 was captured by the Solar Dynamics Observatory’s Atmospheric Imaging Assembly in December 2014. Observations of this region from a number of observatories and instruments — recently presented by Jincheng Wang (University of Chinese Academy of Sciences) and collaborators — reveal details about the formation and eruption of a long solar filament. Wang and collaborators show that the right part of the filament formed by magnetic reconnection between two bundles of magnetic field lines, while the left part formed as a result of shearing motion. When these two parts interacted, the filament erupted. You can read more about the team’s results in the article linked below. Also, check out this awesome video of the filament formation and eruption, again by SDO/AIA:
Jincheng Wang et al 2017 ApJ 839 128. doi:10.3847/1538-4357/aa6bf3

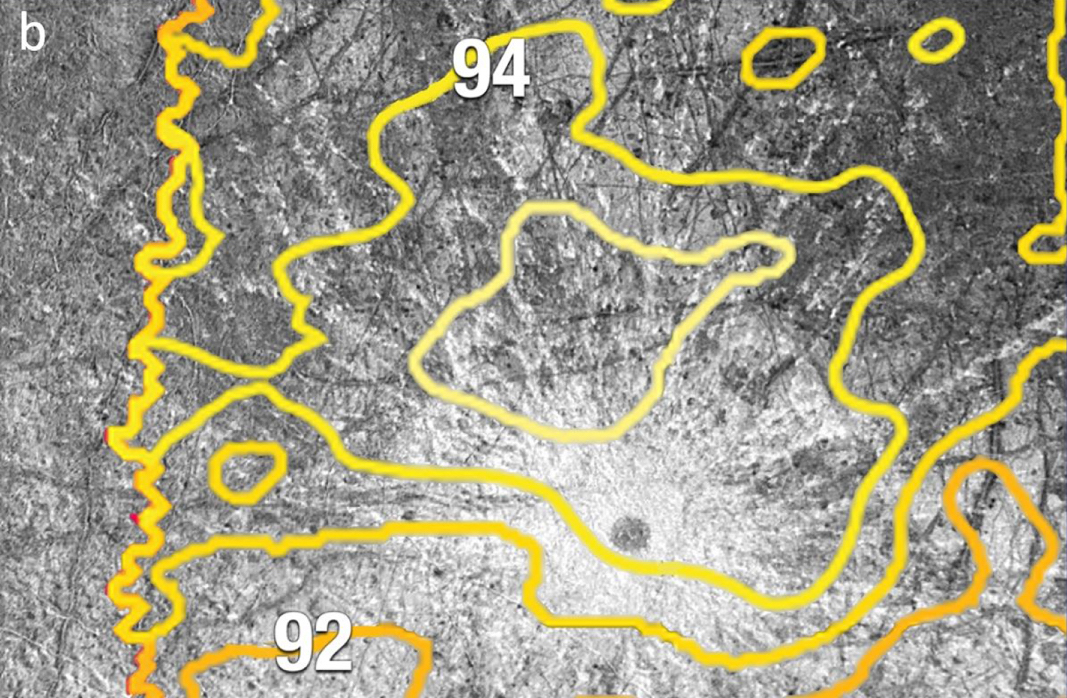
Nighttime thermal image from the Galileo Photopolarimeter-Radiometer, revealing a thermal anomaly around the region where the plumes were observed. [Sparks et al. 2017]
W. B. Sparks et al 2017 ApJL 839 L18. doi:10.3847/2041-8213/aa67f8

This image (click for a closer look!) reveals the sky location of a new discovery: the slowest spinning X-ray pulsar — a spinning, highly magnetized neutron star — ever found in an extragalactic globular cluster. The pulsar, XB091D (circled in the bottom left inset), lies in the globular cluster B091D in the Andromeda galaxy. In a recent study led by Ivan Zolotukhin (University of Toulouse, Moscow State University, and Special Astrophysical Observatory of the Russian Academy of Sciences), a team of scientists details the importance of this discovery. This pulsar is gradually spinning faster and faster — a process that’s known as recycling, thought to occur as a pulsar accretes material from a donor star in a binary system. Zolotukhin and collaborators think that this particular pairing formed relatively recently, when the pulsar captured a passing star into a binary system. We’re now seeing it in a unique stage of evolution where the pulsar is just starting to get recycled. For more information, check out the paper below!
Ivan Yu. Zolotukhin et al 2017 ApJ 839 125. doi:10.3847/1538-4357/aa689d

This figure (click for the full view) shows the meridional galactic orbits of 12 globular clusters that orbit the Milky Way. The recent release of stellar parallax data from Gaia allowed a team of scientists at Dartmouth College to improve measurements of a number of galactic globular clusters — very old clusters of stars that can either orbit within the galactic disk and bulge or more distantly in the galactic halo. In a recent publication led by Erin O’Malley, the team presents their findings and combines their new measurements for the clusters with proper motions from past studies to calculate the orbits that these globulars take. These calculations show us whether the clusters reside in the galactic disk and bulge (as only NGC 104 does in the sample shown here, since its orbit is confined to 8 kpc radially and 4 kpc vertically of the galactic center), or if they are halo clusters. To learn more about the authors’ work, you can check out the paper below!
Erin M. O’Malley et al 2017 ApJ 838 162. doi:10.3847/1538-4357/aa6574

This image shows a snapshot from a simulation of a relativistic binary black hole system. A recent study led by Dennis Bowen (Rochester Institute of Technology) presents the first exploration of gas dynamics in relativistic binary black hole systems in which each black hole is surrounded by its own small accretion disk. Bowen and collaborators use their 2D hydrodynamical simulations to explore how gas is passed back and forth between the two “mini-disks” as the black holes orbit each other. They also examine what kind of distinctive observable signals might be caused by this “sloshing” and by tidally driven spiral waves in the disks. To read more about their outcomes, check out the article below!
Dennis B. Bowen et al 2017 ApJ 838 42. doi:10.3847/1538-4357/aa63f3

Ever wonder what experimental astronomy looks like? Some days, it looks like this piece of rock in a wind tunnel (click for a better look!). In this photo, a piece of agrillite (a terrestrial rock) is exposed to conditions in a plasma wind tunnel as a team of scientists led by Stefan Loehle (Stuttgart University) simulate what happens to a meteoroid as it hurtles through Earth’s atmosphere. With these experiments, the scientists hope to better understand meteoroid ablation — the process by which meteoroids are heated, melt, and evaporate as they pass through our atmosphere — so that we can learn more from the meteorite fragments that make it to the ground. In the scientists’ experiment, the rock samples were exposed to plasma flow until they disintegrated, and this process was simultaneously studied via photography, video, high-speed imaging, thermography, and Echelle emission spectroscopy. To find out what the team learned from these experiments, you can check out the original article below.
Stefan Loehle et al 2017 ApJ 837 112. doi:10.3847/1538-4357/aa5cb5

![The authors' model of what the above disk could look like as we observe it, in a scattered-light image. The morphology of the gap can be used to estimate the mass of the planet that caused it. [Dong & Fung 2017]](https://aasnova.org/wp-content/uploads/2017/03/fig2-3-260x260.jpg)
The authors’ model of how the above disk would look as we observe it in a scattered-light image. The morphology of the gap can be used to estimate the mass of the planet that caused it. [Dong & Fung 2017]
Ruobing Dong (董若冰) and Jeffrey Fung (馮澤之) 2017 ApJ 835 146. doi:10.3847/1538-4357/835/2/146

This beautiful false-color image (which covers ~57 degrees2; click for the full view!) reveals structures in the hydrogen gas that makes up the diffuse atomic interstellar medium at intermediate latitudes in our galaxy. The image was created by representing three velocity channels with colors — red for gas moving at 7.59 km/s, green for 5.12 km/s, and blue for 2.64 km/s — and it shows the dramatically turbulent and filamentary structure of this gas. This image is one of many stunning, high-resolution observations that came out of the DRAO HI Intermediate Galactic Latitude Survey, a program that used the Synthesis Telescope at the Dominion Radio Astrophysical Observatory in British Columbia to map faint hydrogen emission at intermediate latitudes in the Milky Way. The findings from the program were recently published in a study led by Kevin Blagrave (Canadian Institute for Theoretical Astrophysics, University of Toronto); to find out more about what they learned, check out the paper below!
K. Blagrave et al 2017 ApJ 834 126. doi:10.3847/1538-4357/834/2/126