Featured Image: Supermassive Black Holes in a Galaxy Merger
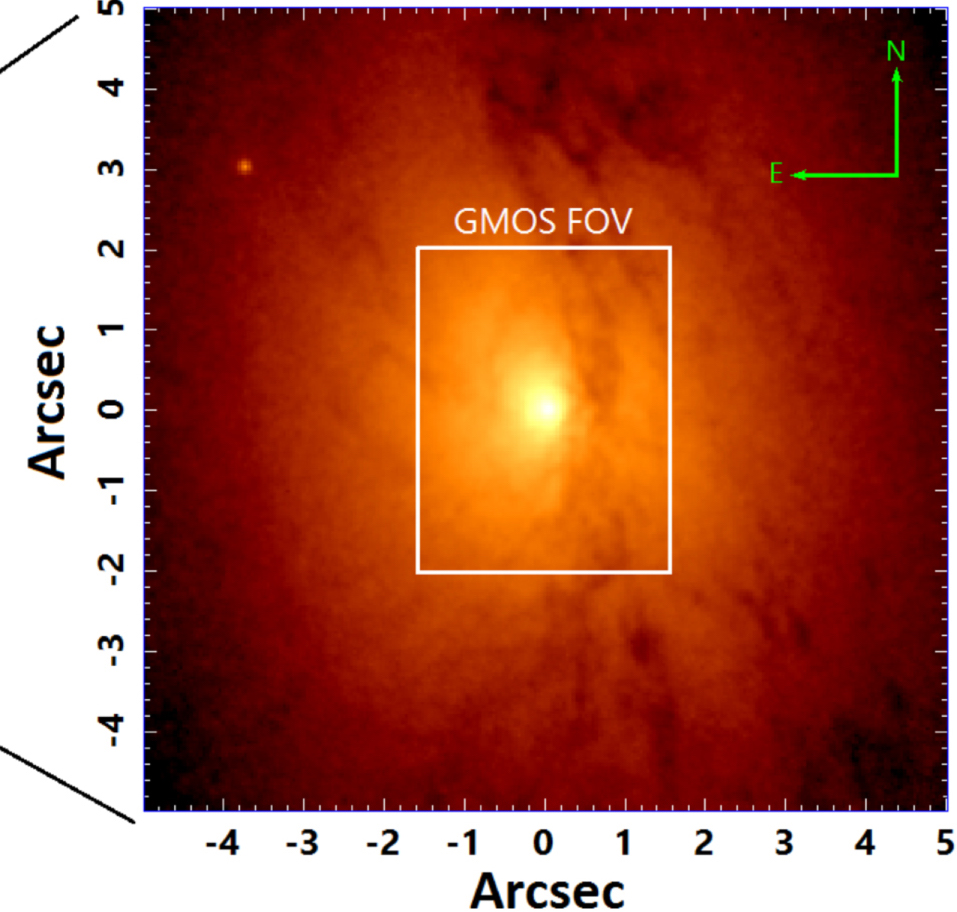
How can we hunt down so-called dual active galactic nuclei (AGN) — pairs of accreting supermassive black holes that are likely headed for a merger after the collision of their host galaxies? The above Hubble image (broader ~40” x 40” view on the left, 8” x 8” zoom-in on the right) reveals two separate stellar bulges lying at the center of the minor galaxy merger SDSS J0924+0510. In a new study led by Xin Liu (University of Illinois at Urbana-Champaign), a team of scientists further explore this merger with Hubble to demonstrate that the two stellar bulges contain two spatially distinct regions showing [O III] emission — a strong indication that there are two obscured AGN independently ionizing gas at the heart of this merger. The authors show that the dual AGN are separated by only ~3,000 light-years — just a hair’s-breadth in cosmic distances! For more information, check out the original article below.
Citation
“Hubble Space Telescope Wide Field Camera 3 Identifies an rp = 1 Kpc Dual Active Galactic Nucleus in the Minor Galaxy Merger SDSS J0924+0510 at z = 0.1495,” Xin Liu et al 2018 ApJ 862 29. doi:10.3847/1538-4357/aac9cb