
Exploring Imbalances in the Sun’s Magnetic Flux
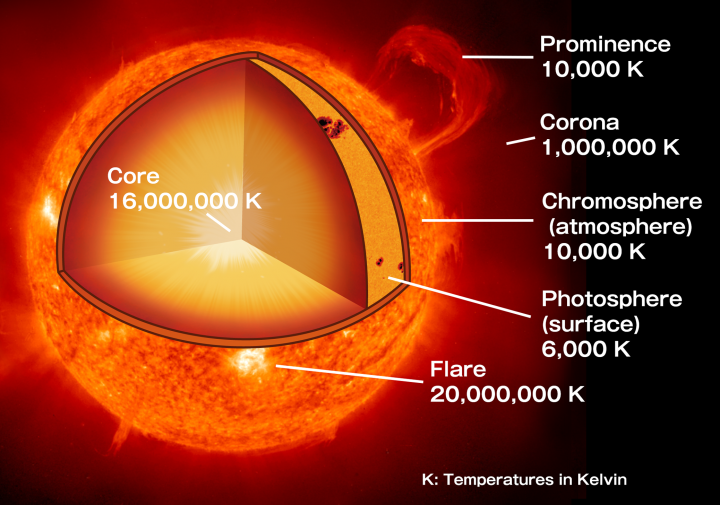
Solar flares, coronal mass ejections, prominences, sunspots — the most exciting features of the Sun are all driven by complex magnetic activity within the Sun’s interior and at its surface. Indeed, observations of the Sun have long revealed regions of magnetic flux of various magnitudes and polarities across the Sun’s disk.

Sample full-disk image of the Sun, with various features contoured in different colors, including plages (red), enhanced networks (blue); sunspots (green), and active networks (yellow). Panel F shows all contours overplotted on a magnetogram, with the grey regions corresponding to the background field. [Bose & Nagaraju 2018]
Learning from a Mean Field
The Sun’s mean magnetic field can reveal information about global behavior of our home star, helping us to better understand how magnetic fields form and evolve in stars and providing a deeper understanding of the interplanetary magnetic field that threads the space throughout our solar system.
Scientists have now regularly monitored the Sun’s mean magnetic field variations for more than two full solar cycles, on timescales ranging from a few days to several years, and we’ve learned that the mean field doesn’t stay constant — it can vary from ± 0.2 G to ± 2 G (for reference, a typical refrigerator magnet has a strength of ~50 G).
What we haven’t yet determined is the origin of the Sun’s mean magnetic field: does it come from the Sun’s large-scale, background magnetic field structure? Or is it driven by the magnetic fields of smaller active regions, like sunspots? A new study by scientists Souvik Bose (University of Oslo, Norway) and K. Nagaraju (Indian Institute of Astrophysics) explores these relative contributions.
Active Regions and Backgrounds
By decomposing Solar Dynamics Observatory observations of the Sun’s full disk into different regions, Bose and Nagaraju track the magnetic flux resulting from three categories:
- sunspots, dark spots that appear in the Sun’s photosphere as magnetic flux emerges;
- plages, enhanced networks, and active networks, surface features created by emergence and dispersion of weaker magnetic fields; and
- the Sun’s large-scale magnetic field — i.e., background regions that don’t fall into categories (1) and (2).
They then explore the variability of these fluxes over the span of several years.

Magnetic field variability vs. time, for A) the solar mean magnetic field; B) the background field; C) plages, enhanced networks, and active networks; and D) sunspots. The largest contributor to solar mean magnetic field variability is clearly the large-scale background field. [Bose & Nagaraju 2018]
The authors point out that their work only indicates the origin of the solar mean magnetic field’s variability; its amplitude may yet be governed by the presence of sunspot activity on the surface of the Sun. Nonetheless, this study brings us a little closer to understanding the complex magnetic activity of our nearest star.
Citation
Souvik Bose and K. Nagaraju 2018 ApJ 862 35. doi:10.3847/1538-4357/aaccf1


