Features RSS

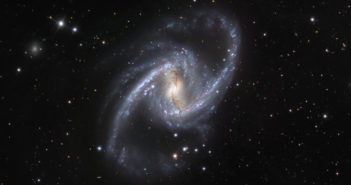
a spiral galaxy with two long, distinct spiral arms and a central bar

Astronomers recently released details of the first Cepheid variable stars observed with JWST. These unique objects are used as cosmic rulers and so the new measurements have important consequences for our understanding of the universe’s expansion.

A Rung in the Cosmic Distance Ladder

Hubble image of Cepheid variable star RS Puppis

Cepheid variable RS Puppis, pictured here in an image from the Hubble Space Telescope, is 15,000 times brighter than the Sun. Cepheids provide a way to measure the distances to other galaxies. [NASA, ESA, and the Hubble Heritage Team (STScI/AURA)–Hubble/Europe Collaboration; Acknowledgment: H. Bond (STScI and Pennsylvania State University)]

As their name suggests, Cepheid variable stars change in brightness over time in a regular, repeating pattern. Astronomers have known for more than a century that inherently brighter Cepheids take longer to vary that brightness. The inherent brightness of a Cepheid can then be compared to how bright the star appears to us. As light fades over distance, a bigger difference implies the Cepheid is farther away. So astronomers have long used Cepheids as a yardstick to measure the distance to nearby galaxies using instruments such as the Hubble Space Telescope.

However, calculating those distances has always required some assumptions. Cepheids are often found in regions of recent star formation, so they are embedded in a lot of dust. Pushing Hubble observations into the near infrared helped to mitigate the effect of the dust, but had the knock-on effect of reducing Hubble’s resolution by a factor of two to three. In turn, this limited the precision with which astronomers could measure the brightness of the Cepheids.

JWST Enters the Scene

JWST represents a big upgrade. It has a greater resolution to start with and is specifically designed to work in the infrared. Astronomers plan to revisit all the Cepheids observed by Hubble. This will take years, but a team led by Wenlong Yuan (Johns Hopkins University) has released the preliminary results of an observation run taking in 31 Cepheids in the galaxy NGC 1365.

plot of magnitude versus period for Cepheid variable stars

Apparent magnitude of Cepheid variable stars as a function of their period. JWST observations are shown in red and Hubble Space Telescope observations, translated to the same frequency as the JWST data, are shown in grey. Click to enlarge. [Yuan et al. 2022]

The team found good agreement with the previous brightness measurements made by Hubble. It’s a vital step in trying to resolve an ongoing issue in cosmology known as the Hubble tension. Different methods for measuring the expansion of the universe disagree on how fast the cosmos in expanding. One proposed solution is that the work to correct the Hubble measurements of Cepheids introduced a bias that was throwing the measurements off. This seems less likely now given that JWST data appear to agree with the Hubble observations.

That said, the authors note the preliminary nature of these observations and that they are “far from the best JWST can do.” Future observations will have a longer exposure time and will benefit from improved calibration data. Only then will we truly know whether Cepheids are the key to unlocking the enigma of the Hubble tension.

Citation

“A First Look at Cepheids in a Type Ia Supernova Host with JWST,” Wenlong Yuan et al 2022 ApJL 940 L17. doi:10.3847/2041-8213/ac9b27

Hubble image of a face-on spiral galaxy

JWST’s observations of galaxies in the distant universe have already shaken up our understanding of how the first galaxies evolved. But could our observations of faraway galaxies be misled by closer interlopers?

example of a high-redshift galaxy discovered with JWST

One of the many galaxies with redshift of z > 10, corresponding to the first 500 million years after the Big Bang, discovered with JWST observations. [Adapted from: Science: NASA, ESA, CSA, Tommaso Treu (UCLA); Image Processing: Zolt G. Levay (STScI)]

Distance Makes the Galaxy Grow Redder… but So Does Dust

During its first year, JWST observed many candidate high-redshift galaxies, corresponding to when the universe was just a few hundred million years old. As these candidates piled up, their numbers and masses started to stretch the bounds of what is likely under leading theories of galaxy formation and evolution. The tension between theory and observations has led some researchers to suggest that overhauling our theories is in order.

Before we give existing theories the boot, there’s another possibility to consider: some galaxies with reported redshifts of > 10 may actually be dusty star-forming galaxies at z < 7, skewing our statistics. Why might we confuse these two very different galaxy populations, and what can we do about it?

Lyman Breaks vs. Dusty Dropouts

Here’s how the mix-up can occur: researchers pick out extremely distant galaxies by searching for the Lyman break — a sharp drop-off in galactic emission at short wavelengths due to clouds of neutral hydrogen that absorb starlight beyond a certain wavelength. In practice, astronomers search for galaxies that are present in redder filters and “drop out” of bluer images.

Dusty star-forming galaxies may appear similar in our observations. When strong ultraviolet emission powered by ultra-hot young stars is soaked up by dust and re-emitted at longer wavelengths, the resulting color of the galaxy can mimic that of a more distant galaxy, including the drop-out behavior. As the authors point out, the confusion between nearby dusty galaxies and more distant galaxies isn’t unique to JWST; researchers analyzing Hubble Space Telescope data wrestled with the same issue, though the redshift ranges were different — in Hubble images, z ~ 6–8 galaxies vied with z ~ 2–3 galaxies for our attention.

images of CEERS-DSFG-1 in six JWST filters

Images of the galaxy CEERS-DSFG-1, which exhibits drop-out behavior in JWST images. The galaxy is clearly visible in the longer-wavelength filters and drops out at shorter wavelengths. [Zavala et al. 2023]

Inspecting High-Redshift Candidates

In a recent publication, Jorge Zavala (National Astronomical Observatory of Japan) and collaborators tackled this challenge by searching for thermal emission from dust in the galaxy CEERS-DSFG-1, which JWST observed as part of the Cosmic Evolution Early Release Science (CEERS) survey. CEERS-DSFG-1 shows drop-out behavior similar to other high-redshift galaxy candidates, but detecting dust emission could indicate that the galaxy is located at a lower redshift.

probability density function for the redshift of a candidate high-redshift galaxy.

Probability of CEERS-DSFG-1 having certain redshifts as derived from near-infrared (NIR) JWST data, longer-wavelength data (labeled FIR), and a combination of the two. The combined fit (green shaded area) places the strongest constraints on the redshift. This plot also shows the importance of using properly calibrated JWST data. Click to enlarge. [Zavala et al. 2023]

The team detected dust emission from the galaxy at a wavelength of 1.1 millimeters, and they tracked the galaxy at shorter wavelengths down to 2.0 microns (1 micron = 10-6 meter), at which point the emission abruptly dropped off. By using a range of models to fit the galaxy’s spectral energy distribution — the energy emitted by a source as a function of wavelength — the team showed that longer-wavelength data provide an important constraint on the galaxy’s redshift. Considering near-infrared JWST data and 1.1-millimeter data simultaneously places the galaxy at a redshift of z = 5.1 (>1 billion years after the Big Bang), while estimates based solely on the near-infrared JWST data leave open the possibility that the galaxy is located at z ~ 12–14 (300–400 million years after the Big Bang).

This study makes it clear that high-redshift galaxies detected by JWST need further investigation before they can be confirmed. Hopefully, follow-up long-wavelength observations of high-redshift candidates will confirm their redshift one way or another, allowing us to hone our models of the early universe further.

Citation

“Dusty Starbursts Masquerading as Ultra-high Redshift Galaxies in JWST CEERS Observations,” Jorge A. Zavala et al 2023 ApJL 943 L9. doi:10.3847/2041-8213/acacfe

A computerized rendering of a small spacecraft with extended solar panels shown above the surface of a grey moon. The surface is erupting with white jets of material in front of and behind the spacecraft.

Daring high-speed, low-altitude maneuvers and scientists wrestling with questions of life elsewhere in the universe: these are both elements found not only in Hollywood blockbusters, but also in a recently proposed mission to Saturn’s moon Enceladus.

But Why, Some Say, (This) Moon?

An illustration of Enceladus with a quarter of the moon removed to reveal an inner layered structure. Each layer and several other notable features are labeled. The layers are: ice shell, global ocean, rocky core.

A schematic of the interior structure of Enceladus as best understood today. The plumes are launched from the “Tiger Stripes” in the southern hemisphere. [Cable et al. 2021]

At barely 300 miles across, tiny Enceladus is not the most dominating exploration target in the outer solar system. What it lacks in size, though, it makes up for with panache. Enceladus simply cannot contain itself, and it makes its presence known by spewing forth plumes of ice and gas from an immense reservoir of liquid water trapped beneath the surface ice. This dramatic performance was intriguing enough to convince the Cassini mission to take a closer look, and what it found convinced planetary scientists that Enceladus was more than just a showboat: it’s a complex system that just might offer habitable conditions at the bottom of its ocean.

Some of Cassini’s most exciting finds were specific particles and molecules in the plumes that are usually associated with hydrothermal vents here on Earth, where strange life forms survive just fine even without sunlight. However, Cassini was limited both by the technology of its time and by its design: since its engineers didn’t know the plumes existed before it launched, it carried no instruments designed specifically to investigate them.

A top-down sketch of ellipses around Saturn. Titan's orbit is the furthest out, Enceladus's is the closest. The spacecraft trajectories are eccentric and pass between the two distances set by the other moons.

Orbital trajectory around Saturn, which is represented by the green circle. Enceladus’s orbit is marked in pink, Titan’s is shown in red. Two sets of spacecraft orbits that would allow for close flybys of Enceladus at different mission phases are marked in purple and cyan. [Mousis et al 2022]

Recently, a team of international collaborators led by Olivier Mousis (Aix-Marseille University) decided it is time to pick up where Cassini left off. In response to the European Space Agency’s (ESA) call for proposals for €550 million Medium-class missions, they submitted a concept for a spacecraft designed to fly straight through the plumes, one which would sniff out gases and ices as it buzzes less than 100 km over the surface at 4 km/s. The mission, called Moonraker, would spend more than a decade cruising to Saturn and would arrive no earlier than 2048.

Mixed Blessings

Unfortunately for the proposal team, ESA did not select Moonraker as one of the four mission concepts for further development, citing difficulties keeping the cost and mission duration within the scope of a Medium-class mission. However, what was surely disappointing news at the time seems much rosier in hindsight: since crafting this initial modest mission plan, ESA announced that they’ll soon seek proposals for much larger, €1 billion missions reliant on larger rockets. The team now plans to regroup, add a few more instruments and science goals to their concept, then resubmit a more ambitious proposal for this latest opportunity.

While it’s impossible to say which missions will ultimately get selected, it remains possible that we’ll celebrate the earliest part of the second half of this century with a robotic dive through these distant, frigid jets.

Citation

“Moonraker: Enceladus Multiple Flyby Mission,” O. Mousis et al 2022 Planet. Sci. J. 3 268. doi:10.3847/PSJ/ac9c03

painting of the aurora over the ocean

Earth sits in a sea of plasma that is usually calm. Sometimes, though, solar storms streak across space, and new research explores what can happen when two storms collide before reaching Earth.

Solar Storms on the Horizon

photograph of a coronal mass ejection

The Solar & Heliospheric Observatory (SOHO) took this coronagraphic image of a coronal mass ejection on 20 April 1998. [SOHO (ESA & NASA)]

Each year, the Sun launches tens to hundreds of coronal mass ejections (CMEs): bundles of plasma and magnetic fields flung from the Sun’s upper atmosphere out into the solar system. When a CME strikes Earth, our planet’s protective magnetic shield is compressed and distorted, admitting energetic particles from the Sun that generate the aurora — and can damage spacecraft electronics or interfere with radio communications.

A single CME is already powerful, but successive CMEs can crash into each other and combine, creating even larger storms. There’s evidence that some of the most intense solar storms that we know of, like the 1859 Carrington event that pushed the Northern Lights south to the Caribbean, resulted from two or more CMEs joining forces. In a recent publication, Gordon Koehn (Imperial College London) and collaborators sought to understand how to produce the strongest solar storm possible from the collision of two CMEs — the “perfect” storm.

representation of the modeled plasma density

Example of model output 30 hours after the launch of a single CME. The color scale shows the normalized plasma density. [Adapted from Koehn et al. 2022]

Magnetic Modeling

Koehn and coauthors used magnetohydrodynamic models to simulate pairs of CMEs and determine the strength of the resultant storm. The team explored three factors: the tilt of the CMEs with respect to Earth’s magnetic field, how their magnetic fields twist, and the time between the first and second CME being launched from the Sun.

To quantify the strength of the storms, the team measured how compressed Earth’s simulated magnetic field was and calculated the Disturbance Storm Time (Dst) index — a measure of the electric current generated by the incoming solar plasma — which is a common measure of a storm’s severity.

Scaling Storm Severity

Koehn and collaborators first simulated just one CME to test the effects of changing its orientation. They found that when the CME is oriented so that its magnetic field exactly opposes Earth’s, it causes the largest disturbance. This is because the oppositely directed magnetic fields rearrange when they meet, peeling back Earth’s protective magnetic field and allowing solar plasma to stream into the atmosphere.

plot of simulated parameters

Southward-pointing magnetic field (top), Dst index (middle), and the distance to the magnetopause (bottom)  — the boundary between the region dominated by Earth’s magnetic field and the solar wind — as a function of the time between the CMEs. [Adapted from Koehn et al. 2022]

The team then threw a second CME into the mix, launched 12–36 hours after the first but traveling three times faster. In this set of scenarios, the CMEs collided anywhere from halfway between the Sun and Earth to out beyond Earth’s orbit. The largest storm occurred when the second CME was launched 28 hours after the first, leading to a collision just before striking Earth.

Lastly, the team found that changing the direction in which the CMEs’ magnetic fields twist can convert a moderate storm into a severe one. Each of these three tests showed that changing the characteristics of two colliding CMEs can dramatically change the outcome of their collision, emphasizing the need for precise modeling of CME interactions to support space weather forecasting.

Citation

“Successive Interacting Coronal Mass Ejections: How to Create a Perfect Storm,” G. J. Koehn et al 2022 ApJ 941 139. doi:10.3847/1538-4357/aca28c

Hubble image of spiral galaxy NGC 4051

Astronomers are still trying to figure out exactly how supermassive black holes form. They may be the result of smaller black holes combining, and a new study says that these smaller black holes could show up in an upcoming survey with JWST.

It Starts with a Seed

image of the Milky Way's central supermassive black hole

Supermassive black holes like the one at the center of our galaxy, shown here in an image from the Event Horizon Telescope, may have grown from smaller “seed” black holes. [EHT Collaboration; CC BY 4.0]

The biggest black holes in the universe can tip the scales at billions of solar masses. What’s more, the first ones formed within a couple of hundred million years of the Big Bang. Just how did the universe build such gargantuan objects so quickly?

Usually black holes form when a massive star dies, but no single star could birth a black hole that big. Instead, like flowers, supermassive black holes probably grow from seeds. Perhaps the smaller black holes created by the deaths of the first massive stars merged. This could create black holes up to a thousand solar masses, which gravity could then combine into supermassive black holes. Black holes up to a million solar masses may have formed directly from the gravitational collapse of dense gas clouds in the early universe. They too would merge over time.

Finding a seed that has yet to germinate into a supermassive black hole would allow astronomers to see the process in action. Andy Goulding and Jenny Greene (both Princeton University) have recently investigated whether black hole seeds could reveal themselves in upcoming deep sky surveys with JWST. They focus on black holes with approximately one million solar masses at redshifts between 7 and 10.

Colour Differences

By definition a black hole is invisible. Its gravitational pull is so intense that it swallows all light that falls upon it. Yet black holes often reveal themselves through their accretion discs — the super-heated queue of material waiting to be devoured. Their accretion discs are often bright enough to be seen across most of the visible universe. These bright centres of distant galaxies are called active galactic nuclei.

In their study, Goulding and Greene combined templates of active galactic nuclei at lower redshifts with mock galaxy catalogs specifically created for JWST. They concluded that the best local analogs of distant seed black hole active galactic nuclei are Seyfert I galaxies — active galaxies with broad emission lines in their spectra. The ultraviolet emission of black hole seeds and Seyfert I galaxies is expected to be similar.

image of stars and galaxies in the JADES field

The JADES study region, which overlaps with the Hubble Ultra Deep Field. Click to enlarge. [NASA, ESA, CSA, M. Zamani (ESA/Webb)]

They then looked at whether these active galactic nuclei could show up in the upcoming JWST Advanced Deep Extragalactic Survey (JADES). They found that a distant active galactic nucleus powered by a seed black hole should appear a different colour to the rest of the galaxy in images taken by JWST’s Near Infrared Camera (NIRCam). Specifically, the galaxy will appear blue and the nucleus will be redder.

While it’s hard to put an exact figure on it, Goulding and Greene estimated that astronomers might expect to find a few to tens of seed black holes within a one hundred square arcminute field. Perhaps then we’ll finally start to understand how supermassive black holes came to reside in the heart of almost every galaxy in the universe.


Citation

“An Empirical Approach to Selecting the First Growing Black Hole Seeds with JWST/NIRCam,” Andy D. Goulding and Jenny E. Greene 2022 ApJL 938 L9. doi:10.3847/2041-8213/ac9614

artist's impression of a tidal disruption event

A recent study of stars ripped apart by black holes — tidal disruption events — gives insight into the properties of these rare events and reveals a new category of events that lack strong spectral features.

Disruptive Encounters

sample tidal disruption event light curve

An example light curve of a tidal disruption event. Click to enlarge. [Adapted from Hammerstein et al. 2022]

When a star passes too close to a black hole, the black hole’s powerful tidal forces spaghettify the star, stretching and elongating it until it’s eventually ripped apart. Some of the doomed star’s gas spirals toward the black hole, forming a superheated accretion disk that shines across the electromagnetic spectrum, acting like a beacon that draws our attention toward an otherwise hidden black hole.

By collecting light curves and spectra of tidal disruption events as they brighten and fade over the course of months or years, astronomers have learned much about these dramatic events. In a recent publication, researchers tackled a new sample of shredded stars, aiming to understand how their spectral signatures and light curves map to their underlying physical properties.

images of nine galaxies

A subset of the tidal disruption event–hosting galaxies identified in the study. Click to enlarge. [Adapted from Hammerstein et al. 2022]

Sorting Spectra and Lining Up Light Curves

A team led by Erica Hammerstein (University of Maryland; NASA’s Goddard Space Flight Center) selected a sample of 30 tidal disruption events observed by the Zwicky Transient Facility, which surveys the entire northern night sky every few days. The team used a set of selection criteria such as color and the time it took the event to flare and fade to distinguish the desired stellar shredding from similarly fleeting events, like supernovae.

While the tidal disruption events in the team’s sample have similar colors and light curves, their spectra revealed hidden differences; the strength of hydrogen and helium emission lines varied from event to event, and some events had no hydrogen or helium emission lines at all, revealing a previously unknown class of featureless tidal disruption events. When Hammerstein and collaborators used models to delve into their curated sample of events, they found that the featureless events tended to occur around more massive black holes, and events showing only helium emission lines involved more massive stars than the other three spectral classes.

plot of disrupted star mass for each of the four spectral types

Cumulative distribution of the mass of the disrupted star for each of the four spectral types: featureless (black), hydrogen emission features (red), helium emission features (blue), hydrogen and helium emission features (green). [Hammerstein et al. 2022]

More to Learn

Analyzing the events’ light curves revealed further trends (too many to discuss here — be sure to check out the original article!), such as a potential connection between the maximum brightness of an event and how long it takes to fade.

As is often the case when we begin to study increasingly large samples of rare phenomena, the data tend to both provide hints and pose questions. Future observatories and surveys tailored to detecting transient events, such as the decade-long Legacy Survey of Space and Time that will kick off at the Vera C. Rubin Observatory in 2024, are poised to reveal many more tidal disruption events — guiding us toward a better understanding of torn-apart stars.

Citation

“The Final Season Reimagined: 30 Tidal Disruption Events from the ZTF-I Survey,” Erica Hammerstein et al 2023 ApJ 942 9. doi:10.3847/1538-4357/aca283

An illustration of an opaque planet transiting in front of a star. The planet is surrounded by a comet-like coma of darker material.

With JWST up and running, astronomers are getting a first look at the quirks of individual exoplanets. Features never before examined are coming into view: for instance, a recent study has revealed that while HAT-P-18b may not have much methane, it does have a tiny tail.

JWST Shows Off, Finds a Corgi

Now more than a year past its launch, JWST is finally doing what it was designed to do: collecting photons and wowing astronomers with the precision of its data. One of the earliest flexes of its scientific power occurred last summer, when it trained its attention on the transit of a Jupiter-sized, Saturn-mass exoplanet named HAT-P-18b.

While the team, led by Guangwei Fu (Johns Hopkins University), found several molecules in the upper atmosphere of the planet using the Near Infrared Imager and Slitless Spectrograph (NIRISS) instrument, what they didn’t find was more surprising.

An x-y scatterplot of transit depth vs. wavelength, spanning the narrow range centered around the helium absorption line. The data and the model both form a "bump" in the middle and are flat at the edges.

A subsample of the data, orange, and the best-fit model, blue, showing the helium absorption signature. The y-axis is in units of transit depth, meaning enhanced absorption appears as a positive bump. [Fu et al. 2022]

The first of these surprises was a helium absorption signature, but not surrounding the planet: instead, their results indicate that HAT-P-18b is dragging along a faint tail of escaping helium. Similar features have been spotted trailing behind other planets, but this one was so subtle that it was previously missed by ground based observatories. In other words, HAT-P-18b is the corgi of the exoplanets: it has a tail, but it’s not a dominant structure.

But What About Methane?

The second surprise concerned a molecule not displaced from the planet, but possibly missing entirely. One of the primary motivations for targeting HAT-P-18b specifically is its position in a uniquely helpful corner of parameter space for modelers working on a methane mystery.

Hot planets with surface temperatures over 1000K are not expected to have any methane in their atmospheres, since thermodynamics at these extreme conditions prefer other species. However, simple models suggest that any worlds cooler than this should show signs of absorption caused by methane molecules in the upper atmosphere intercepting photons with a specific wavelength.

Strangely, however, this prediction has not panned out in previous studies. Searches of several planets that should have held methane turned up none. This tension called for a closer look: were the assumptions baked into the models wrong, or was there something strange about the first worlds surveyed? With an equilibrium temperature of 800K, HAT-P-18b was the perfect target to help move the needle one way or another.

An x-y plot of transit depth vs. wavelength. The entire reduced spectrum from 0.6-2.8 microns is shown with black points. Four fits to the data from four separate models are overplotted. The models which assume equilibrium chemistry do not follow the data well, though the others better recreate the overall shape.

The NIRISS data, black, and several possible model atmospheres to explain it, colored on top. The green and red models were produced assuming equilibrium chemistry. The x-axis denotes wavelength, and the ticks range linearly from 0.5 to 2.5 microns. [Fu et al. 2022]

Fu and collaborators made no conclusive methane detection, further deepening the model mismatch puzzle. Models which assume the atmosphere is in chemical equilibrium struggled to reproduce the combination of no-methane, yes-water seen in the data, which suggested that some other mechanism(s) were involved to remove the expected gas. Even more striking, other models which made no assumption about an equilibrium also did not confidently prefer including methane in the final fit over leaving it out entirely. 

In all, JWST revealed HAT-P-18b to be a strange world, one which subverts our expectations of atmospheric chemistry but charms with a helium tail. We’ll have to wait for JWST observations of other planets before we know just how weird either of those traits truly is.

Citation

“Water and an Escaping Helium Tail Detected in the Hazy and Methane-depleted Atmosphere of HAT-P-18b from JWST NIRISS/SOSS,” Guangwei Fu et al 2022 ApJL 940 L35. doi:10.3847/2041-8213/ac9977

ultraviolet image of CW Leonis

The sooty cloud surrounding the carbon star CW Leonis is known to contain more than 50 types of molecules, and the remaining unassigned spectral lines hint that many more molecules are present. Can a laboratory study of a metallic molecule help us identify some of these mystery spectral lines?

Searching Space for Chemical Compounds

Hubble Space Telescope image of CW Leonis

Another view of CW Leonis, this time from the Hubble Space Telescope. This image highlights the dusty layers shed by this evolved star. [ESA/Hubble & NASA, T. Ueta, H. Kim; CC BY 4.0]

Astronomers have discovered more than 200 molecules in space since the first molecule was found in 1937. These discoveries confirmed something incredible — that in the cold, sparse space environment, individual atoms can link up to form complex molecules. Finding molecules in space represents both a challenge and an opportunity: how can we explain the presence of molecules in such an unforgiving environment, and how can we use the fact that they do exist to learn about the chemistry of interstellar and circumstellar space?

One of the best sites to study extraterrestrial molecules is in the dusty shroud and outflows of the star CW Leonis, also known as IRC+10216. CW Leonis is a carbon star: a supergiant star with a high abundance of carbon in its atmosphere. Among CW Leonis’s many molecules are metal-containing species like silicon dicarbide (SiC2), leading researchers to wonder if similar molecules might be responsible for any of the remaining unidentified lines in CW Leonis’s spectrum.

plot of the magnesium dicarbide energy levels and the transitions observed in the lab and in the astrophysical site

Summary of the known transitions and energy levels for magnesium dicarbide, as determined from laboratory and astrophysical observations. [Changala et al. 2022]

Making Magnesium Molecules

A team led by Bryan Changala‬ (Center for Astrophysics ∣ Harvard & Smithsonian) focused their search on magnesium dicarbide (MgC2). Changala and collaborators considered it likely that CW Leonis’s dusty shroud contains magnesium dicarbide because it’s chemically similar to the already-discovered silicon dicarbide, and many other magnesium-containing molecules have been found there.

How do you determine if a star’s spectral lines are due to a particular molecule, though? In order to be confident that we’ve discovered a molecule in space, we need to know its spectrum, which is best determined by studying the molecule in a lab. In the case of magnesium dicarbide, researchers have used quantum mechanical models to predict the molecule’s spectrum but had never confirmed it in a lab.

Changala‬ and coauthors combined magnesium atoms with acetylene molecules, which are made of carbon and hydrogen, hoping to synthesize magnesium dicarbide. The team successfully matched a spectral line from their sample to a line predicted by quantum mechanical models and performed additional tests to ensure that the molecule they created was actually magnesium dicarbide.

Seeking a Spectral Match

plot of one of the spectral lines attributed to magnesium dicarbide

Example of a spectral line attributed to magnesium dicarbide. The fitted line profile is shown in red, and the blue “U” indicates unidentified lines. [Adapted from Changala et al. 2022]

Ultimately, Changala and collaborators used the spectrum of the newly synthesized molecule to assign 14 of CW Leonis’s unknown spectral lines to magnesium dicarbide and its isotopologues — molecules with the same chemical formula and structure in which one or more atoms has a different number of neutrons.

What does the discovery of magnesium dicarbide in CW Leonis’s spectrum tell us? By comparing the abundance of magnesium dicarbide in the star’s surroundings with the abundances of other magnesium-containing molecules, researchers might be able to glean how these molecules are made. Additionally, these observations may help us understand how metals affect the chemistry of carbon-rich environments like the surroundings of carbon stars, helping to lift the veil on these dusty objects.

Citation

“Laboratory and Astronomical Discovery of Magnesium Dicarbide, MgC2,” P. B. Changala et al 2022 ApJL 940 L42. doi:10.3847/2041-8213/aca144

JWST image of the Tarantula Nebula

It’s been a big year for astronomy. We’ve seen the first image of the Milky Way’s central supermassive black hole, witnessed the launch of new space missions, and finally set eyes upon the first observations from JWST. As 2022 draws to a close, let’s take a look back at some of the amazing science we covered on AAS Nova this year. Here are the top 10 most-read posts of 2022:

10. Featured Image: A Twisted Magnetic Rope

Visualization of a magnetic flux rope

Visualization of a magnetic flux rope. [Adapted from Hu et al. 2022]

A team led by Qiang Hu used a new quasi-three-dimensional fitting method to analyze spacecraft data of a passing solar storm. This new technique helped the team understand the structure of the storm’s magnetic field. The resulting simulations show three-dimensional winding behavior that was not present in one- or two-dimensional models of the same event, allowing the team to get a better grasp on the intricate plasma physics at play.

image of the Sun releasing two coronal mass ejections

Two coronal mass ejections launched from the Sun in November 2000, as seen by the Solar and Heliospheric Observatory. [ESA/NASA/SOHO]

9. Caught in a Solar Storm on the Way to Mars

Two spacecraft at different distances from the Sun happened to lie along the same solar magnetic field line when a powerful solar storm swept through the solar system. A team led by Shuai Fu, Zheyi Ding, and Yongjie Zhang studied the data from the two spacecraft in order to understand how high-energy particles from the Sun travel through the solar system — knowledge that will be critical when planning for crewed space missions traveling beyond Earth’s protective magnetic field.

8. Hydrate or Die-drate: Was Venus Ever Habitable?

side-by-side images of Venus's surface today and an imagining of what its surface might have looked like in the past

Radar image of Venus’s surface today (left) and an imagined version of its past surface (right). [NASA/Jet Propulsion Laboratory-Caltech (left) and NASA (right)]

Astrobites’s Katya Gozman reported on research by Joshua Krissansen-Totton and collaborators, who used models of Venus’s atmosphere and interior to explore the possibility of our hellish planetary neighbor hosting liquid water on its surface in the distant past. Their results may have deepened the mystery of Venus’s past habitability, showing that conditions on present-day Venus are compatible with two pasts: one in which Venus never had surface water, and one in which it had deep oceans for up to 3.5 billion years.

Artist's impression of a quasar

Artist’s impression of a quasar. [S. Munro; CC BY 4.0]

7. Clues from Quasars in the Early Universe

Quasars — ultra-bright, accreting supermassive black holes in the early universe — are visible up to 13 billion light-years away, providing a way to study young supermassive black holes. But how exactly these black holes become supermassive in less than a billion years is still unknown. A team led by Jinyi Yang approached this question by using infrared spectroscopy to determine the masses and accretion rates of more than three dozen quasars in the first billion years after the Big Bang. The team’s efforts yielded an estimate of the masses of the “seeds” from which the quasars grew, but how the seeds themselves came to be is still a mystery!

6. How Do Milky Way–Like Galaxies Grow?

NGC 6744, a Milky Way–like galaxy

NGC 6744 is thought to be similar to the Milky Way in size and structure. [ESO; CC BY 4.0]

A team led by Maryam Hasheminia explored the evolution of Milky Way–like spiral galaxies, seeking to understand if similar galaxies’ stars form first in the galactic center, the galactic outskirts, or equally throughout the galaxy. Using observations of suitable galaxies from survey data, the team found that all parts of these galaxies form stars at about the same pace, which is at odds with one of the leading hypotheses for how galaxies grow.

Hubble Space Telescope image of galaxy cluster Abell 2744

Galaxy cluster Abell 2744 — the focus of the GLASS Early-Release Science program. [NASA, ESA, and J. Lotz, M. Mountain, A. Koekemoer, and the HFF Team (STScI)]

5. Through the Looking GLASS with JWST

At long last, JWST is operational! In the first of several focus issues, researchers introduced the Grism Lens-Amplified Survey from Space (GLASS) Early-Release Science program. This program, led by Tommaso Treu, focuses on the epoch of reionization, during which the first stars in the universe were born. Studying galaxies in the first billion years after the Big Bang is critical to understanding this era, and JWST gives us a window into reionization like we’ve never had before.

4. Winding Up to a Quadrillion Electronvolts of Energy

Artist's impression of a pulsar in a binary system

Artist’s impression of a pulsar in a binary system with another star. [NASA’s Goddard Space Flight Center]

Where do high-energy particles and photons come from? Andrei Bykov and collaborators tested a model in which the winds from a star and its compact object companion collide, accelerating protons to petaelectronvolt energies — that’s one quadrillion electronvolts — and creating gamma rays and neutrinos. This model might help to explain the rare but remarkable detections of extremely high-energy photons over the past decade.

Event Horizon Telescope image of the Milky Way's supermassive black hole

The first Event Horizon Telescope image of the Milky Way’s supermassive black hole. [EHT Collaboration; CC BY 4.0]

3. First Image of the Milky Way’s Supermassive Black Hole

In 2019, the planet-wide Event Horizon Telescope delivered the first-ever image of a galaxy’s central supermassive black hole, and this year, we got a similar view of our nearest and dearest supermassive black hole: Sagittarius A*. The images showed a bright ring of emission corresponding to extremely hot gas orbiting close to the black hole, as well as a dark shadow inside the ring that contains the black hole’s event horizon. These images provided another test of Einstein’s general theory of relativity, which passed with flying colors yet again.

2. Solving a Fifty-Year Star-Formation Mystery

photograph of the lupus 3 star-forming region

Lupus 3, a star forming region about 600 light-years away. [ESO/R. Colombari; CC BY 4.0]

Models and observations have disagreed on the Milky Way’s star formation rate for decades, with models suggesting that our galaxy should be forming stars faster than it is. Neal Evans and collaborators suggested that the mismatch can be resolved by reassessing two of the most important factors that determine the star formation rate: the masses of the Milky Way’s molecular gas clouds and how efficiently they form stars. In particular, accounting for the impact of metallicity — the abundance of elements heavier than helium — in molecular clouds might bring this long-standing mystery to a close.

simulation of matter spiraling around a pair of black holes

Simulation of matter spiraling around a pair of supermassive black holes. [Adapted from Gutiérrez et al. 2022]

1. Bringing Supermassive Black Hole Mergers to Light

Unsurprisingly, the most-read article of 2022 is about a frequent favorite of astronomers and astronomy enthusiasts alike: black holes! A team led by Eduardo Gutiérrez used simulations to probe the electromagnetic radiation generated when supermassive black holes collide and merge. The team’s results may provide a way to distinguish binary supermassive black holes approaching a merger from single supermassive black holes, hopefully letting us catch them colliding for the first time.

Thank you for joining us for another year of great science — we can’t wait to see the discoveries that 2023 will bring!

photograph of a telescope's field of view with numerous bright satellite trails cutting across the image

Editor’s Note: In these last two weeks of 2022, we’ll be looking at a few selections that we haven’t yet discussed on AAS Nova from among the most-downloaded articles published in AAS journals this year. The usual posting schedule will resume in January.

Impact of the SpaceX Starlink Satellites on the Zwicky Transient Facility Survey Observations

number of images containing satellite tracks and the cumulative number of satellites over time

Number of Zwicky Transient Facility images containing Starlink satellite tracks (blue bars) and the cumulative number of satellites (red line) as a function of time. [Mróz et al. 2022]

Published January 2022

Main takeaway:

Przemek Mróz (University of Warsaw, Poland) and collaborators counted how many images from the Zwicky Transient Facility, which operates a telescope that scans the entire northern sky every two days, contain streaks from Starlink satellites passing through the field of view. The percentage of satellite-streaked images increased by a factor of nearly 36 in less than two years, highlighting the growing presence of satellite constellations and their potential impact on ground-based astronomy.

Why it’s interesting:

The number of Earth-orbiting satellites has increased dramatically in the past few decades and is expected to continue increasing. Though each satellite track obscures a small fraction of a telescope’s field of view — Mróz’s team calculated that a single track covers just 0.04% of the Zwicky Transient Facility’s detector — the chances of a passing satellite marring an astronomical image will increase as the number of satellites skyrockets.

Prospects for future satellites, and what this means for observations going forward:

Much of the recent growth in the satellite population has been driven by the addition of thousands of SpaceX Starlink satellites, which aim to provide internet access for remote or rural areas; as of this writing, there are more than 3,300 Starlink satellites in orbit. This is a small fraction of the nearly 20,000 Starlink satellites that have already been approved, with further additions to the Starlink family already planned. Mróz and collaborators found that Starlink satellites have yet to dramatically affect observations by the Zwicky Transient Facility, partially due to image processing techniques that remove the satellite trails, but other observatories may suffer more negative impacts due to the specifics of their detectors. Though efforts to dull the shine of Starlink satellites have dimmed the satellites by a factor of 4.6, they are still brighter than was recommended in the first Satellite Constellations workshop report.

Citation

Przemek Mróz et al 2022 ApJL 924 L30. doi:10.3847/2041-8213/ac470a

1 38 39 40 41 42 122