Discovery of Methanol in a Planetary Birthplace
Data from the Atacama Large Millimeter/submillimeter Array (ALMA) has recently revealed the first detection of gas-phase methanol, a derivative of methane, in a protoplanetary disk. This milestone discovery is an important step in understanding the conditions for planet formation that can lead to life-supporting planets like Earth.
Planetary Chemistry
One major goal in the study of exoplanets is to find planets that orbit in their host stars’ habitable zones, a measure that determines whether the planet receives the right amount of sunlight to support liquid water. But there’s another crucial element in the formation of a life-supporting planet: chemistry.
To understand the chemistry of newly born planets, we need to study protoplanetary disks — because it’s from these that young planets form. The elements and molecules contained in these dusty disks are what initially make up the atmospheres of planets forming within the disks.

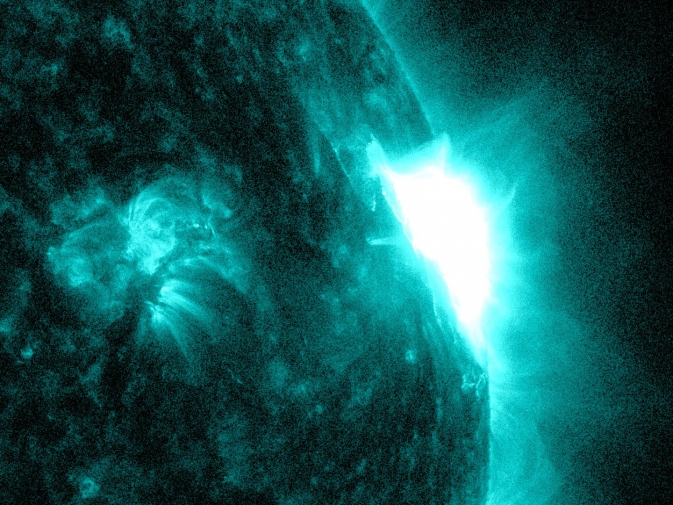
The Atacama Large Millimeter/submillimeter Array under the southern sky. [ESO/B. Tafreshi]
The Hunt for Complexity
The detection of complex molecules in protoplanetary disks is an important milestone, because complex molecules are necessary to build the correct chemistry to support life. Unfortunately, detecting these molecules is very difficult, requiring observations with both high spatial resolution and high sensitivity. Thus far, though we’ve observed elements and simple molecules in protoplanetary disks, detections of complex molecules have been elusive — with only one success before now.
Luckily, we now have an observatory up to the challenge! ALMA’s unprecedented spatial resolution and sensitivity has recently allowed a team of scientists led by Catherine Walsh (Leiden University) to observe gas-phase methanol in a protoplanetary disk for the first time. This detection was made in the disk around the young star TW Hya, and it represents one of the largest molecules that has ever been observed in a disk to date.
Locating Ices
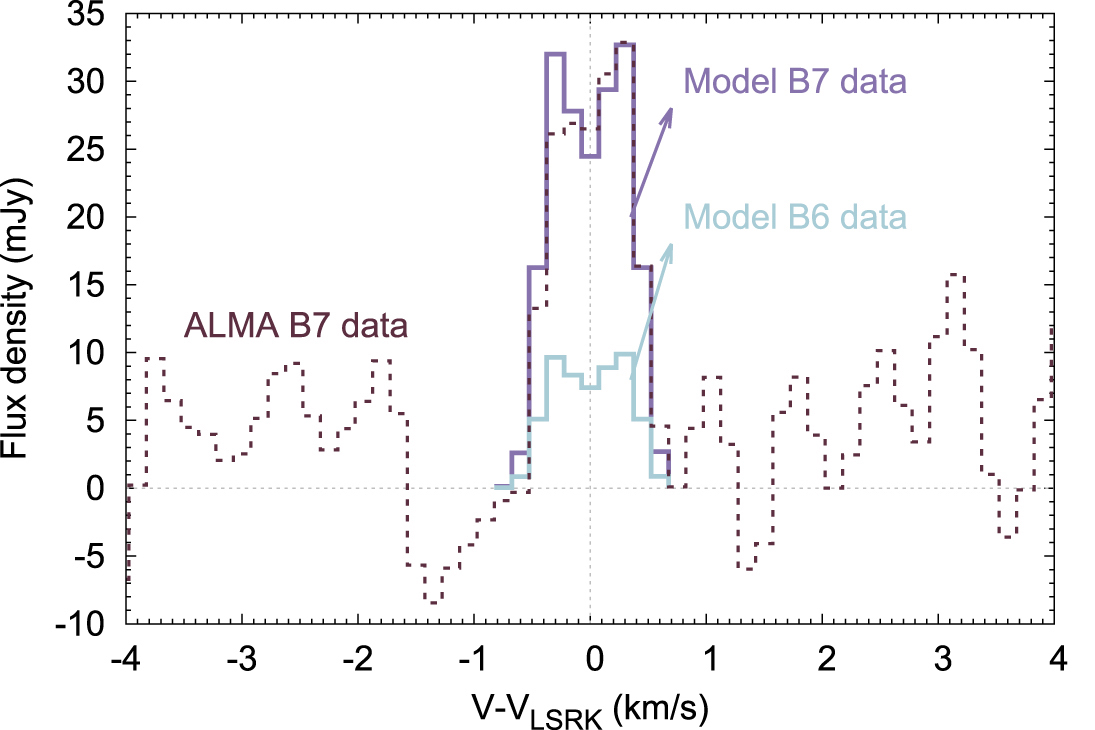
The model (purple line) and data (dashed line) showing the methanol line detection. [Adapted from Walsh et al. 2016]
Walsh and collaborator’s important detection opens a window into studying complex organic chemistry during planetary system formation. This stepping stone can help us to better understand the conditions when Earth formed and what we should look for in the search for life-supporting planets.
Citation
Catherine Walsh et al 2016 ApJ 823 L10. doi:10.3847/2041-8205/823/1/L10


![A breakdown of the catalog of Kepler Objects of Interest (click for a closer look!). Just over half had previously been identified as false positives or confirmed as candidates. 1284 are newly validated, and another 455 have FPP between 10 and 90%. [Morton et al. 2016]](https://aasnova.org/wp-content/uploads/2016/05/fig33.jpg)


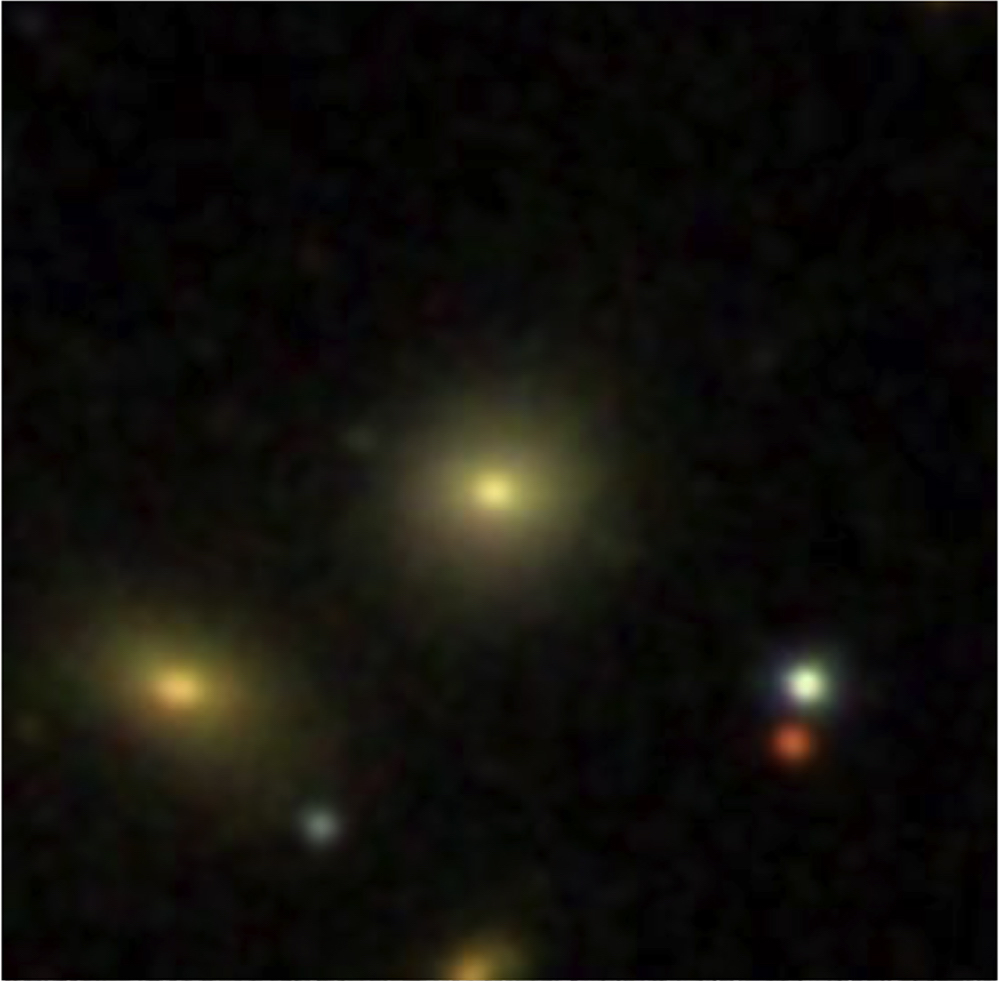


![This enlarged view of NGC 1399 and 1387 in the g band (top) and g–i band (bottom) gives a better view of the faint stellar stream connecting the two galaxies. [Iodice et al. 2016]](https://aasnova.org/wp-content/uploads/2016/04/fig33.jpg)