X-Ray Beasts and Magnetic Fields
Editor’s note: Astrobites is a graduate-student-run organization that digests astrophysical literature for undergraduate students. As part of the new partnership between the AAS and astrobites, we will be reposting astrobites content here at AAS Nova once a week. We hope you enjoy this post from astrobites; the original can be viewed at astrobites.org!
Title: Revisiting the structure and spectrum of the magnetic-reconnection-heated corona in luminous AGNs
Authors: J.Y. Liu, E.L Qiao, and B.F. Liu
First Author’s Institutions: National Astronomical Observatories, Chinese Academy of Sciences
Status: Accepted to ApJ
Deep in the fathomless centers of galaxies, there lurk fantastic beasts of incredible energy and power. Legend has it that our ancestors have long since been aware of their presence (e.g. Carl Seyfert in 1943 and Maarten Schmidt in 1963), but separated by our great divide and limited by our technologies, little has been known about them. Appearing in various shapes and sizes, some beasts have been spotted to spurt out jets, while others appear more docile. How to find these fantastic beasts, you ask? Well, most give away their presence in the optical and UV, while others show up in the radio. These shape shifters are unified by one thing: the source of their power through the accretion of matter onto supermassive black holes. Astronomers call them active galactic nuclei, or AGNs (shhh, here is a secret guide on their different shape-shifting abilities).
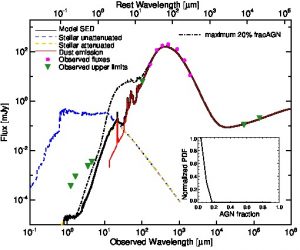
Although AGNs are predominantly discovered in the optical/UV and radio, they actually emit all the way up to X-rays, which is true with most highly energetic astrophysical phenomena. Their spectral energy distributions (SEDs; an example is shown in the figure below), are characterized by different components that arise from different parts of their structures. First, we have a blackbody-like bump — the “big blue bump” — in the optical and UV, which is thought to originate from their accretion disks. The big blue bump is well-fit by the standard accretion disk model, which is geometrically thin and opaque to radiation (“optically thick”). Then, we have some emission in soft X-ray (< 5 keV) whose origin is still unclear. Finally, we have hard X-ray emission (> 5 keV) well-described by a power law. The origin of the hard X-ray emission is not completely solved, but astronomers believe that the up-scattering, or inverse Compton scattering, of accretion disk photons by plasma of hot electrons in a corona surrounding the disk produces these hard X-ray emissions.
An example spectral energy distribution (SED) of an AGN. [Elvis et al. 1994]
The authors encapsulate the effect of magnetic field in their model in a parameter they call the magnetic parameter β0 = (Pgas + Prad)/PB, where magnetic pressure is assumed to be proportional to the sum of the gas pressure and radiation pressure in the disk. Larger β0 corresponds to weaker magnetic field strength and vice versa. By tuning β0 and the accretion rate, the authors solve for the disk structure and derive the emergent SED. The figure below shows the simulated SEDs for different β0 and accretion rates. When β0 is small, strong magnetic fields are produced, which gives rise to similar-looking spectra regardless of accretion rates. As the magnetic field gets weaker (going down the panel), the model with higher accretion rate (dashed line) produces less and less hard X-ray emission. Eventually, the spectrum is dominated by the disk’s “big blue bump”. This agrees with observational trend that hard X-ray spectra of luminous AGNs become softer at higher accretion rates.
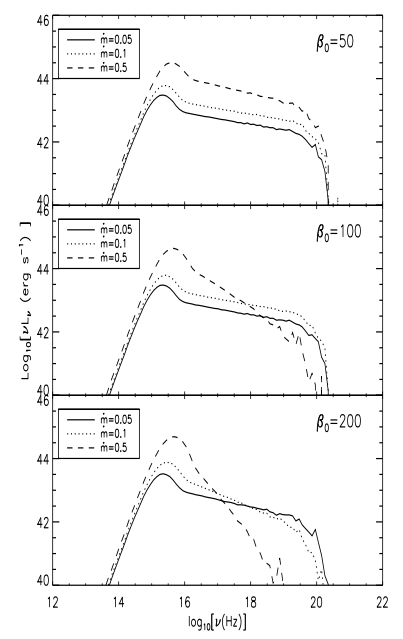
Simulated SEDs of AGN at various β0 (different panels) and accretion rates (different lines). [Liu et al. 2016]
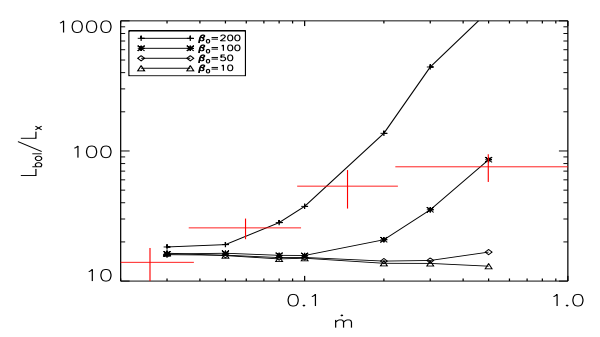
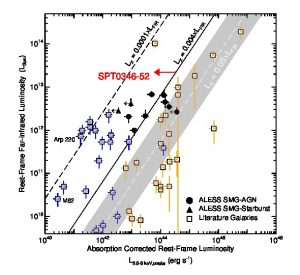
Lbol/Lx as a function of accretion rate for various β0, overlaid with observational data (red crosses). The β0 = 100 and 200 lines agree with the data while the β0 = 10 and 50 lines do not. [Liu et al. 2016]
About the author, Suk Sien Tie:
I am a third year PhD student at the Department of Astronomy at The Ohio State University. I am currently working on quantitative analyses of various quasar selection methods using the Dark Energy Survey (DES) and quasar variability via microlensing.


![Blue stragglers in the open star cluster NGC 3766. [ESO]](https://aasnova.org/wp-content/uploads/2016/11/6a00d8341bf7f753ef01bb089b56c6970d-800wi.jpg)


![Artist's illustration of a binary system in which the left star is exploding as a supernova. [ESA/Justyn R. Maund (University of Cambridge)]](https://aasnova.org/wp-content/uploads/2016/10/607582main_hubble_supernove_full.jpg)
")