
Editor’s note: Astrobites is a graduate-student-run organization that digests astrophysical literature for undergraduate students. As part of the new partnership between the AAS and astrobites, we will be reposting astrobites content here at AAS Nova once a week. We hope you enjoy this post from astrobites; the original can be viewed at astrobites.org!
Title: Formation and Evolution of Blue Stragglers in 47 Tucanae
Authors: J. Parada, H. Richer, J. Heyl, J. Kalirai, R. Goldsbury
First Author’s Institution: Department of Physics & Astronomy, University of British Columbia, Canada
Status: Published in ApJ
Just by looking at a star’s colour, astronomers can learn a few things about its properties. The most direct one is its temperature: red stars like Betelgeuse are cool, blue stars like Rigel are hot. Another property we can estimate by eye is the apparent magnitude, a concept idealised by the Greek Hipparchus almost 2000 years ago. He ranked stars from brightest to faintest in a scale of one to six, one denoting the twenty brightest stars he could see, and six denoting those he could barely spot with the naked eye. This scheme was adapted into a logarithmic scale by N. R. Pogson in 1856, and is still in use nowadays. The apparent magnitude depends on the star’s luminosity and distance, so if we know the latter, we can estimate the former using the measured magnitude. Knowing the luminosity and the temperature we’ve estimated from the star’s colour, we can place it in a Hertzprung-Russell (HR) diagram and infer other properties, like evolutionary stage, mass, and radius. Unfortunately, distance is a very hard thing to measure accurately in astronomy. However, there’s a way to overcome that: studying stars in clusters. In a star cluster, all stars are basically at the same distance from us, so we can ignore the effect of the distance and compare the apparent magnitude of these stars directly. We can then build a colour-magnitude diagram (CMD), the observational version of the HR diagram. Lots of our knowledge about stellar evolution came from comparing theoretical evolutionary models to this kind of diagram.
![Blue stragglers in the open star cluster NGC 3766. [ESO]](https://aasnova.org/wp-content/uploads/2016/11/6a00d8341bf7f753ef01bb089b56c6970d-800wi.jpg)
Blue stragglers in the open star cluster NGC 3766. [ESO]
Blue stragglers: what we know so far
Combining theory and observations: what 47 Tucanae can teach us
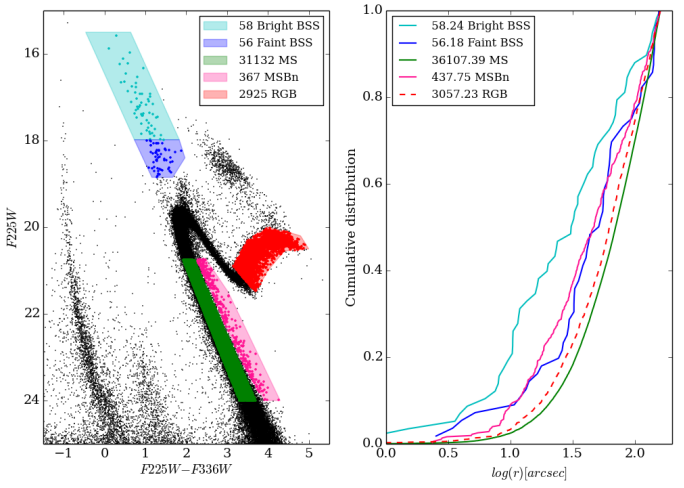
Figure 1: The left panel shows a CMD using Hubble’s filters F255W and F336W. The stellar populations identified are indicated. On the right panel, the cumulative distribution for each population is shown. The numbers of stars in each panel are slightly different because a completeness correction was done on the right panel, taking into account stars that aren’t detected because of limitations in the method.
Next the authors relied on evolutionary models calculated with the code MESA (Modules for Experiments in Stellar Astrophysics) to identify the region occupied by evolved blue straggler stars (see Fig. 2). Calculating the cumulative radial distribution, they noted that what they call evolved blue stragglers (eBSS) follow a similar distribution to the blue stragglers, suggesting they are indeed linked. Moreover, they found an excess of stars in the RGB and the horizontal branch (HB) when compared to the expected number considering only single evolution. According to their estimates, this excess can be explained by stars evolving from blue stragglers into these regions. So it appears that the blue stragglers have a post-MS evolution comparable to that of a normal star of the same mass. There’s still some disagreement between the lifetimes the authors estimated and others found in the literature, indicating a more detailed study of individual blue straggler properties is in order to better constrain these values. Future studies using high quality spectra may help with that.
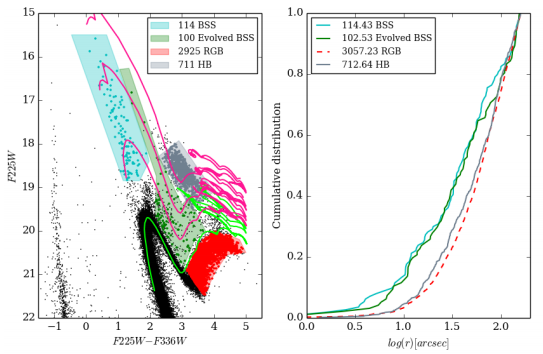
Figure 2: The left panel shows again the cluster’s CMD, now with some MESA models overplotted. The sequences have initial masses of f 0.9, 1.1, 1.4, and 1.8 solar masses, from bottom to top. The right panel shows the cumulative distribution for the samples selected on the right panel. There’s again a completeness correction that makes the number of stars slightly different in the plots.
In short, the authors verified that different mechanisms leading to blue stragglers can in fact be identified within a cluster. Interactions in multiple systems seem to dominate in the central regions, while binary evolution seems to be the dominant mechanism in the cluster outskirts. The former leads to more massive, brighter objects, while fainter blue stragglers are explained by the latter. The evolution of the blue stragglers seems to be similar to simple MS stars with same mass, which makes it easier to model their evolution. However, this still has some discrepancies with other results, so more detailed studies, focused on individual objects, are needed. The blue stragglers have not shown all their true colours yet.
About the author, Ingrid Pelisoli:
I am a second year PhD student at Universidade Federal do Rio Grande do Sul, in Brazil. I study white dwarf stars and (try to) use what we learn about them to understand more about the structure and evolution of our Galaxy. When I am not sciencing, I like to binge-watch sci-fi and fantasy series, eat pizza, and drink beer.
1 Comment
Pingback:what color is a blue straggler in 47 Tucanae?