
Editor’s note: Astrobites is a graduate-student-run organization that digests astrophysical literature for undergraduate students. As part of the new partnership between the AAS and astrobites, we will be reposting astrobites content here at AAS Nova once a week. We hope you enjoy this post from astrobites; the original can be viewed at astrobites.org!
Title: The Mount Wilson Observatory S-index of the Sun
Authors: Ricky Egeland, Willie Soon, Sallie Baliunas, Jeffrey C. Hall, Alexei A. Pevtsov, and Luca Bertello
First Author’s Institutions: High Altitude Observatory; Montana State University
Status: Accepted to ApJ
One of the few certainties that we have as humans is that the Sun always comes and goes, always in intervals of 24 hours, and will continue to do so for the next 5 billion years or so. Owing to this familiar cycle, we sometimes take for granted that our host star is not itself completely stable. It is active, and this activity shapes the evolution the solar system and life on Earth. Because we use the Sun as a reference for other stars, it is thus crucial that we measure its activity as accurately and precisely as possible.
Blame Magnetic Fields
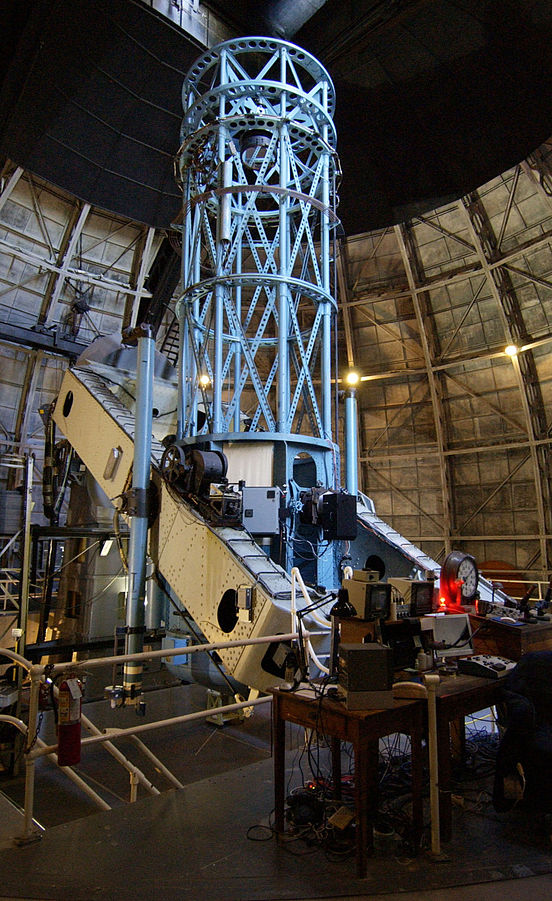
Mount Wilson Observatory’s 100-inch telescope is one of the telescopes that was used to make solar observations for the HK project. [Ken Spencer]
Context Is Key
In order to understand the role of activity in the physics of stellar and planetary evolution, it is important to place the Sun, the one star we know best, in the same context as the others. In today’s paper, the authors aim to precisely and accurately measure its activity using spectroscopic observations of the Moon — which reflects sunlight — obtained with the same instrument employed at the MWO.
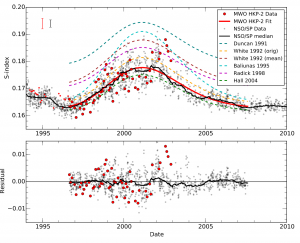
The solar activity during Cycle 23. The MWO data are the red dots, and the red curve is a fit to the data. Most of the activity cycle measured by previous studies (dashed curves) are visibly shifted to higher values. [Egeland et al. 2016]
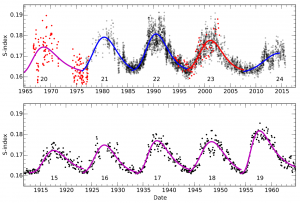
Composite time series of the S-index of the Sun, using various data sets (colored symbols), which are now correctly calibrated. The colored curves are fits to the data. [Egeland et al. 2016]
Effects on Future Studies
So, the Sun is slightly less active than we previously measured, and this impacts our understanding of solar-type stars the most. By correctly placing our star in the context of others, we can better assess how common it is, which helps us answer questions about the conditions necessary for life to emerge and how it evolves along with the star. These results also rectify some inconsistencies previously observed in the activity of solar-type stars, and again reminds us of a critical aspect of science: systematics matter. The article itself will serve as a guide on measuring stellar activity, paving the way towards better practices in the field.
The Sun from September to November 2016. Larger GIF available here.[ESA/NASA/SOHO]
About the author, Leonardo dos Santos:
Leonardo is a graduate student of Astronomy at University of São Paulo, Brazil, and a visiting student at University of Chicago. His current research consists of studying physical and chemical properties of stars similar to the Sun, hunting for exoplanets and software development for astronomical instrumentation. When not sitting in front of a computer, he enjoys doing night sky photography, cooking, riding his mountain bike and failing miserably at pretty much all these tasks.
1 Comment
Pingback:Mount Wilson study of Solar and stellar activity