
Where Should We Look for Life?
The first challenge in the hunt for life elsewhere in our universe is to decide where to look. In a new study, two scientists examine whether Sun-like stars or low-mass M dwarfs are the best bet for hosting exoplanets with detectable life.
Ambiguity of Habitability
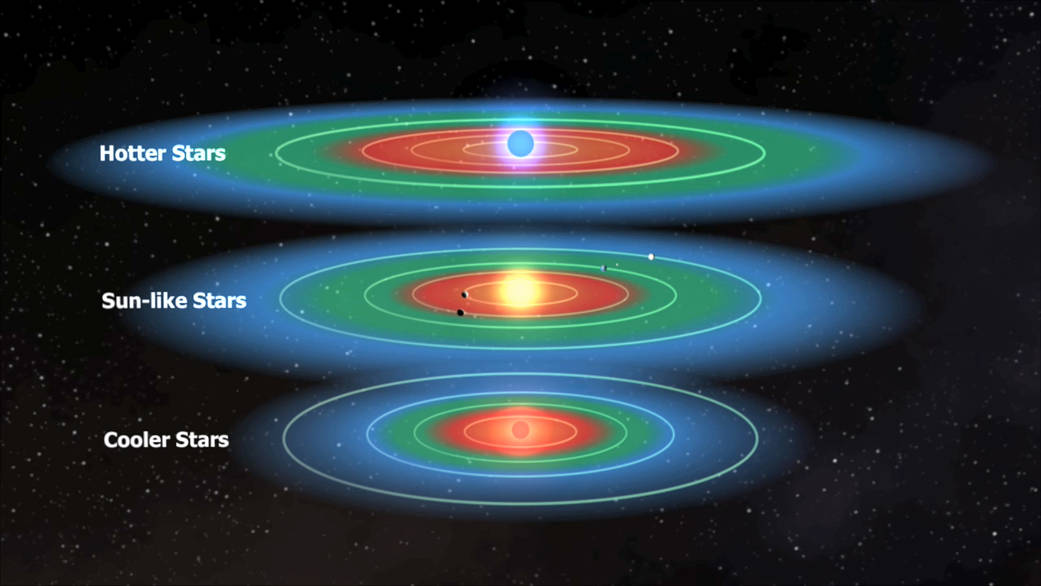
The habitable zones of cool M-dwarf stars lie much closer in than for Sun-like stars, placing habitable-zone planets around M dwarfs at greater risk of being affected by space weather.
Most exoplanet scientists will freely admit frustration with the term “habitability” — it’s a word that has many different meanings and is easily misinterpreted when it appears in news articles. Just because a planet lies in a star’s habitable zone, for instance, doesn’t mean it’s necessarily capable of supporting life.
This ambiguity, argue authors Manasvi Lingam and Abraham Loeb (Harvard University and Harvard-Smithsonian Center for Astrophysics), requires us to take a strategic approach when pursuing the search for primitive life outside of our solar system. In particular, we risk losing the enthusiasm and support of the public (and funding sources!) when we focus on the general search for planets in stellar habitable zones, rather than specifically searching for the planets most likely to have detectable signatures of life.

Illustration of the difference between a Sun-like star and a lower-mass, cooler M-dwarf star. [NASA’s Goddard Space Flight Center/S. Wiessinger]
Weighing Two Targets
So how do we determine where best to look for planets with detectable biosignatures? To figure out which stars make the optimal targets, Lingam and Loeb suggest an approach based on standard cost-benefit analyses common in economics. Here, what’s being balanced is the cost of an exoplanet survey mission against the benefit of different types of stellar targets.
In particular, Lingam and Loeb weigh the benefit of targeting solar-type stars against that of targeting stars of any other mass (such as low-mass M-dwarfs, popular targets of many current exoplanet surveys). The advantage of one type of target over the other depends on two chief factors:
- the probability that the targeted star hosts planets with life, and
- the probability that biosignatures arising from this life are detectable, given our available technology.
Promise of Sun-Like Stars
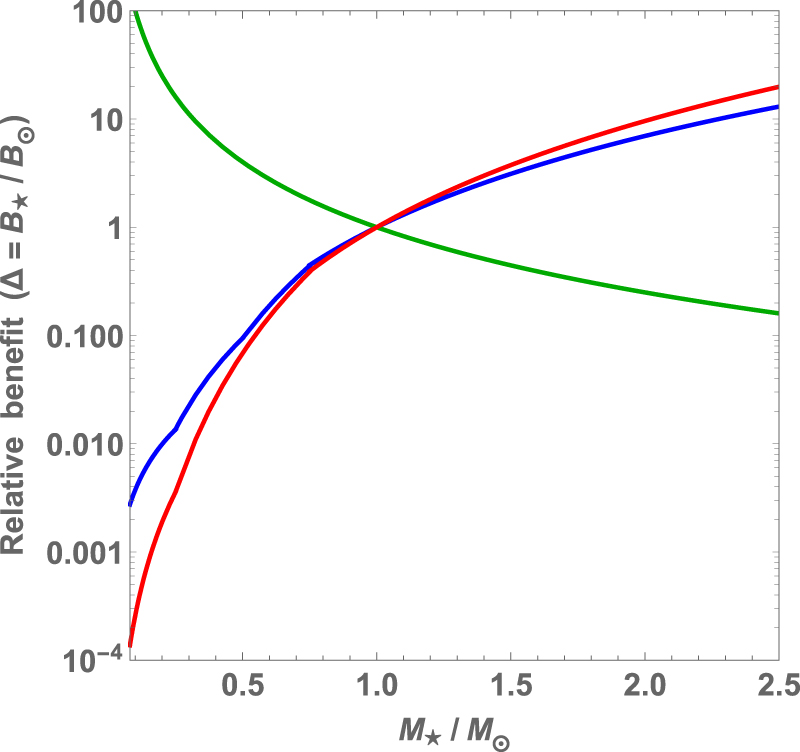
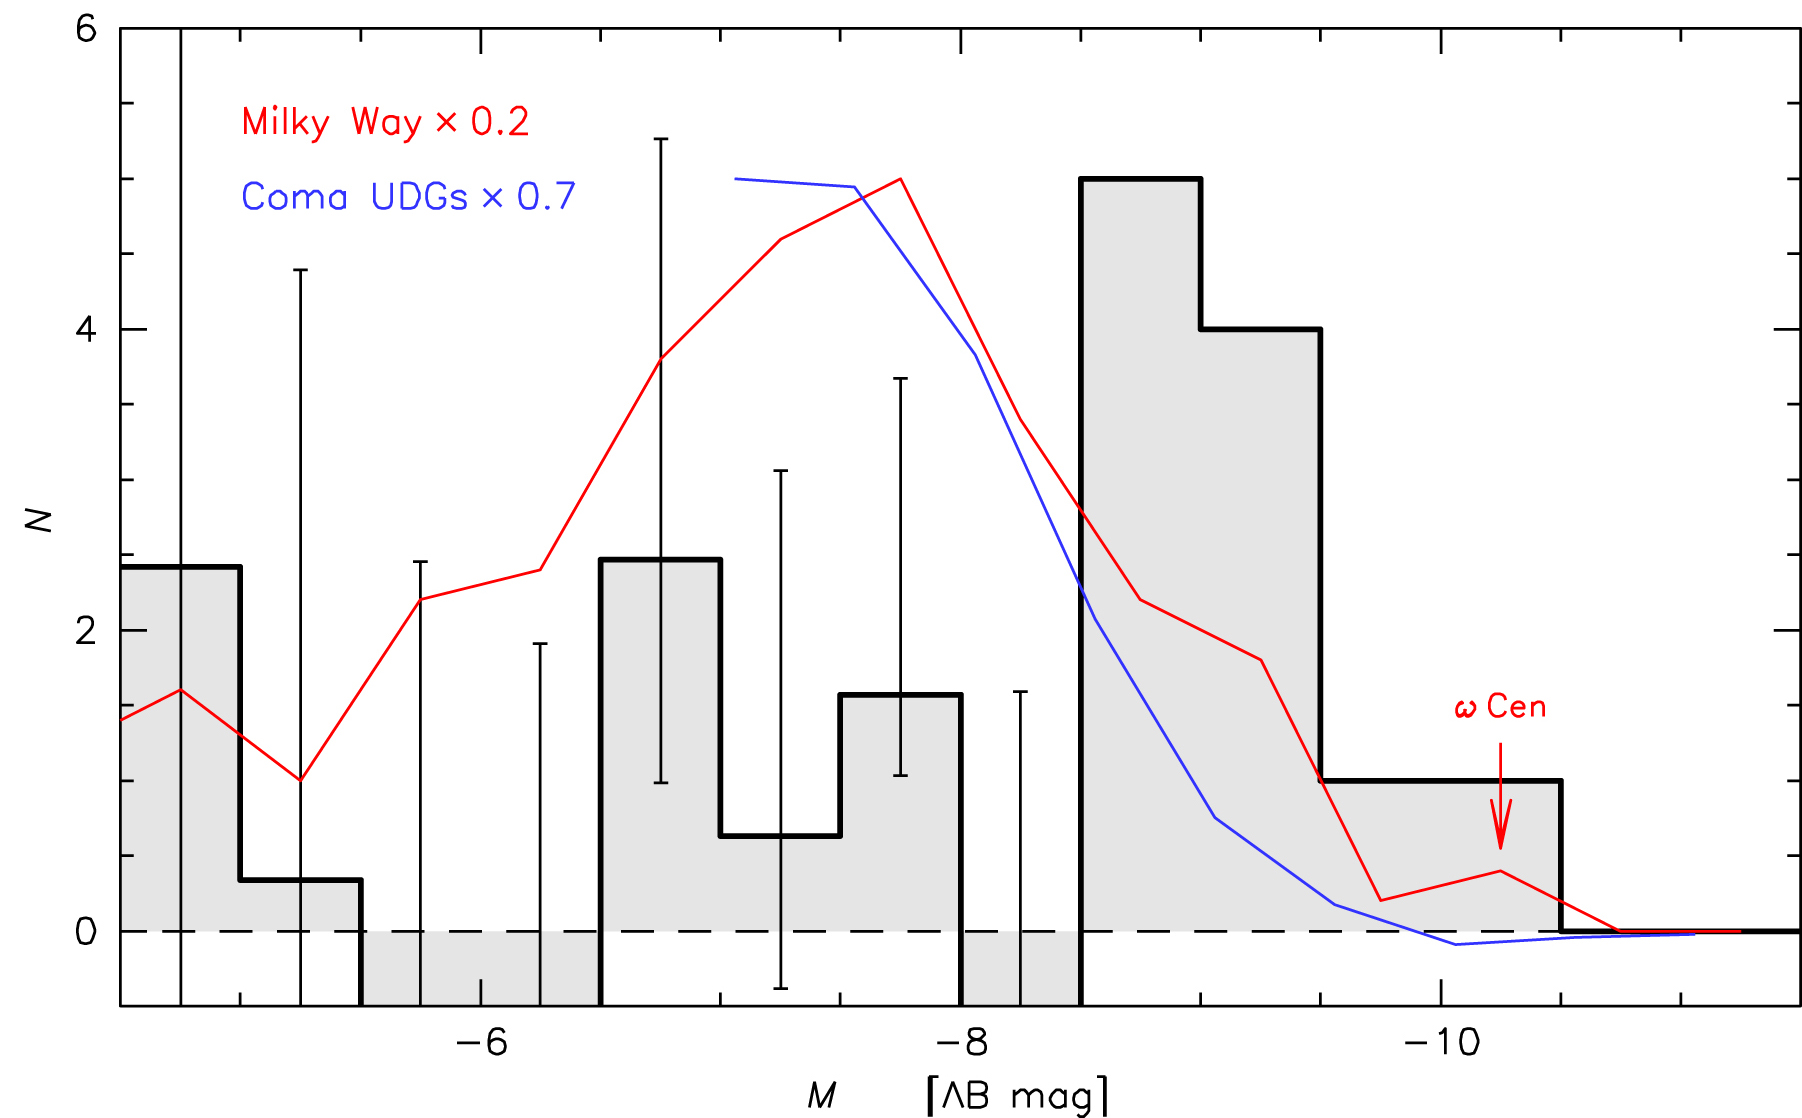
Relative benefit of searching for signatures of life around stars with varying masses, assuming a transmission spectroscopy survey mission; results are similar for a direct-imaging mission. Green curve assumes a flat prior; red and blue curves assume priors in which habitability is suppressed around low-mass stars. [Lingam & Loeb 2018]
- If we assume a flat prior — i.e., that the probability of life is the same for any choice of star — then searching for life around M-dwarfs proves the most advantageous, because the detection of biosignatures becomes much easier.
- If we assume a prior in which habitability is suppressed around low-mass stars, then it is more advantageous to search for life around solar-type stars.
So which of these priors is correct? There is mounting evidence, particularly based on considerations of space weather, that the habitability of Earth-like planets around M dwarfs might be much lower than their counterparts around solar-like stars.
If this turns out to be true, then Lingam and Loeb argue exoplanet survey missions should target Sun-like stars throughout our galaxy for the best chances of efficiently detecting life beyond our solar system.
Citation
Manasvi Lingam and Abraham Loeb 2018 ApJL 857 L17. doi:10.3847/2041-8213/aabd86


![[Sc/Fe] trend](https://aasnova.org/wp-content/uploads/2018/03/Do18Fig4.png)