Selections from 2019: Neutrinos and Gravitational Waves from Cosmic Catastrophes
Editor’s note: In these last two weeks of 2019, we’ll be looking at a few selections that we haven’t yet discussed on AAS Nova from among the most-downloaded papers published in AAS journals this year. The usual posting schedule will resume in January.
Search for Multimessenger Sources of Gravitational Waves and High-energy Neutrinos with Advanced LIGO during Its First Observing Run, ANTARES, and IceCube
Published January 2019
Main takeaway:
No significant detections of high-energy neutrinos and gravitational waves coming from the same astrophysical source were found during the Laser Interferometer Gravitational-Wave Observatory’s (LIGO’s) first observing run. This was established from detailed analysis and comparison of IceCube and Antares neutrino candidates and LIGO gravitational-wave candidates over the ~130-day observing period.
Why it’s interesting:
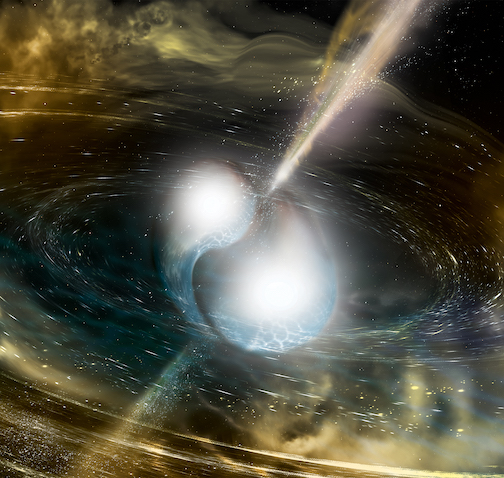
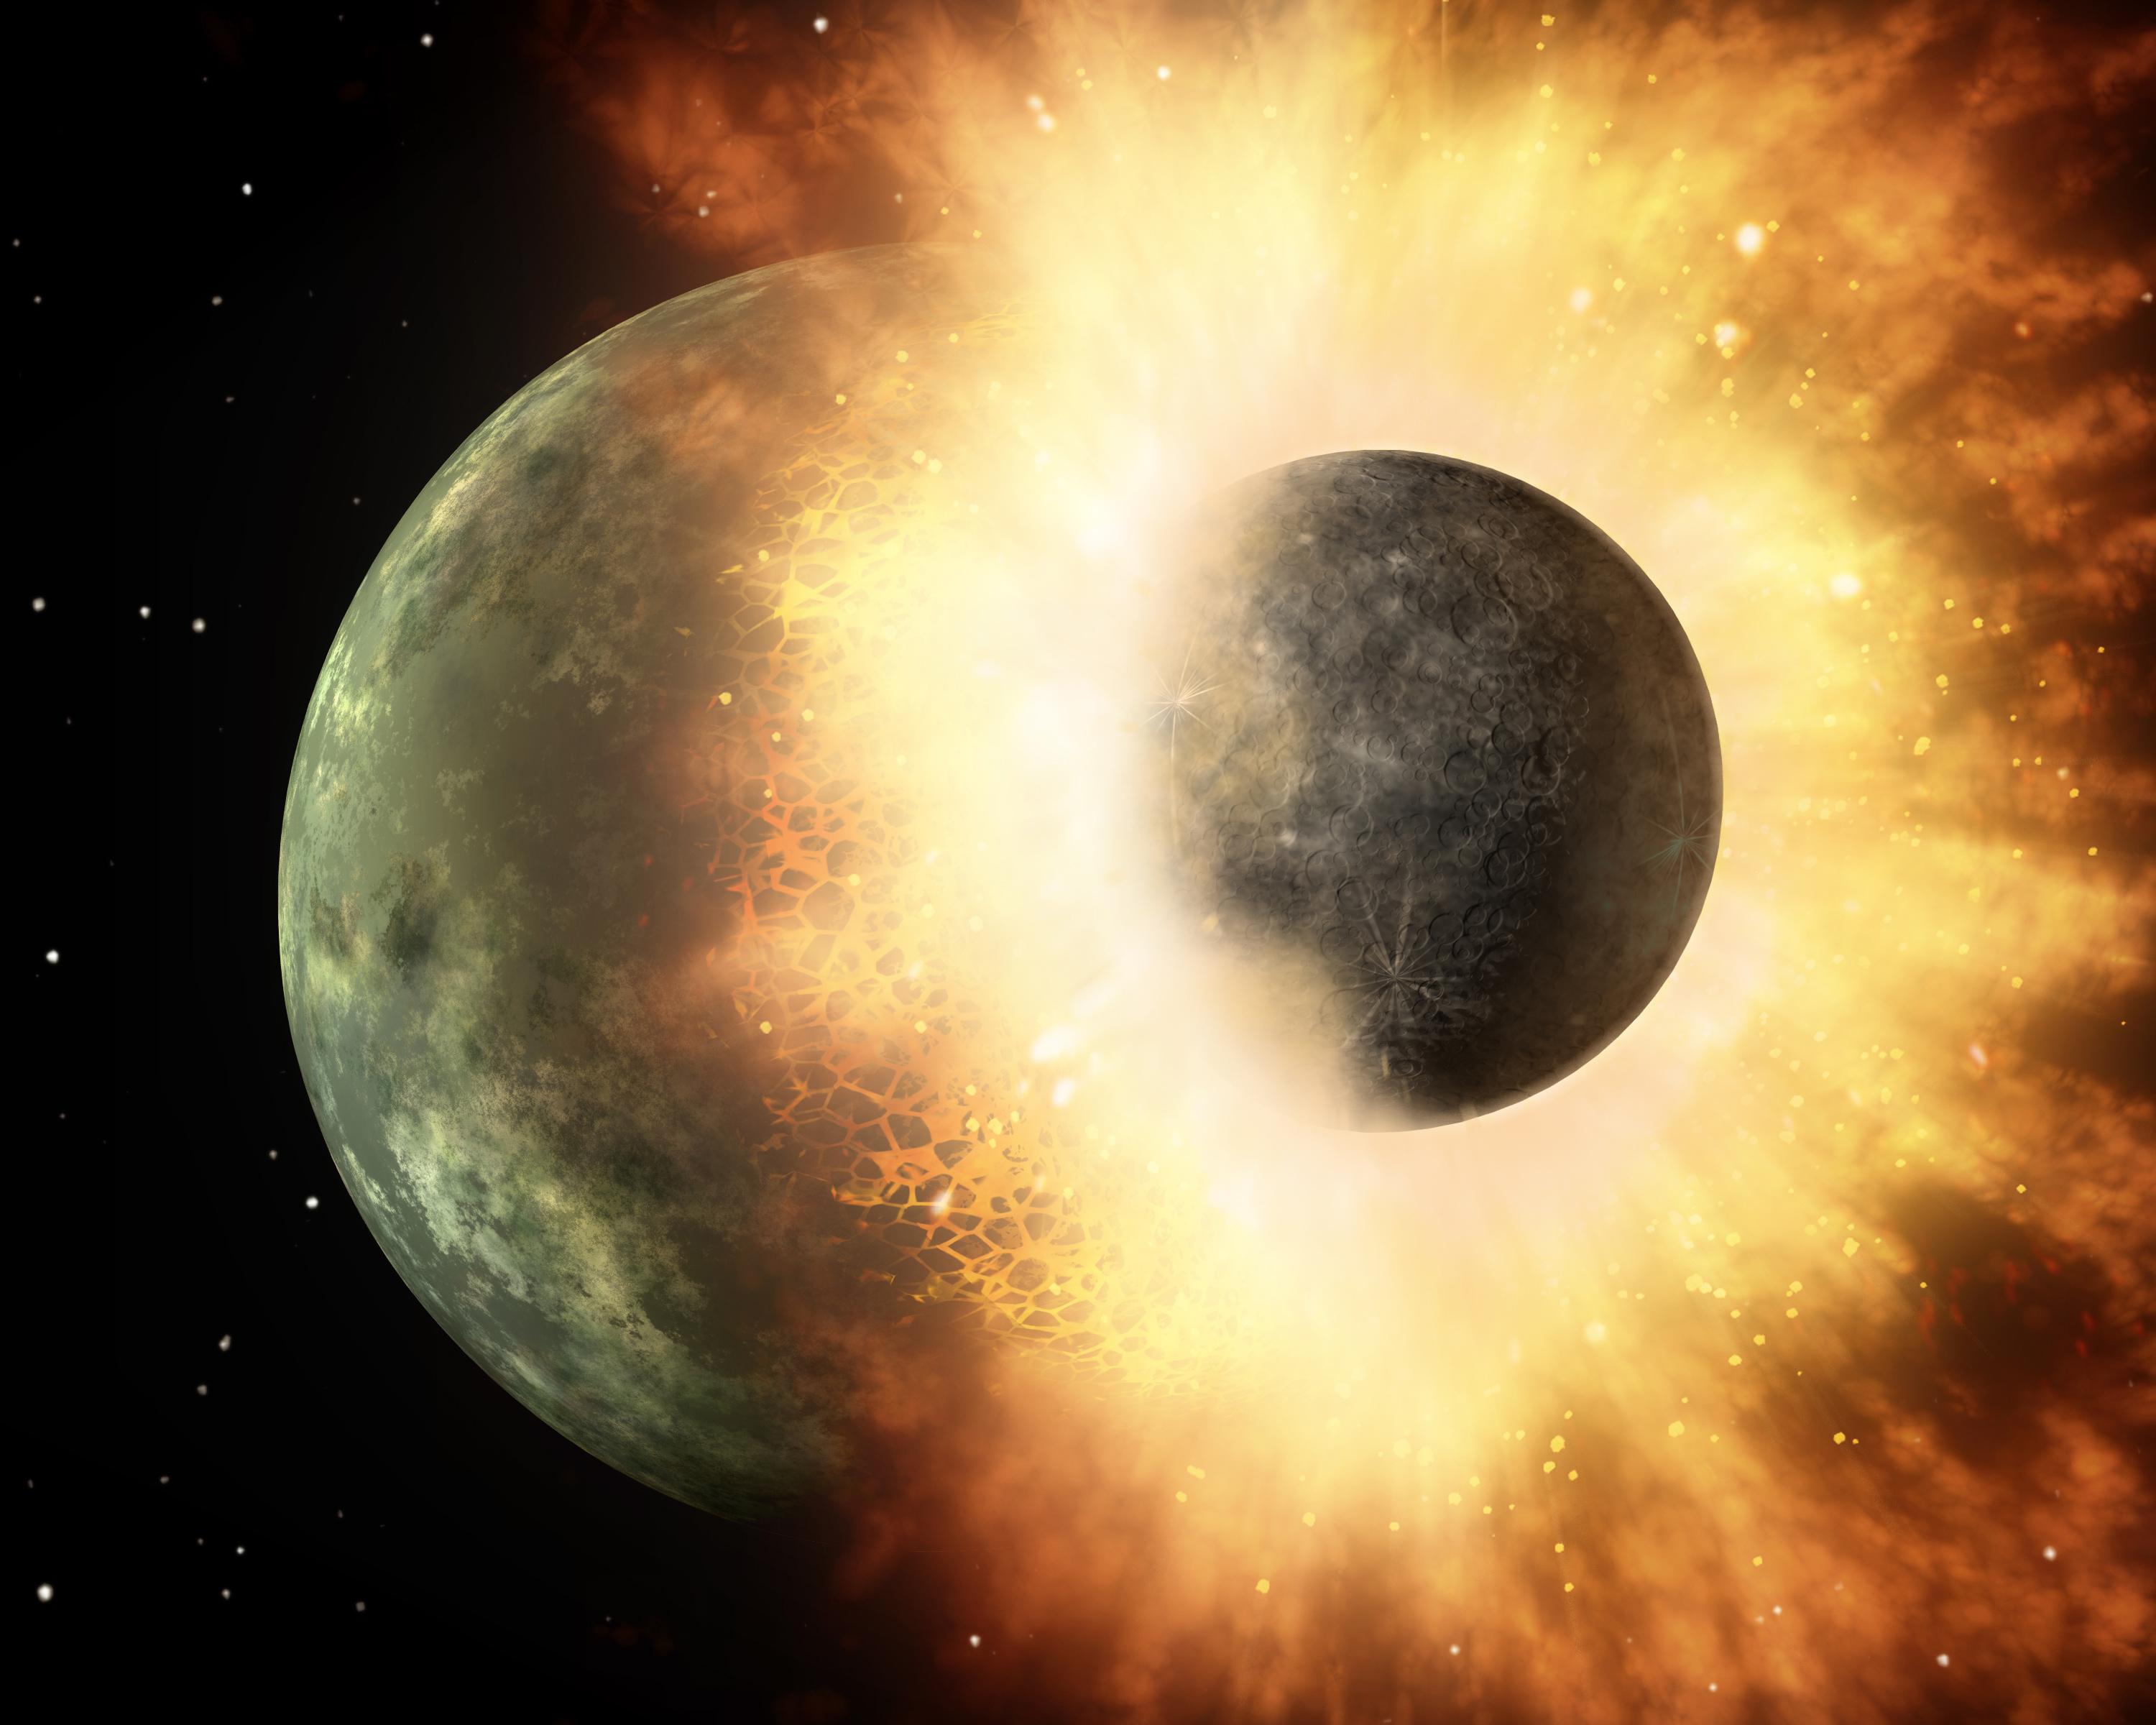
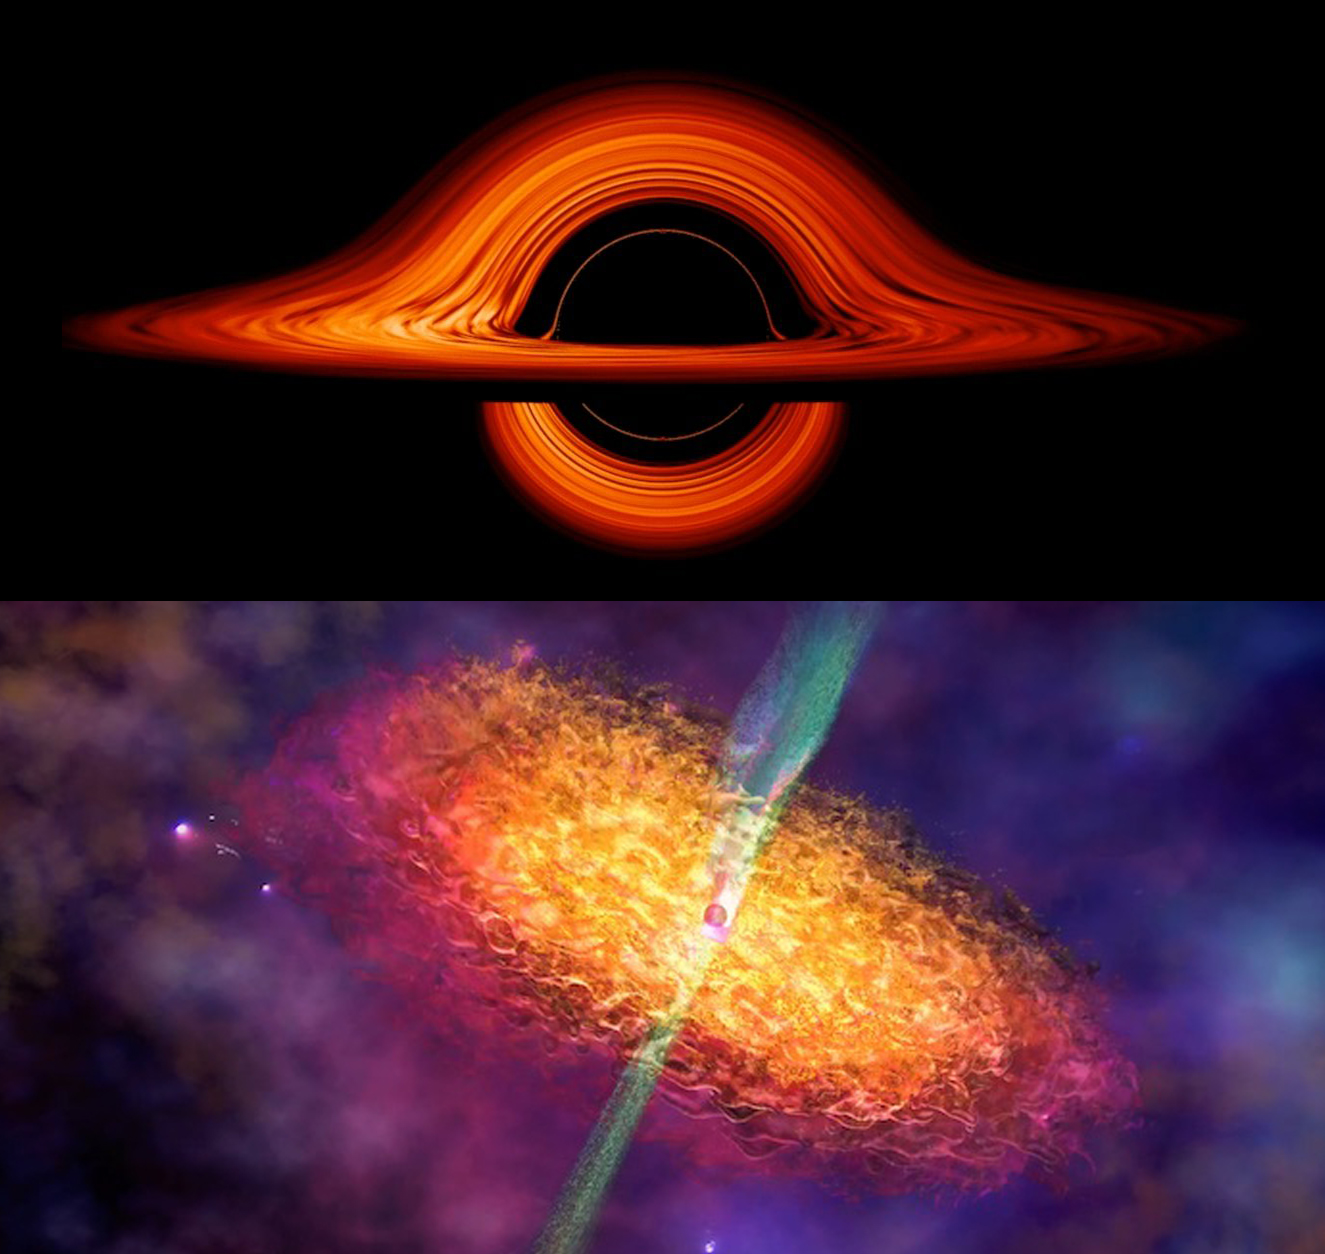
Artist’s impression of two merging neutron stars producing a gamma-ray burst. [National Science Foundation/LIGO/Sonoma State University/A. Simonnet]
Why this is only the start:
IceCube and Antares are already remarkable neutrino detectors located beneath kilometers of ice at the South Pole and water in the Mediterranean Sea, respectively. But the future holds hope for a significant upgrade to IceCube (IceCube-Gen2), work on an expanded neutrino observatory in the Mediterranean Sea is already underway (KM3NeT), and we’re even constructing a neutrino observatory in the deepest lake in the world, Lake Baikal in Russia (Baikal-GVD). Observations from these new detectors, combined with data from the upgraded LIGO/Virgo observatories, should place even further constraints on our understanding of astrophysical neutrino and gravitational-wave sources in the future.
Citation
A. Albert et al 2019 ApJ 870 134. doi:10.3847/1538-4357/aaf21d


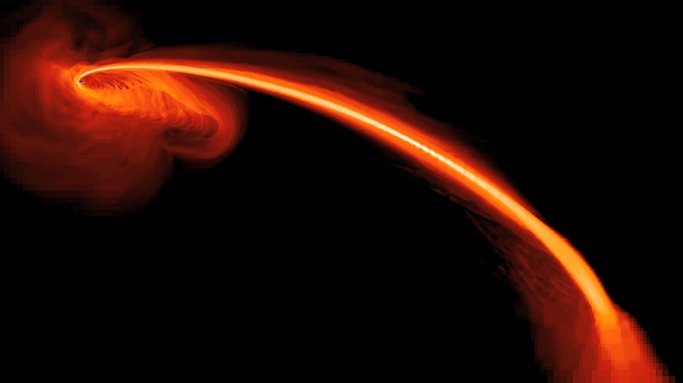
 Destroys a Star")
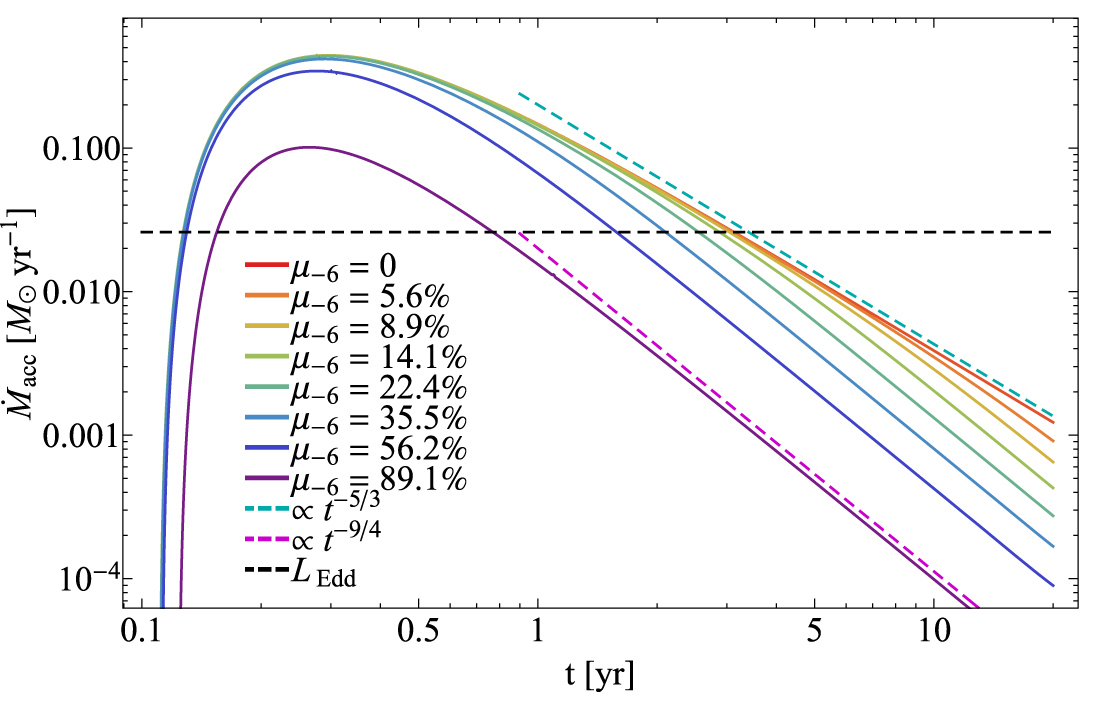


 Flux?")