
Bright eruptions from the Sun’s surface can influence everything from the Sun’s own atmosphere to the Earth and beyond. The good news: we’ve got decades of detailed observations of solar flares available for study. The bad news: we may be interpreting these data incorrectly.
Distributing Flares
The distributions of properties of solar flares is a topic of great interest to solar physicists. Much of our understanding of how the Sun ejects energy into its surroundings depends on the number of flares emitted by the Sun at different energies and durations — but we’re only able to measure the larger, more energetic end of this distribution.
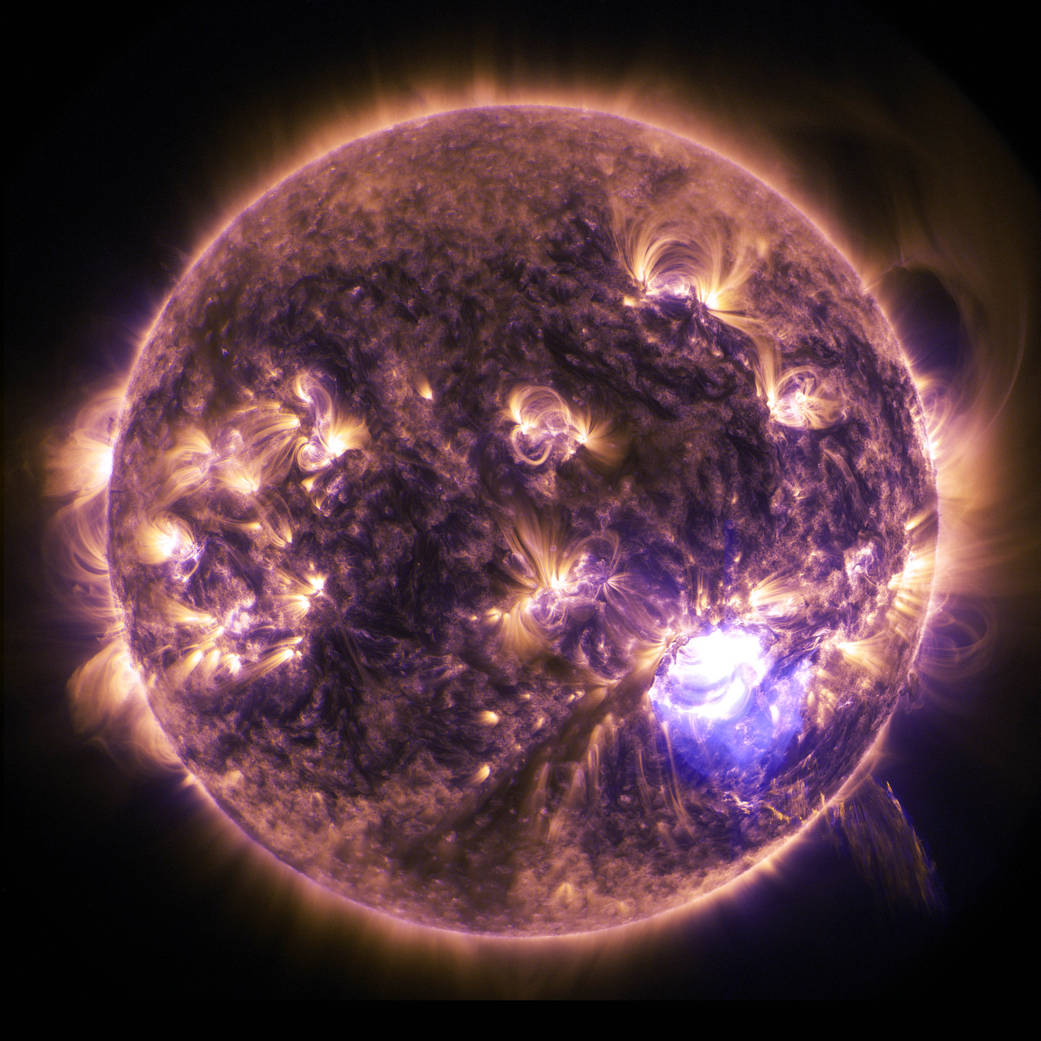
NASA’s Solar Dynamics Observatory captures a solar flare in the act. [NASA/SDO]
But a team of scientists led by Cis Verbeeck (Royal Observatory of Belgium) cautions against this approach. Instead of just measuring the shape of these power-law fits for flares, they say, we first need to ask: is a power law actually the right fit to the data?
To Power Law or Not to Power Law
Power law distributions correctly describe a wide variety of astrophysical data, but Verbeeck and collaborators think we should test this assumption for solar flares. To this end, the team performed a comprehensive study of nearly 7,000 flares detected in Solar Dynamics Observatory AIA 9.4-nm images between May 2010 and March 2018, conducting statistical analyses to determine the best fit to the peak flare flux distribution.
Sure enough, the authors find that once the flare data has been background-subtracted — meaning that only the flares are included, not the non-flaring solar background — the distribution is not well fit by a power law.
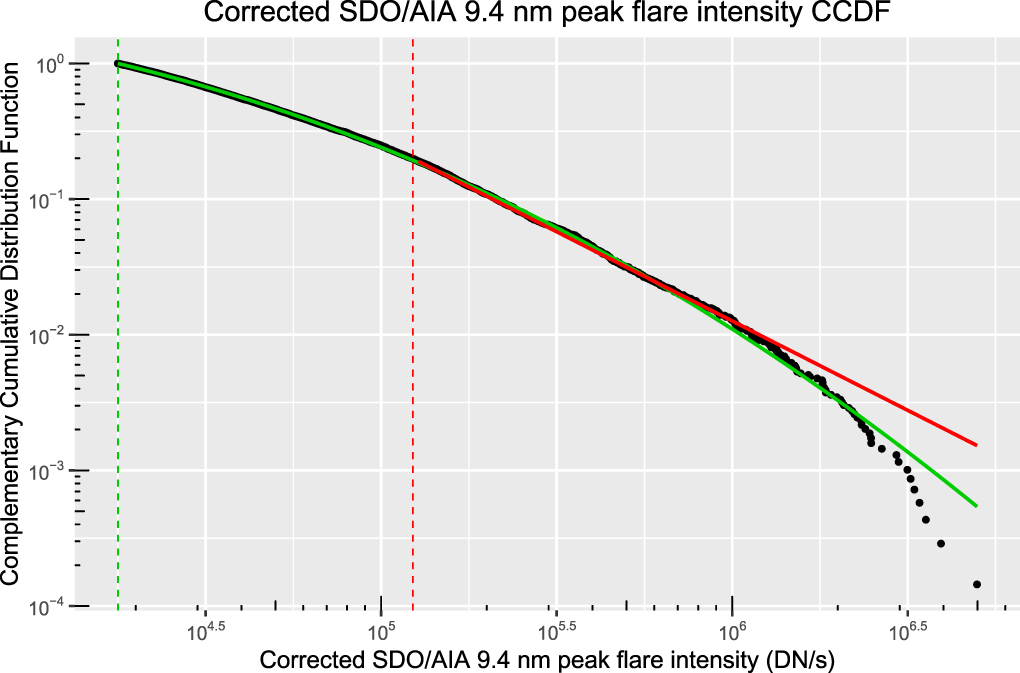
The peak flare intensity distribution is better described by a lognormal fit (green) than by a power law fit (red). Click to enlarge. [Verbeeck et al. 2019]
A Lognormal Outlook
So why have we been using the wrong fit? The authors show that raw flare data that hasn’t been background-subtracted does follow a power-law distribution, so it’s possible that past studies just haven’t correctly isolated the flares from everything in the background that isn’t a flare.
Regardless of the reason, it seems clear from the work in this study that power laws are not the right approach going forward. As we continue to work to understand the flares from our nearest star, a careful treatment of the big picture is needed!
Citation
“Solar Flare Distributions: Lognormal Instead of Power Law?,” Cis Verbeeck et al 2019 ApJ 884 50. doi:10.3847/1538-4357/ab3425