
A Distant Quasar as a Cosmic Clock
Hungry supermassive black holes in the distant cosmos can help us understand what happened shortly after our universe lit up with its first stars and galaxies. New work now probes the most distant supermassive black hole we’ve seen, searching for more clues.
Our Hazy Past
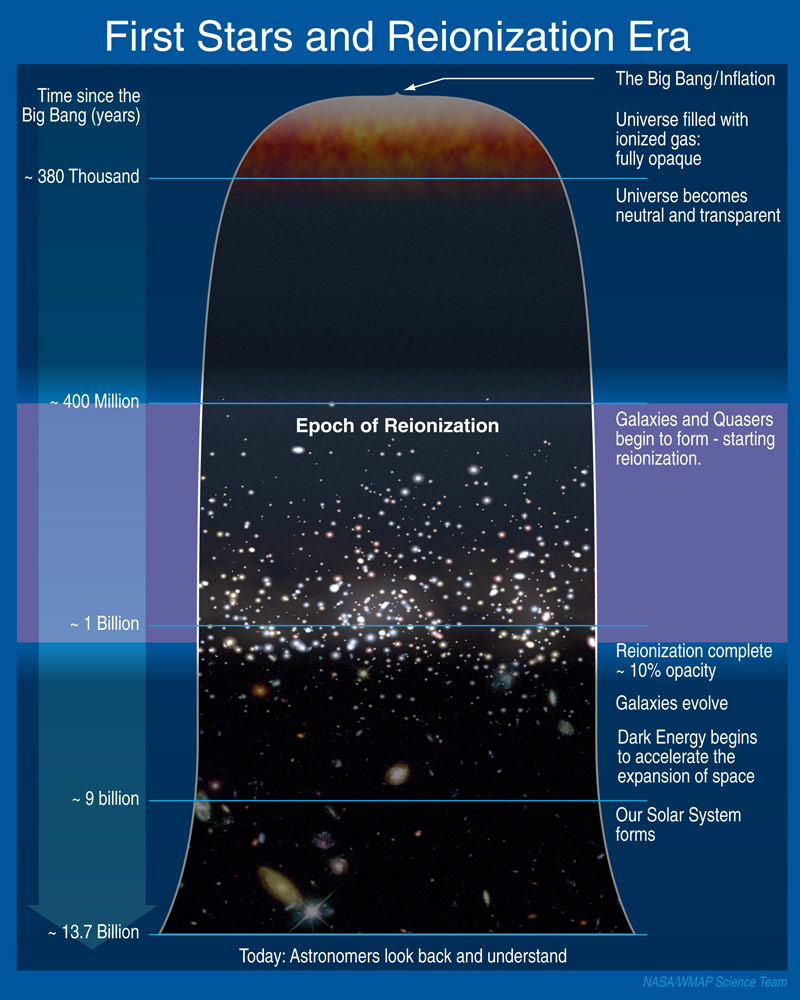
In the schematic timeline of the universe, the epoch of reionization is when the first galaxies and quasars began to form and evolve. Click to enlarge. [NASA]
At some point a few hundred million years after the birth of the universe, the earliest stars began to form, as well as the first large-scale structures like galaxies. Supermassive black holes grew in the centers of those galaxies, and as the black holes accreted mass, they produced powerful radiation, appearing to us now as distant quasars. Within a billion years of the Big Bang, quasars and stars lit the universe and shaped it into its current form.
The details and precise timeline of these critical evolutionary stages, however, remain uncertain.
Let’s Turn Back Time
One way we can further understand this evolution is by using quasars as cosmic clocks. By peering back in time and exploring the earliest known quasars, we learn about the metallicity of gas at the centers of early galaxies — which reveals when this gas first became enriched with the metals formed by early stars.
In a recent study, a team of scientists led by Masafusa Onoue (Max Planck Institute for Astronomy, Germany) has probed this crucial time using one particularly early clock: quasar ULAS J1342+0928.
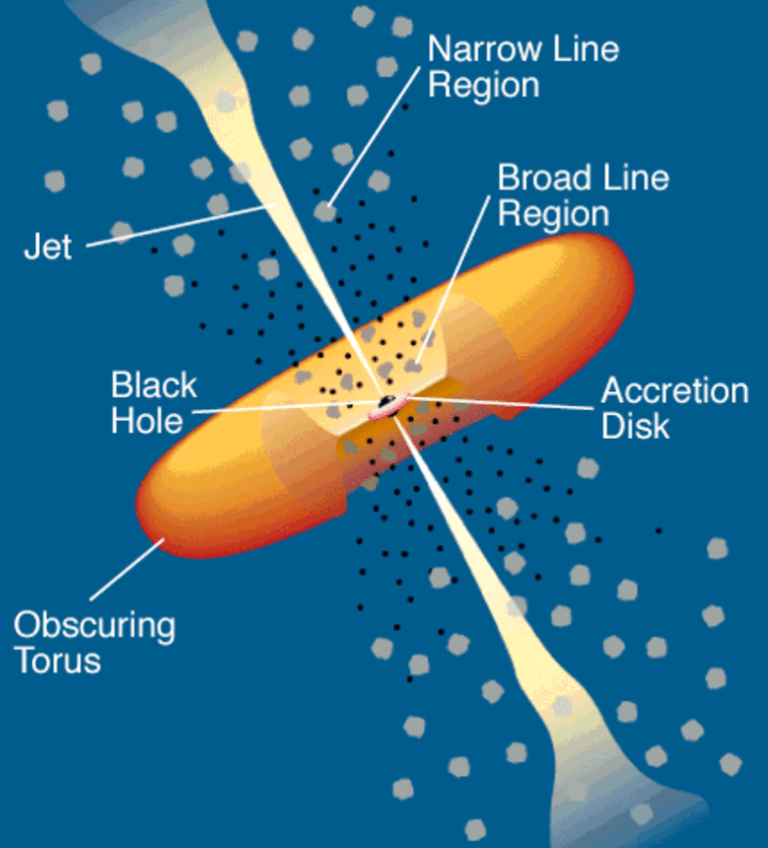
This schematic of a quasar includes the broad line region, orbiting clouds located very close to the central supermassive black hole. [Urry & Padovani 1995]
Peering into a Galaxy’s Center
ULAS J1342+0928 is the most distant, oldest known quasar; it’s located at a redshift of z = 7.54, which corresponds to a time just 680 million years after the Big Bang. Onoue and collaborators obtained deep near-infrared spectra of this distant source using the Gemini North telescope in Hawaii.
By modeling the spectra, Onoue and collaborators were able to measure the ratios of certain emission lines produced within the broad line region (BLR) of the quasar, a region of clouds that orbit very close to the central black hole.
The ratios of these emission lines can serve as a proxy for the clouds’ metallicity. Since this gas is thought to have originated from the interstellar medium of the host galaxy, the metallicity of BLR gas traces the galaxy’s star formation history, telling us when stars formed and enriched this gas with metals.
Early Metal Pollution
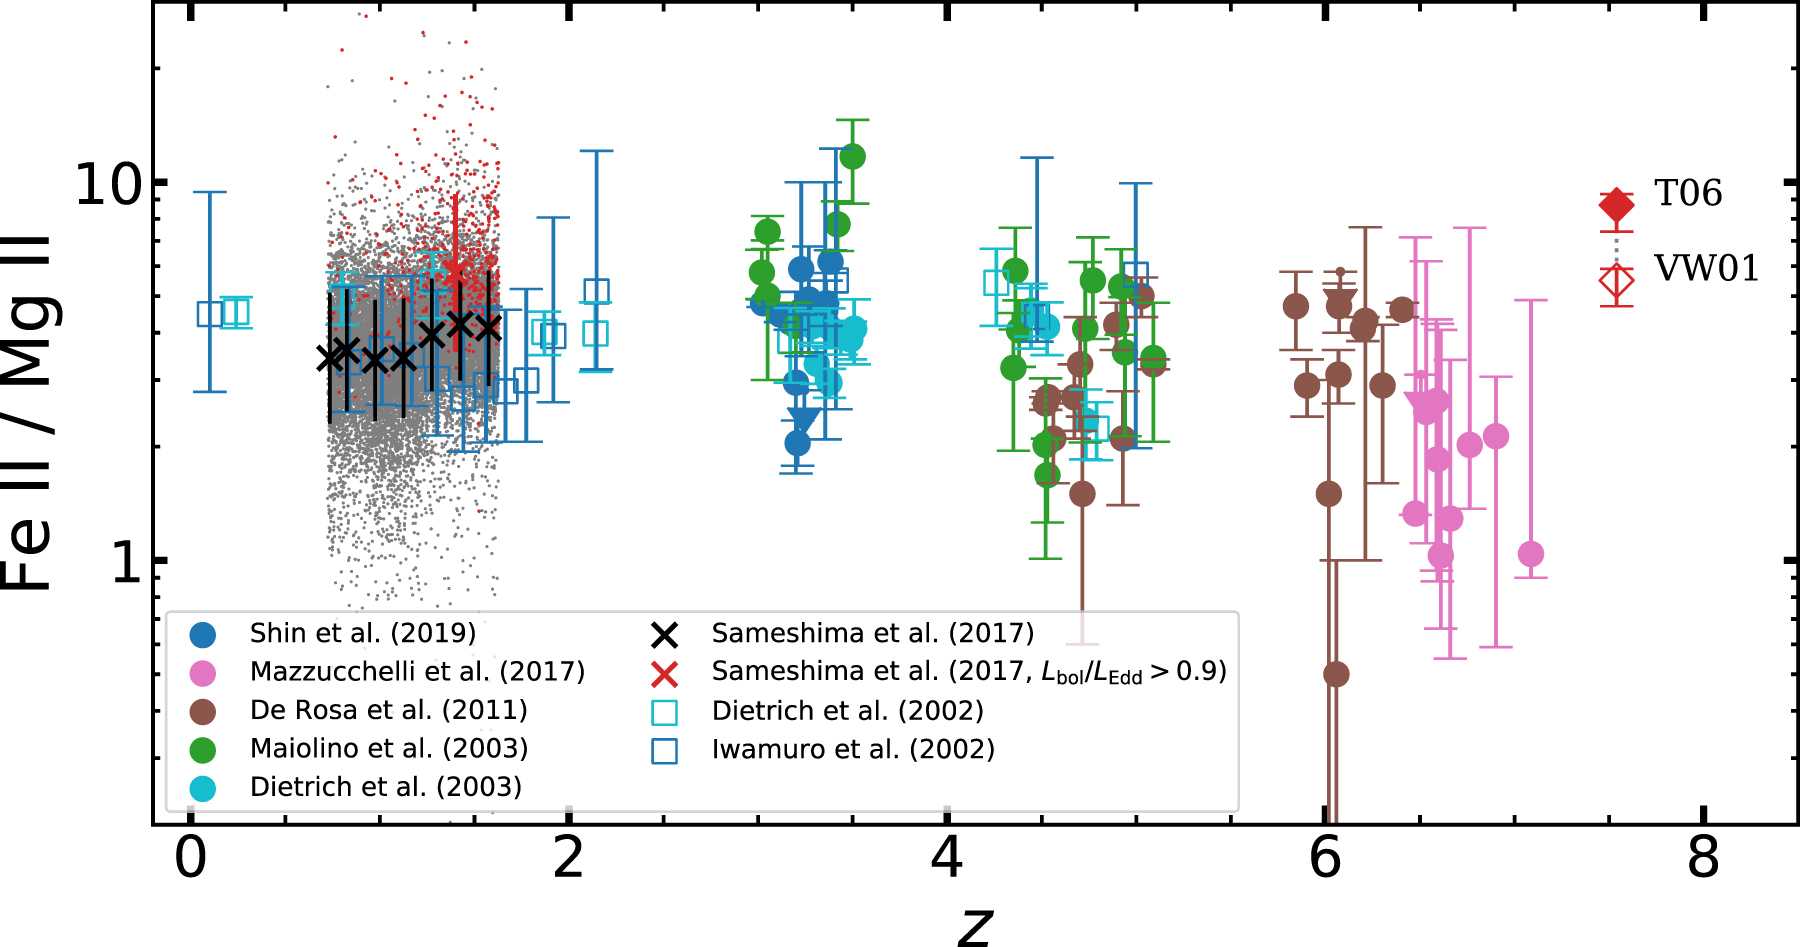
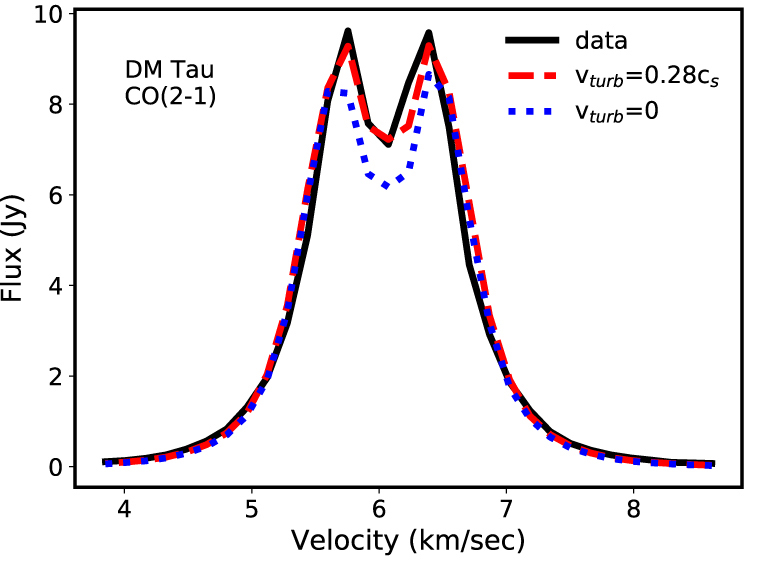
The Fe II/Mg II line ratio, which traces the iron enrichment of the gas, is very similar for ULAS J1342+0928 (red diamonds, showing two different models) and other, closer quasars. Click to enlarge. [Onoue et al. 2020]
What’s next? We need observations of even more distant quasars to push this limit even farther back in time; while we’ve spotted a handful of galaxies at redshifts above z = 8, we’ll need to keep hunting to find quasars at these larger distances so that we can measure their metallicity.
Citation
“No Redshift Evolution in the Broad-line-region Metallicity up to z = 7.54: Deep Near-infrared Spectroscopy of ULAS J1342+0928,” Masafusa Onoue et al 2020 ApJ 898 105. doi:10.3847/1538-4357/aba193


