
Sometimes more-precise measurements are all we need to make new discoveries in old structures! In a new study, data from the Gaia mission has revealed a surprise hidden among main-sequence stars.
Old Diagram with a New Feature
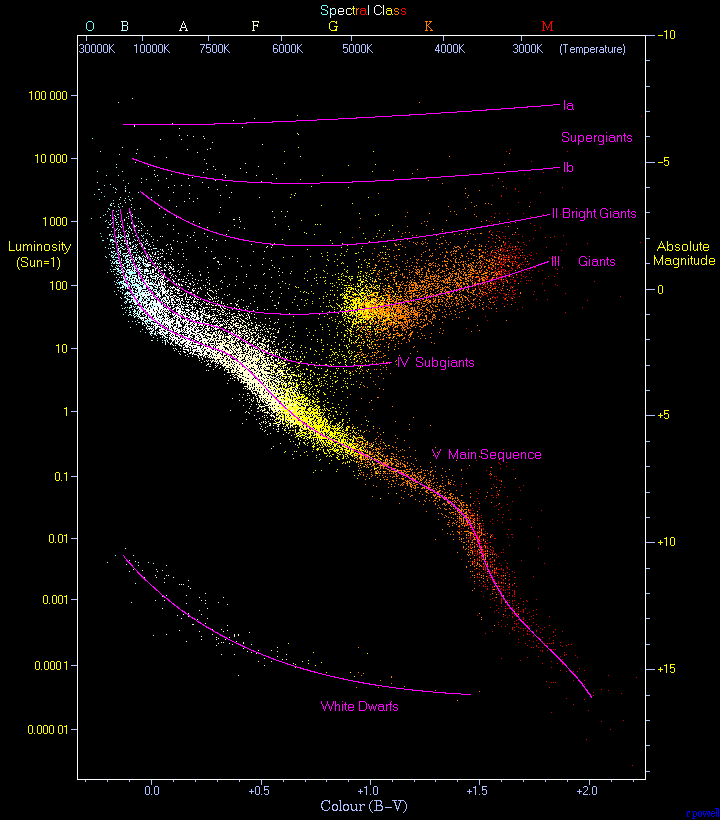
An example HR diagram containing 22,000 stars from the Hipparcos catalog and 1,000 from the Gliese catalog of nearby stars. Main-sequence stars are visible as the diagonal band across the diagram, but data is sparse for M dwarfs in this plot (lower right corner). [Richard Powell]
Though we’ve constructed HR diagrams for nearby stars for more than a century, they continue to change as our data for these stars improve. In particular, today’s era of precision astrometry has significantly improved the distance measurements for the stars that surround us, allowing them to be placed more accurately on the diagram. The recent second data release from the Gaia mission presented precise astrometry measurements for billions of stars, covering virtually all types on the HR diagram — including M dwarfs, which were sparsely sampled in the past.
A team of scientists led by Wei-Chun Jao (Georgia State University) has now explored this data and discovered a surprise: there’s a gap in the HR diagram at mid-M dwarfs.
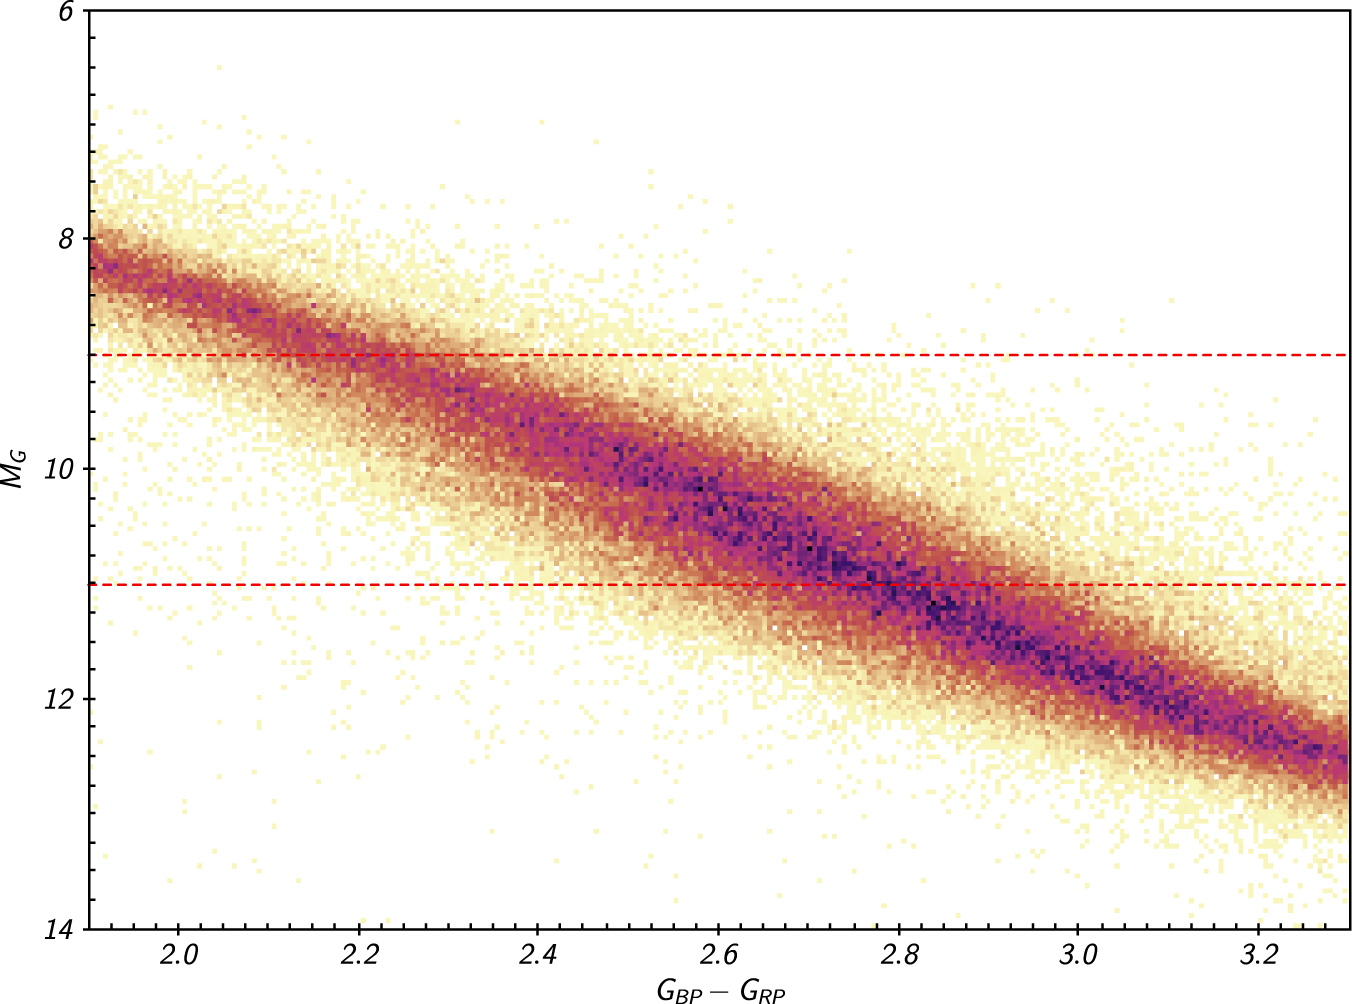
Portion of the HR diagram for stars within 100 pc in the Gaia DR2 data set. A narrow low-density gap is visible cutting through the main sequence between the two dashed lines. [Jao et al. 2018]
Mind the Gap
Jao and collaborators plotted a total of nearly 250,000 stars from the Gaia archive on an HR diagram. The new data and improved measurements revealed a previously unseen feature: a narrow, diagonal slice through the main sequence that is underpopulated. The missing stars seem to lie in the middle of the M-dwarf region.
The authors cross-match the stars against the 2MASS catalog, finding that the gap exists in other data and color bands as well — which means it’s not just a weird quirk of Gaia’s photometry. They then check whether the gap exists only in stars at a specific distance. Another no: it’s visible similarly in various populations spanning distances up to 425 light-years.
Transitioning Convection
So what’s causing this unexpected feature? The authors argue that the presence and persistence of the gap suggest that it’s due to some underlying physics that we haven’t yet thought of — which is always an exciting prospect!
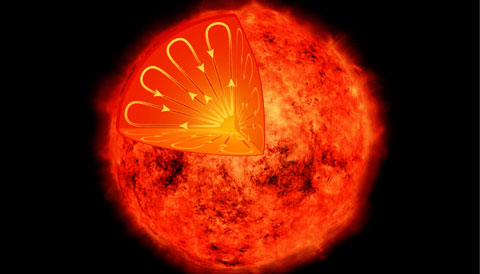
M dwarfs transition from being mostly convective to being fully convective, shown here, at masses of around 0.35 solar masses. [NASA/CXC/M.Weiss]
In the future, the authors propose gathering more data — like dynamical masses, radii, metallicities, rotational periods, and magnetic properties — on stars in and near the gap, to better understand population trends. In the meantime, we can be excited to know that there are still some surprises left for us to discover in old structures, if we just keep improving our data.
Citation
Wei-Chun Jao et al 2018 ApJL 861 L11. doi:10.3847/2041-8213/aacdf6
5 Comments
Pingback:Una brecha en la Secuencia Principal. | Pablo Della Paolera
Pingback:Links for the Week of July 22, 2018 – Verywhen
Pingback:Gaia-gegevens laten zien dat er een gat in het Hertzsprung-Russell diagram zit
Pingback:1,000 AAS Nova Highlights and Five Years of Astronomy
Pingback:Getting Deeper into HR Diagrams with Gaia