Rapid Recurrent Nova May Be Challenging Perceptions
Flashing on and fading quickly, recurrent novae are captivating astronomical phenomena. A recent study identifies one system that challenges our current understanding.
Rapid Recurrent Novae
When a white dwarf — the white-hot remnant of a dead star — has a close binary companion, the white dwarf can pull material from the companion star onto its boiling surface. Ignited in a bright flash, the accreted material is blown out from the white dwarf in a nova explosion that gradually expands and fades over time. Some novae, known as recurrent novae, repeat on observable timescales, creating a “new” star in the sky on periods ranging from one to one hundred years.
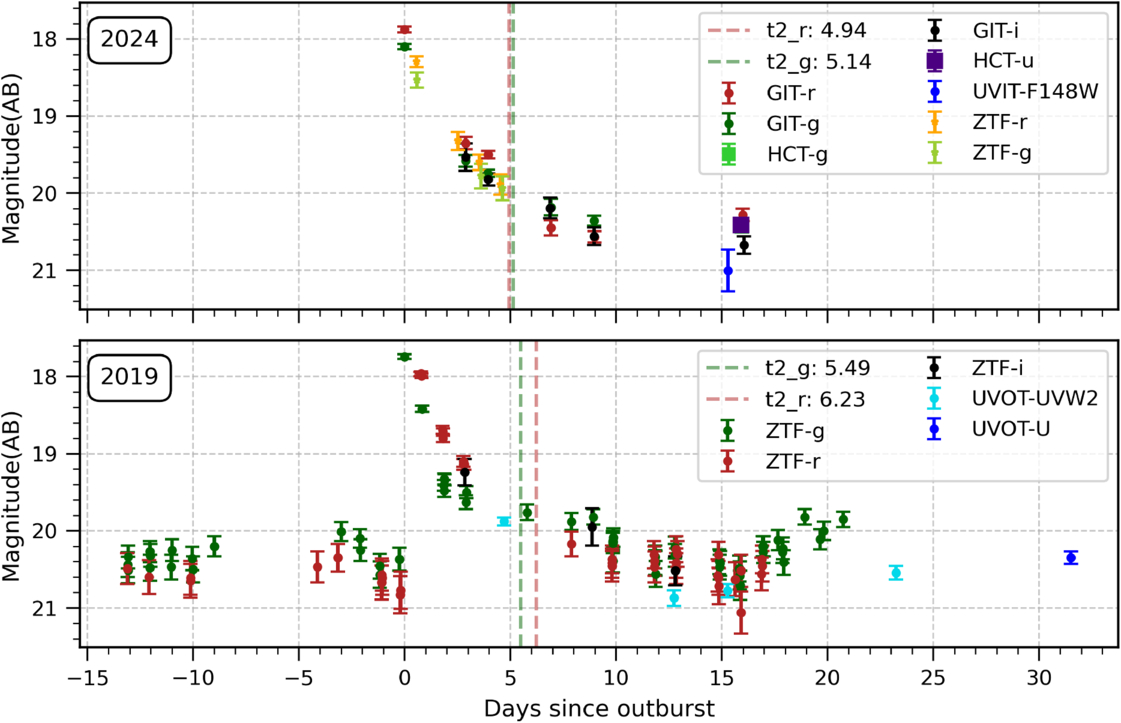
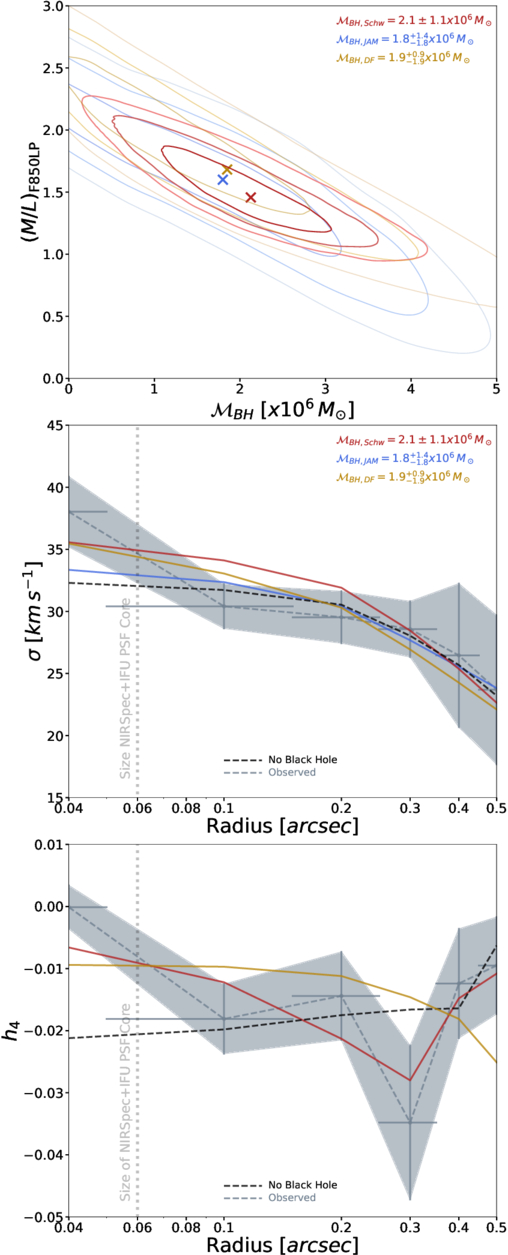
Two light curves of M31N 2017-01e outbursts from 2024 (top) and 2019 (bottom) showing how the light evolves over time. Click to enlarge. [Chamoli et al 2025]
Discovered in 2017, the second-shortest-period nova M31N 2017-01e has an outburst about every 2.5 years. This nova has sparked intrigue among researchers due to its low-amplitude outbursts and rapid evolution compared to other recurrent novae. While M31N 2017-01e exhibits some emission features typical for recurrent novae, recent studies have suggested that the system’s companion star may be a moderately young, blue B-type star. Most novae occur in systems where the white dwarf’s companion is a late-type main-sequence, subgiant, or giant star, making M31N 2017-01e an unusual case requiring further investigation.
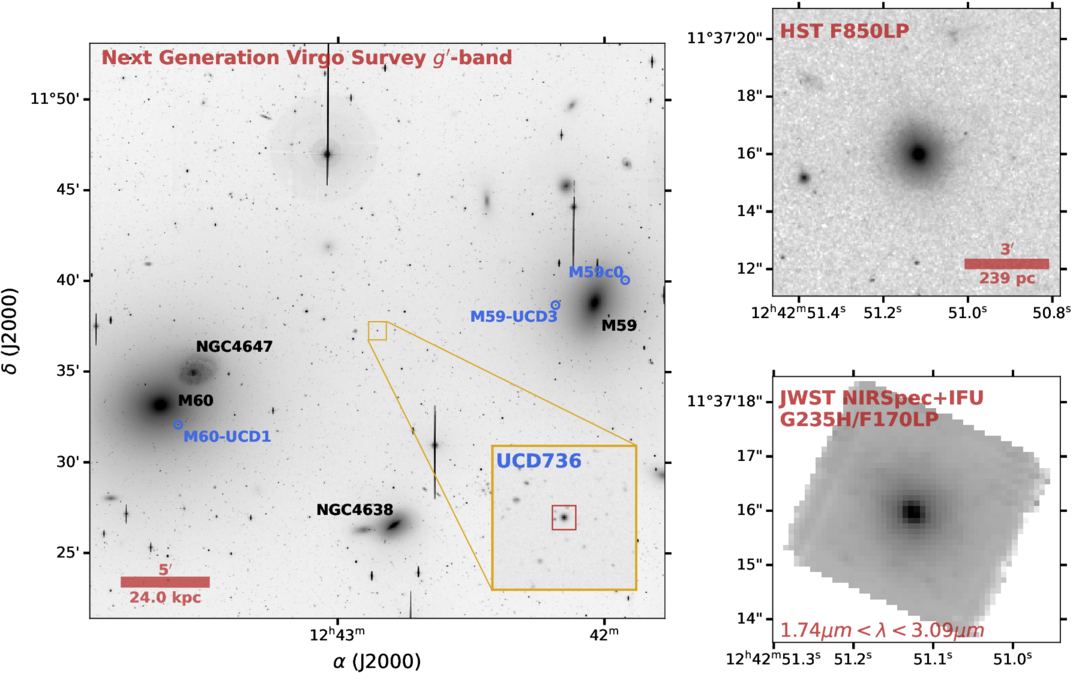
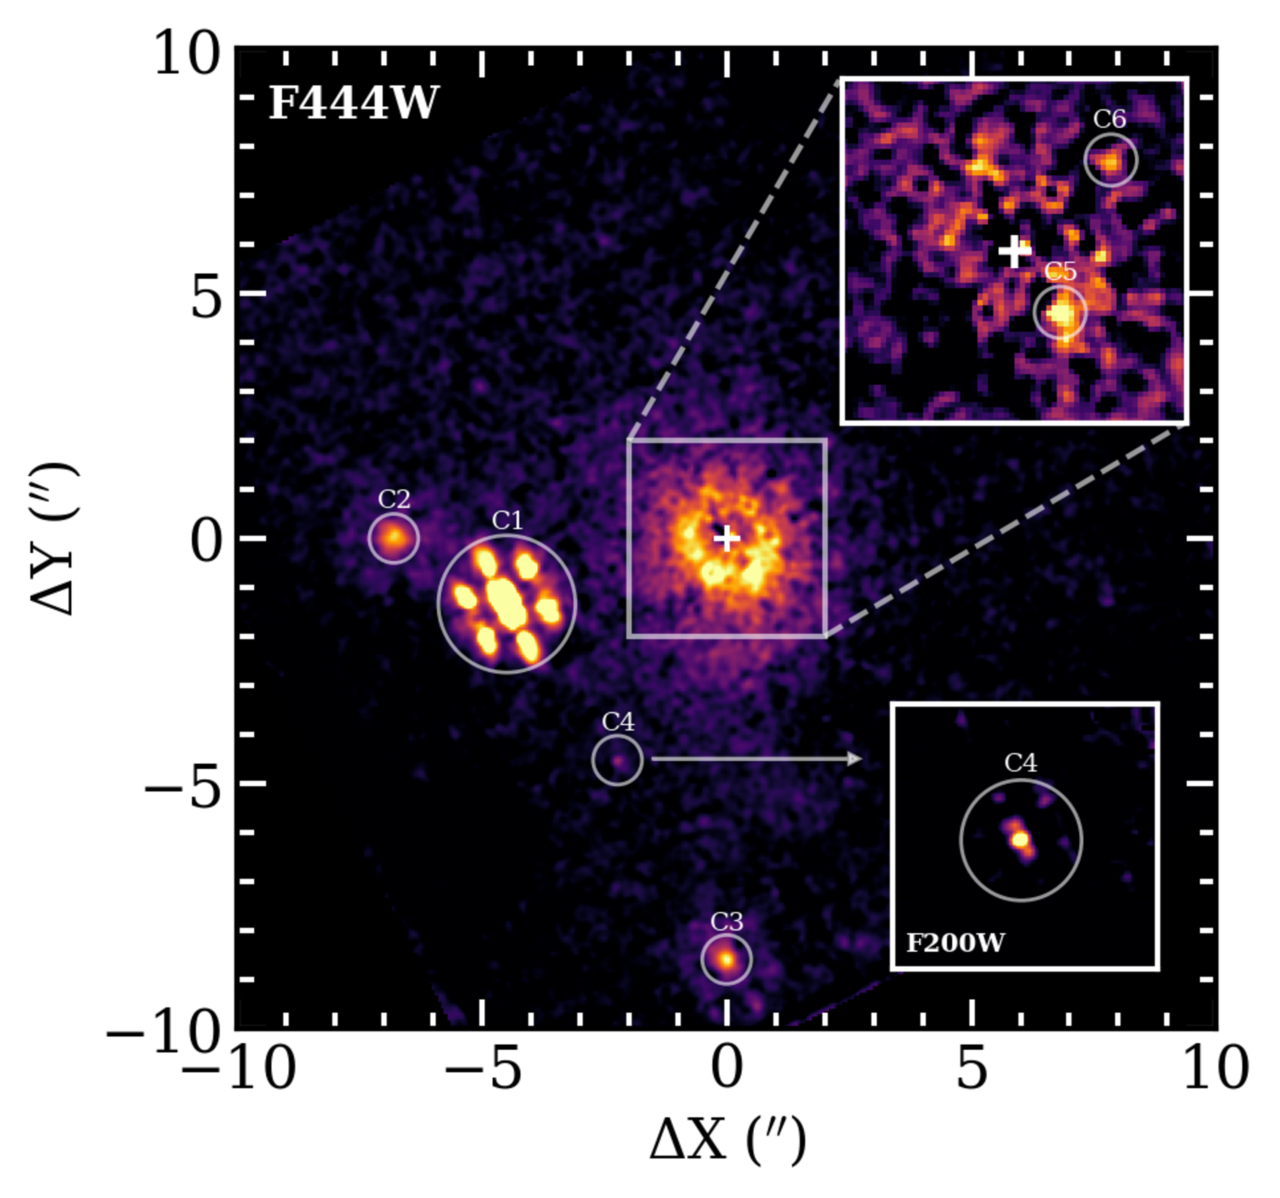
Optical image showing the location of sources near the location of M31N 2017-01e. The yellow circle corresponds to a radius of 5 arcseconds and is centered on the nova. Labeled S0, the source coincides with the location of the nova with sub-arcsecond resolution. Click to enlarge. [Modified from Chamoli et al 2025]
Dialing In on M31N 2017-01e
Aiming to constrain the nature and companion star of the nova, Shatakshi Chamoli (Indian Institute of Astrophysics and Pondicherry University) and collaborators performed a multiwavelength analysis using ultraviolet and optical observations of M31N 2017-01e.
In monitoring the nova during and in between outbursts, the authors identified a source at the reported location of M31N 2017-01e that exhibited variability and color consistent with previous observations of the system. Through a detailed photometric analysis, the authors found that the color and emission properties of the source are consistent with a hot, early-type star as was previously suggested. Though all the observational signs point toward a B-type companion, there’s one glaring obstacle to that scenario: such a massive star would typically be unable to transfer the amount of mass necessary to fuel the nova’s frequent eruptions without the accretion becoming unstable.
Be a Companion
What else, then, could the companion be? The authors considered another stellar companion known as a Be star — a rapidly rotating, early-type star that occasionally hosts a disk of loose stellar material. With a blue color and spectral features similar to B-type stars, a Be star could match the observational properties of the nova’s companion while solving the problem of its accretion. Outbursts of M31N 2017-01e likely arise due to the white dwarf lying very near or within the Be star’s circumstellar disk, siphoning material and adequately fueling the system’s recurring eruptions. To confirm this hypothesis, researchers will need to perform follow-up infrared observations to search for the tell-tale signs of a dusty disk around the companion star.
This system is rare and challenges the assumed properties of recurrent novae. From this study, it is clear that nova progenitors are potentially quite diverse and require further multiwavelength observational programs to identify more systems like M31N 2017-01e.
Citation
“Challenging Classical Paradigms: Recurrent Nova M31N 2017-01e, a BeWD System in M31?” Shatakshi Chamoli et al 2025 ApJ 991 174. doi:10.3847/1538-4357/adf843