Features RSS

A large planet silhouetted against a small red star and a larger yellower star with starspots

Astronomers and science-fiction fans alike were delighted to discover that planets can exist in stable orbits around binary stars. Today’s article looks at circumbinary planets from a new angle — a 90-degree angle, to be exact.

Rings of emission that are misaligned with the binary orbit (left) and aligned with the binary orbit

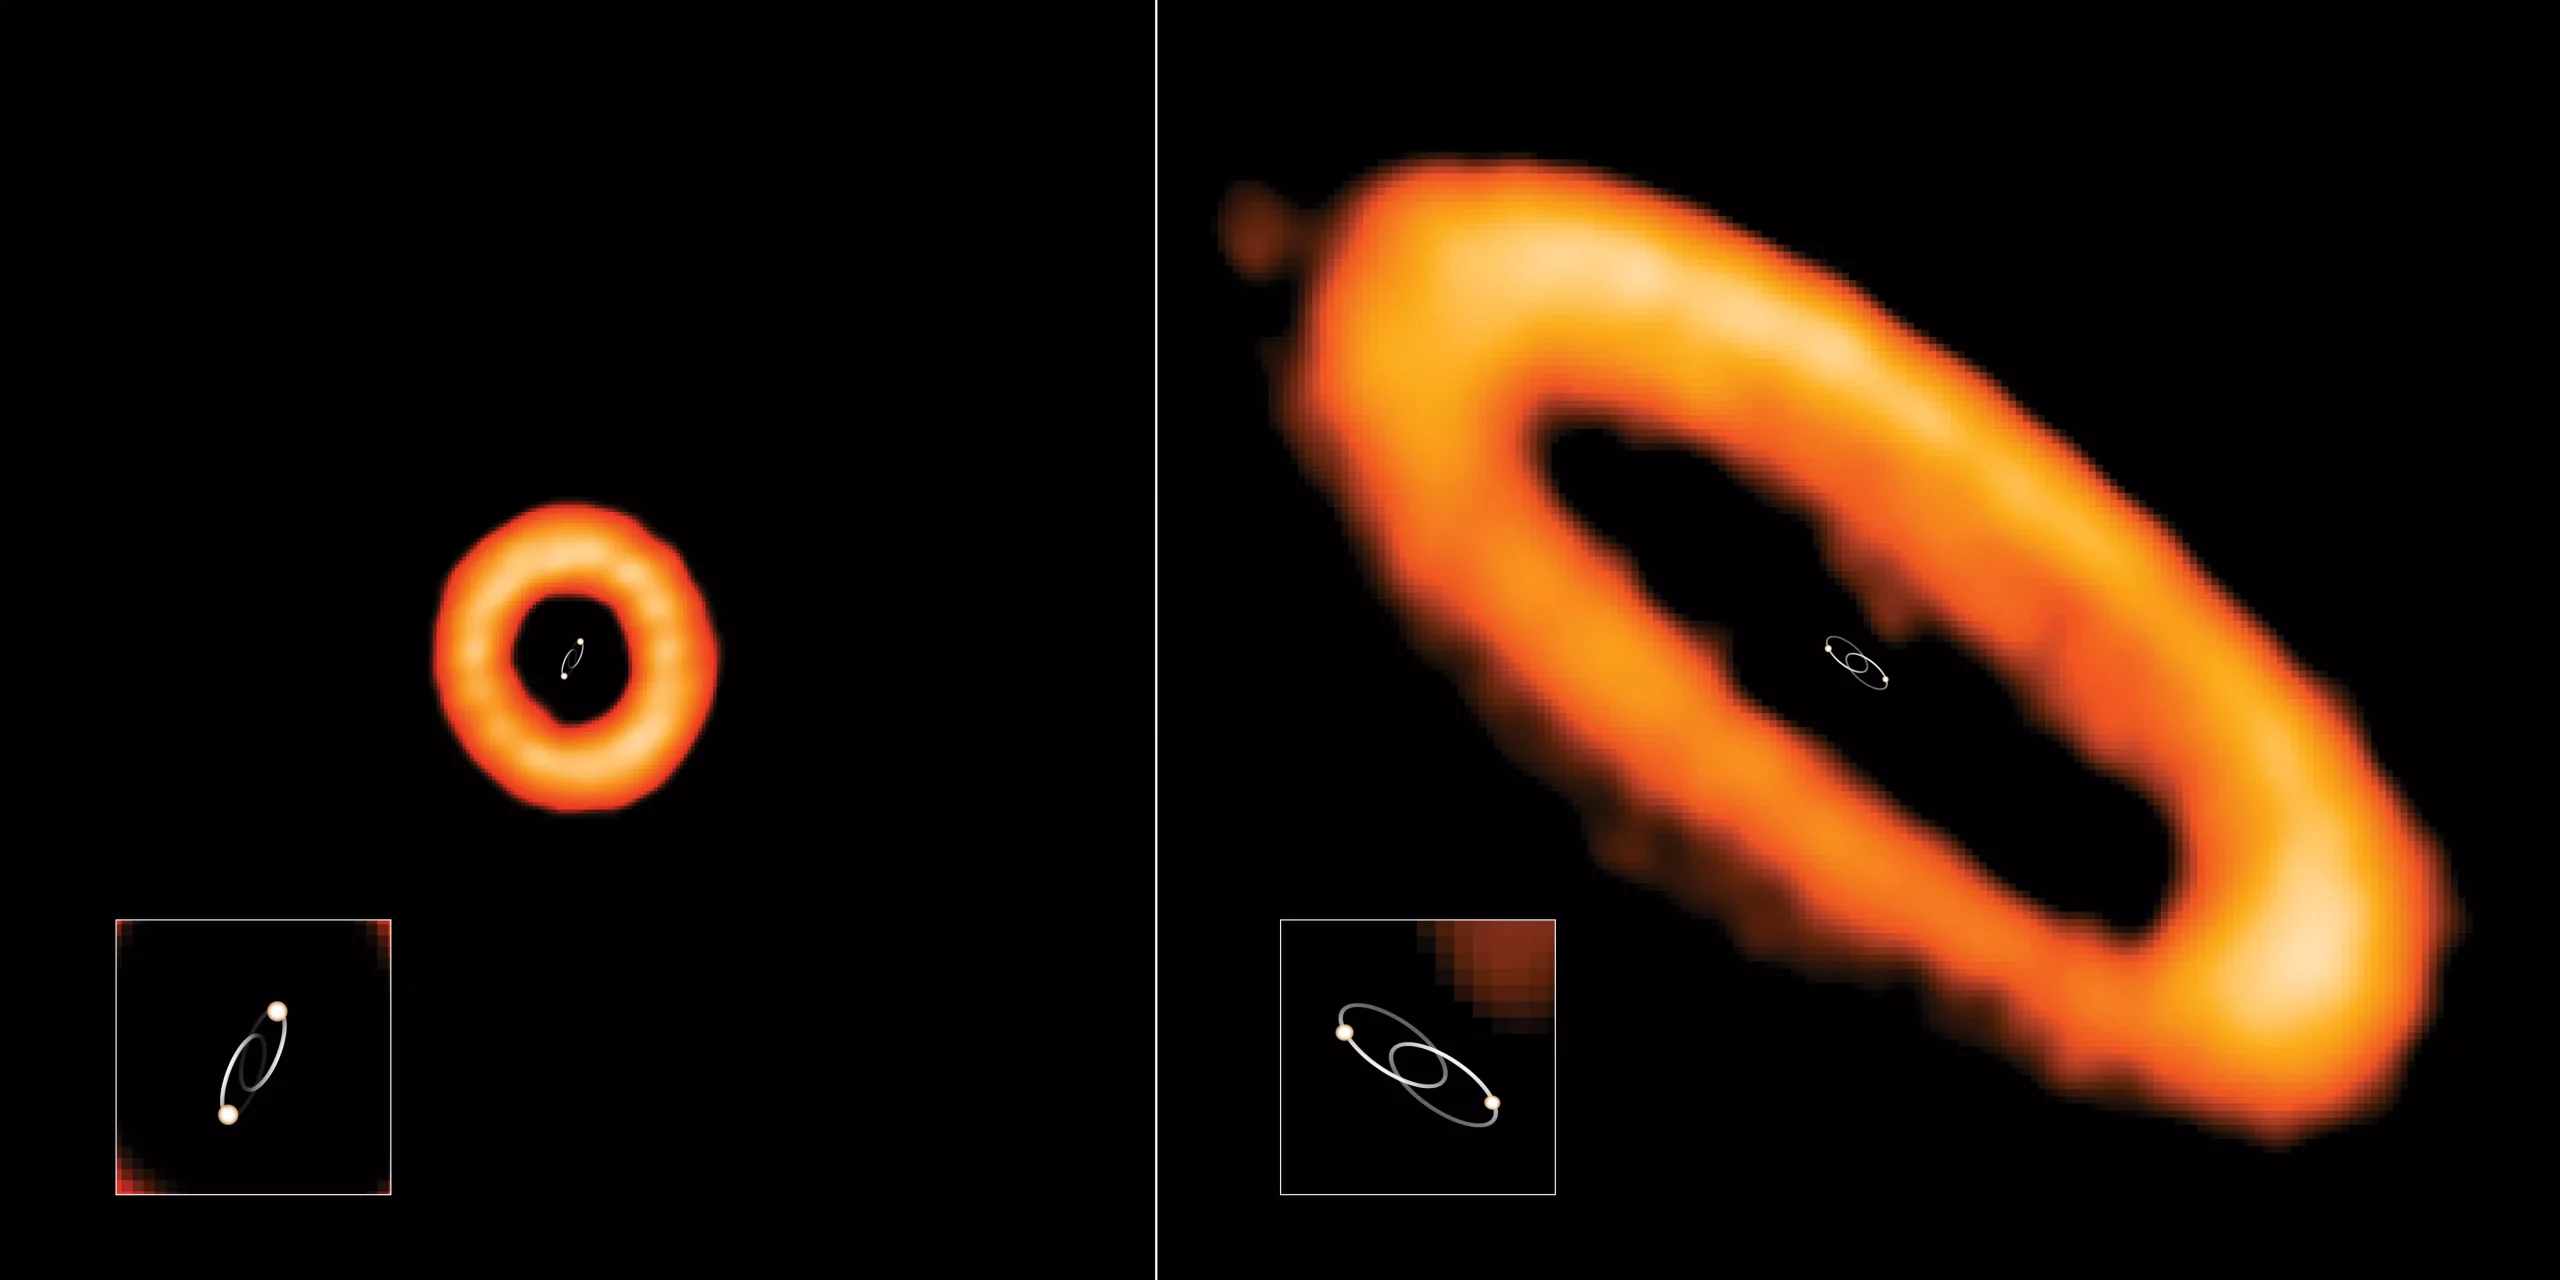
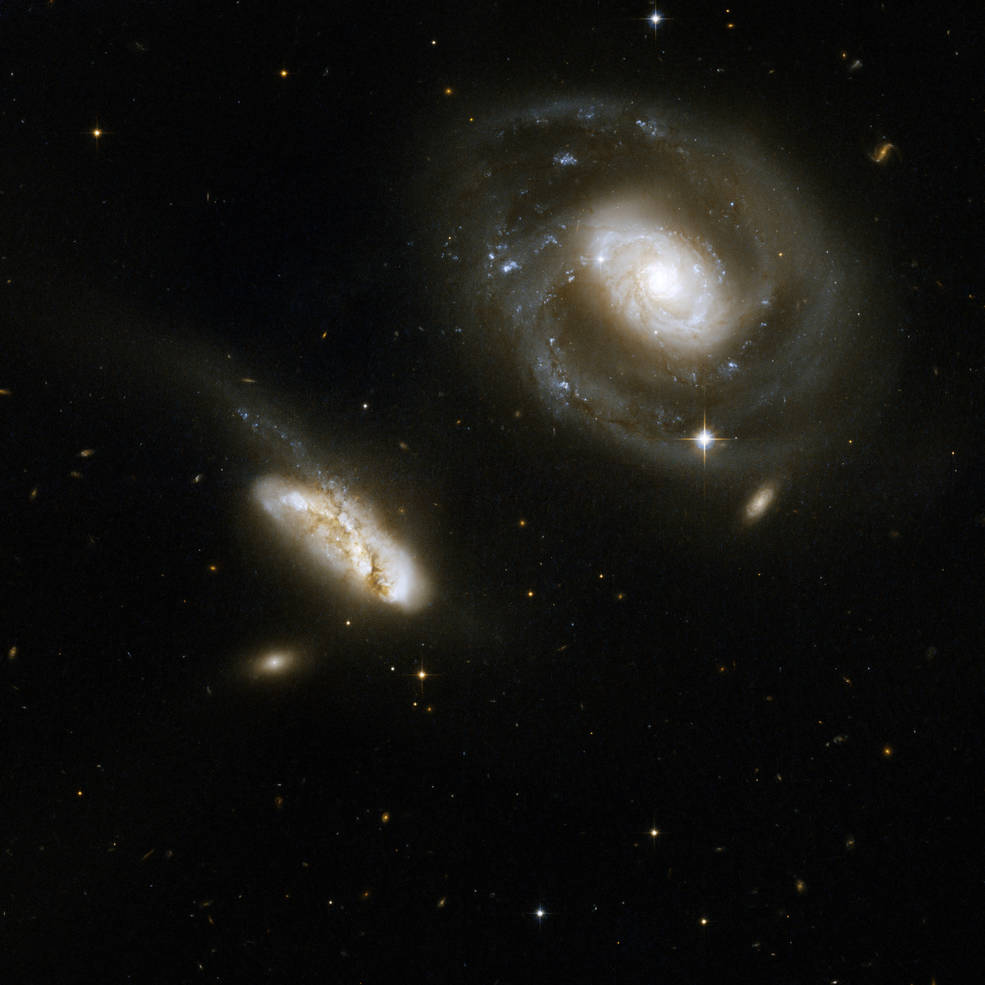
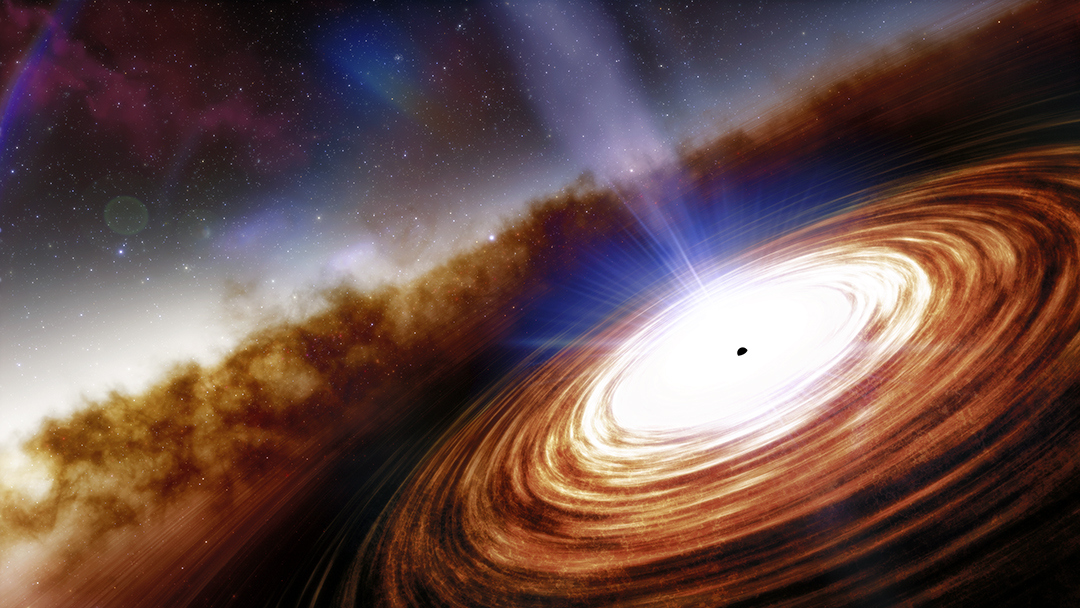
Most circumbinary disks (orange) are aligned with the orbital plane of the binary (e.g., AK Sco, right), but we’ve also found disks oriented perpendicular to the orbital plane (e.g., HD 98800 B, left). Here orbits of the binary system are drawn in white for clarity. Click to enlarge. [ALMA (ESO/NAOJ/NRAO), I. Czekala and G. Kennedy; NRAO/AUI/NSF, S. Dagnello]

Planets at an Extreme Angle

The vast majority of disks observed around binary stars are aligned with the orbital plane of the binary, since angular momentum tends to be conserved as gas clouds collapse to form star systems and their surrounding protoplanetary disks. However, recent observations have found that binary star systems with elongated, eccentric orbits can maintain a protoplanetary disk perpendicular to the orbital plane of the binary system.

These observations suggest that perpendicular circumbinary planets exist, but astronomers have yet to detect any. What can simulations tell us about the likelihood of perpendicular planets forming, especially rocky, Earth-like planets close to their parent stars?

Simulating Systems in Formation

To explore the planet-forming potential of perpendicular disks relative to other configurations, Anna Childs and Rebecca Martin (University of Nevada, Las Vegas) simulated three scenarios involving circumbinary disks:

  1. Simulated disk material distributions for each of the three scenarios. The eccentric perpendicular case has the most material close to the stars while the eccentric coplanar case has the least.

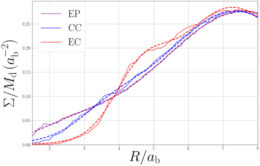
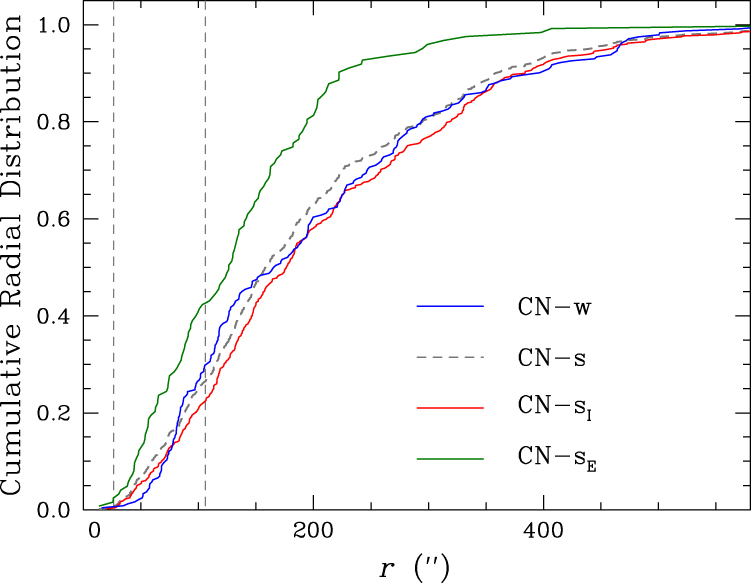
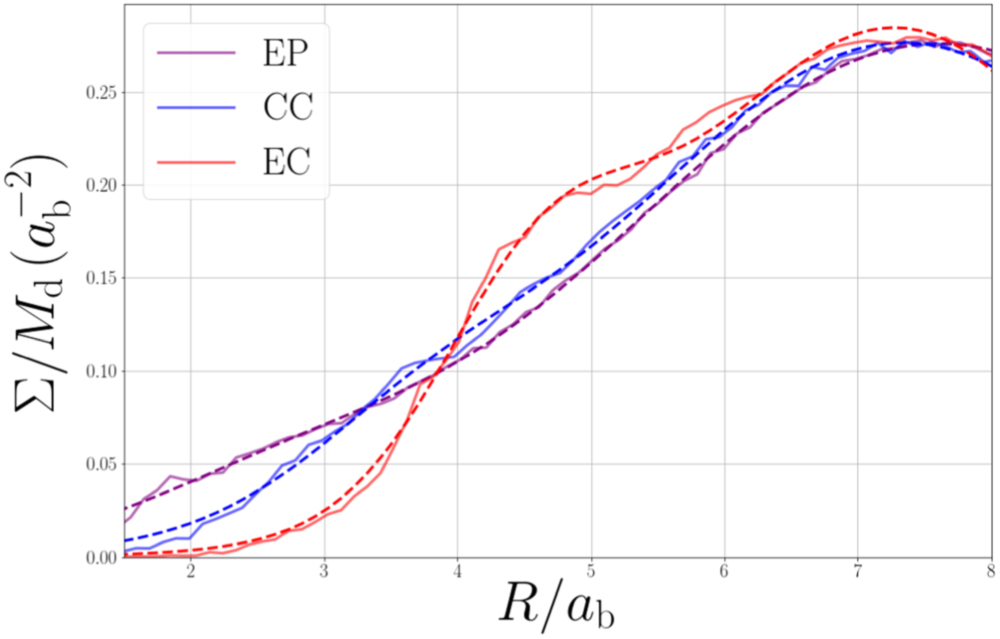
    Distribution of disk material as a function of distance from the system center of mass for the eccentric perpendicular (EP), circular coplanar (CC), and eccentric coplanar (EC) scenarios. When the disk is oriented perpendicular to the orbital plane of the binary, more material is found closer to the binary. [Childs & Martin 2021]

    In the same plane as a binary pair with a circular orbit (eccentricity e=0)
  2. In the same plane as a binary pair with an eccentric orbit (e=0.8)
  3. Perpendicular to the plane of a binary pair with an eccentric orbit (e=0.8)

Childs and Martin first performed hydrodynamic simulations to determine how the disk material would be distributed in the early stages of planet formation for each of these three cases. The authors then used these results to guide the placement of 26 Mars-sized and 260 Moon-sized objects within the simulated disk — the mass and size distribution thought necessary to form the terrestrial planets in our solar system. In the final N-body simulation, the authors let these planetesimals loose and watched their planet-forming journey.

Simulation of particle orbits. After 10,000 years, there are many small bodies, while after 7 million years there are fewer bodies that are larger.

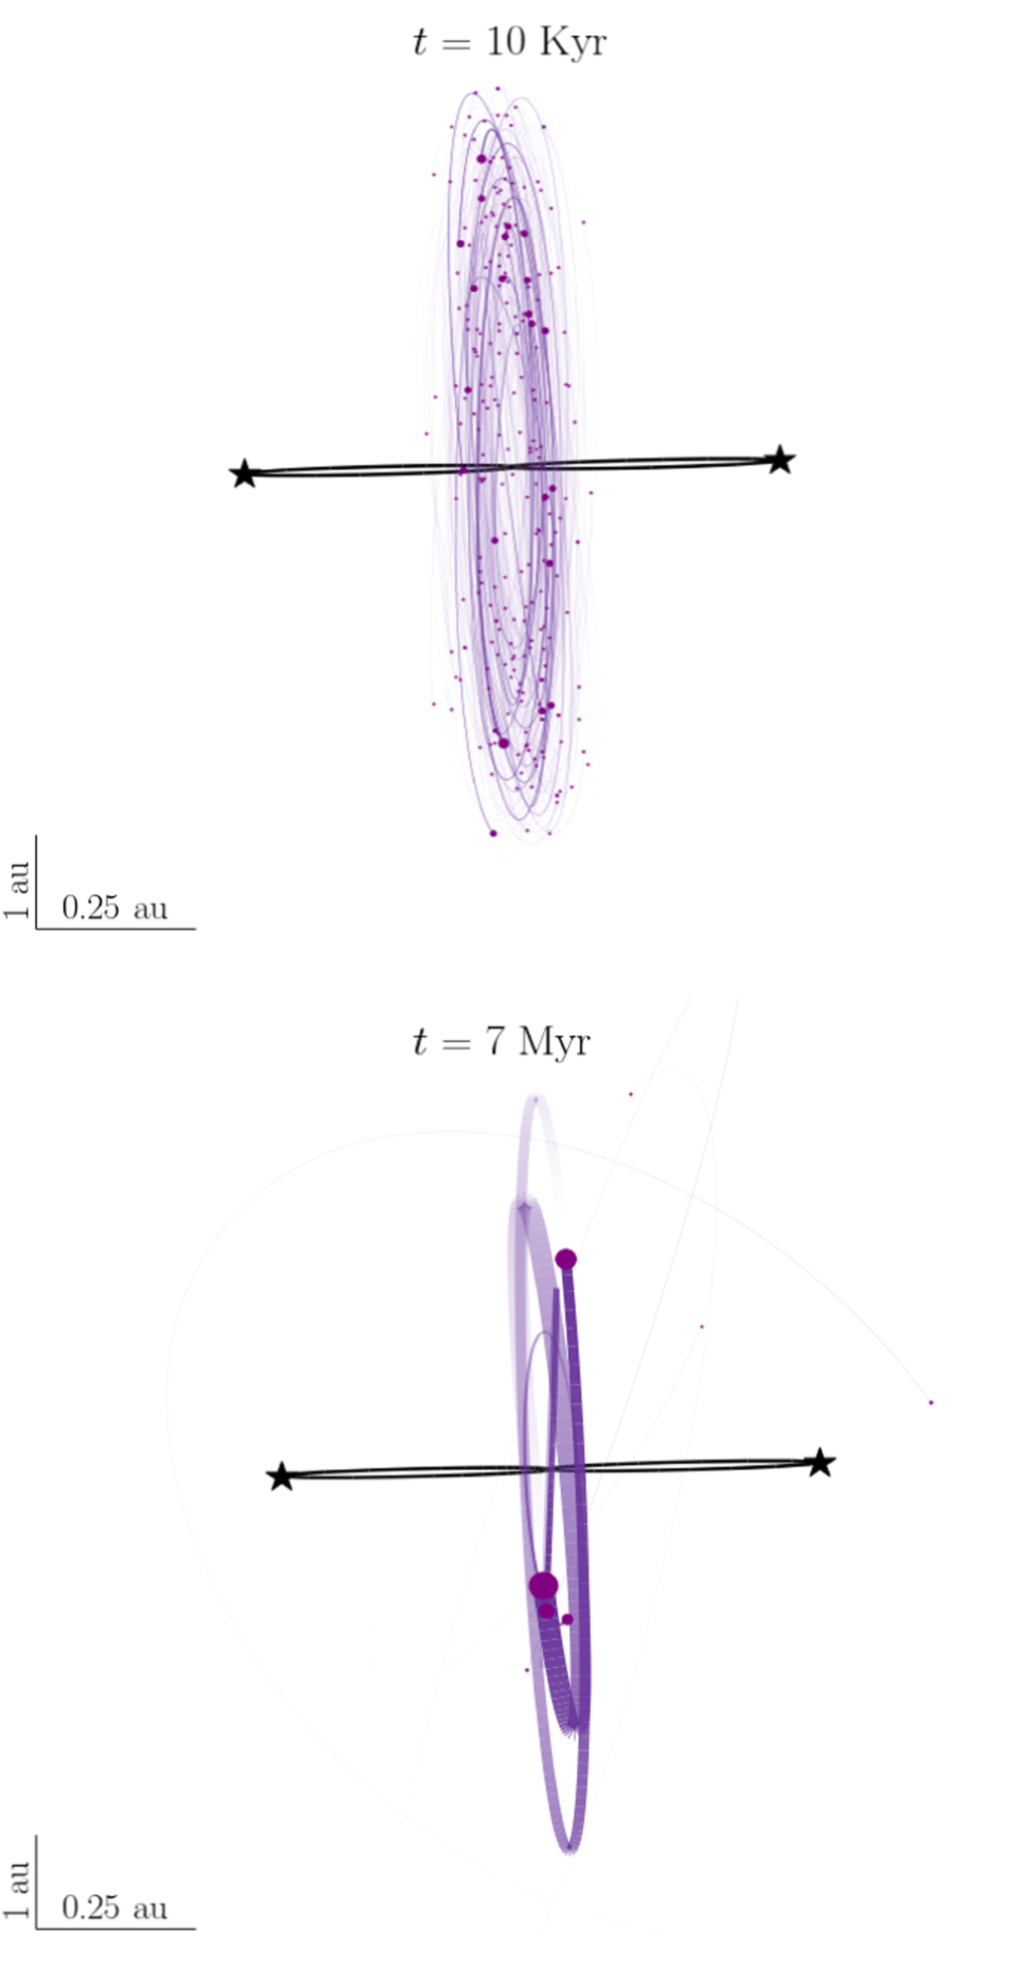
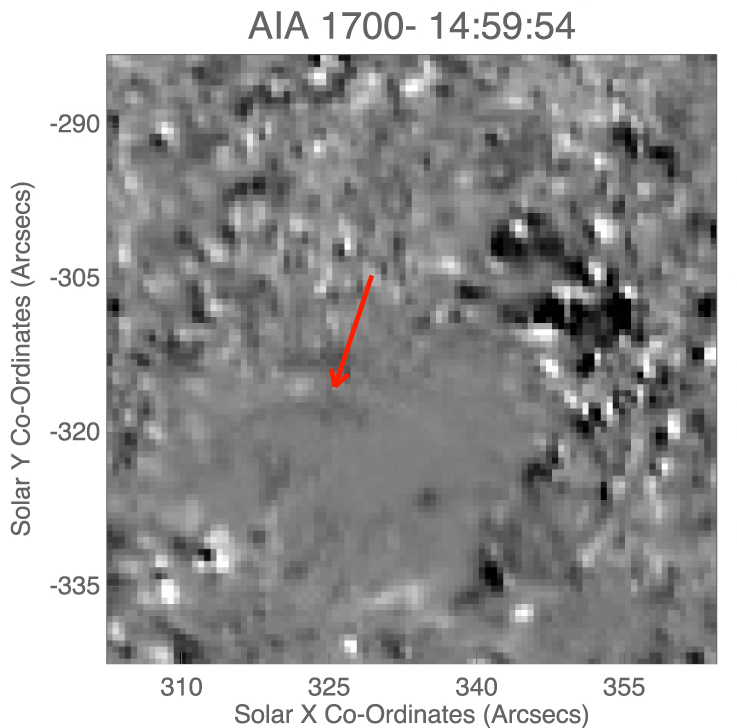
Simulated particle orbits for the case of a planet-forming disk perpendicular to the orbit of an eccentric binary after 10,000 years (top) and seven million years (bottom). [Adapted from Childs & Martin 2021]

More Likely Than You Might Think

Over the course of seven million simulated years, material in the fledgling planetary systems collided with the host stars, clumped together to form larger bodies, or was ejected from the systems altogether. The result? Disks oriented perpendicular to the orbital plane of an eccentric binary formed more planets than disks in the same plane as the binary orbit.

On average, the perpendicular disks formed 4.8 terrestrial planets while the coplanar disks formed only 3.4. The difference likely arises from the increased torque that the binary applies to the disk in the coplanar case — more torque means more material gets ejected from the disk. Neither scenario formed as many terrestrial planets as the circular coplanar case, but it’s clear that close-in, rocky planets can exist in orbits perpendicular to their host binary system. Even taking into account the complicating effects of general relativity, which cause eccentric binary systems to precess over time, the perpendicular system retained its terrestrial planets.

Childs and Martin note that detecting planets in this configuration with current techniques is difficult, but not impossible — hopefully the discovery is just around the corner!

Citation

“Formation of Polar Terrestrial Circumbinary Planets,” Anna C. Childs and Rebecca G. Martin 2021 ApJL 920 L8. doi:10.3847/2041-8213/ac2957

A globular cluster, densest at the center, with stars of several different colors

Globular clusters are among the oldest structures in the universe, but astronomers are just starting to figure them out. A new study uses precise measurements of chemical elements to explore the formation history of one of the oldest globular clusters in the Milky Way.

New Understanding of Old Objects

Close-up of the stars at the center of a globular cluster

It can be challenging to study the stars in the densely packed centers of globular clusters. [NASA, Hubble Space Telescope, ESA]

Early theories suggested that all the stars in a globular cluster form at the same time from the same material, resulting in a single stellar population that is chemically identical. However, more recent work has found that some stars in globular clusters show signs of chemical evolution, hinting that they formed from gas enriched by previous generations of stars.

In order to learn more, we need to measure the chemical abundances of hundreds of cluster stars. Performing this chemical tagging is challenging — detecting subtle enhancements in elemental abundances requires precise measurements, and the usual methods have serious drawbacks. Spectroscopy is a powerful tool for determining chemical abundances, but spectra of stars so densely packed are often contaminated. Broadband photometry, on the other hand, doesn’t suffer from contamination but isn’t sensitive enough.

Top panel: Transmission curves for three different filters as a function of wavelength. Bottom panel: a stellar spectrum with calcium and CH features. The calcium filter encompasses the calcium features while excluding the CH feature.

The new filters, some of which are shown in the blue and red lines in the top panel, allow for better isolation of important spectral features. [Lee 2017]

Hundreds of Stellar Measurements

Jae-Woo Lee (Sejong University, South Korea) approached this problem by developing a new photometric system to measure chemical abundances in closely spaced stars. Lee’s system of narrow-band filters is designed to capture the absorption bands of the molecules CN, CH, and NH, which are important for determining the abundances of carbon and nitrogen.

Lee applied this photometric system to 842 red giant stars in Messier 5, a globular cluster in the Milky Way that is estimated to be more than 12 billion years old. Previous studies of this cluster suggested that it is home to two populations of stars, one of which is enhanced in nitrogen.

Application of the new photometric system revealed that Messier 5 is composed of not two but three stellar populations. The more precise photometry revealed that the nitrogen-enhanced population is really two separate populations that differ in both their level of carbon depletion as well as their distribution within the cluster. What does the presence of multiple stellar populations mean for the formation of Messier 5?

Three Stages of Formation

Plot of the cumulative radial distribution of the different populations. One population is more centrally concentrated than the other populations, which have indistinguishable distributions.

One of the nitrogen-enhanced populations (CN-sE) has a significantly different distribution within the cluster than the other nitrogen-enhanced population (CN-sI) and the nitrogen-normal population (CN-w). [Lee 2021]

This result suggests that the stars in Messier 5 formed in several stages rather than all at once. The author suggests that the nitrogen-normal population is likely made up of first-generation globular cluster stars, while the nitrogen-enhanced populations formed later.

Specifically, Lee argues that the centrally concentrated population likely formed in the dense inner regions of the cluster after the original highest-mass stars exploded as supernovae, while the more evenly distributed population formed somewhat later out of gas containing smaller amounts of recycled supernova material. This hypothesis explains the distributions of the two populations as well as their chemical abundances.

Hopefully, this method can be used to search for multiple stellar populations in many other globular clusters — clearly, these objects aren’t as simple as they seem!

Citation

“Formation of Multiple Populations of M5 (NGC 5904),” Jae-Woo Lee 2021 ApJL 918 L24. doi:10.3847/2041-8213/ac1ffe

False-color image of the Sun

A sunquake might sound like something that would be pitted against a tsunami in a B-level disaster movie, but these ripples on the Sun’s surface aren’t likely to affect us here on Earth. Instead, astronomers study sunquakes to understand their connection to another important solar phenomenon: solar flares.

Disturbances on the Solar Surface

Four panels showing circular ripples expanding on the Sun's surface

Sunquakes appear as expanding circular wavefronts in Doppler images. The event shown here was the first flare-generated sunquake ever detected. [ESA/NASA SOHO]

When the Sun unleashes a huge burst of electromagnetic radiation in the form of a solar flare, the flare sometimes generates a flurry of seismic waves in the Sun’s interior and on its surface, in the photosphere, called a sunquake. Though sunquakes are often described as “waves” or “ripples,” these terms belie the full force of these events: the first sunquake discovered to be connected to a solar flare was estimated to be equivalent to an 11.3-magnitude earthquake — roughly 50 times stronger than the strongest earthquake ever recorded.

Somehow, solar flares power these massive seismic events, but the exact mechanism isn’t known. So far, the majority of sunquakes have been observed in the photosphere, but recent observations suggest they also occur in the chromosphere, the region above the photosphere where the temperature begins to rise. One key to understanding these events is to pin down where they occur, leading Sean Quinn (Queen’s University Belfast, Ireland) and collaborators to seek them out.

Snapshots of the Sun

Quinn and coauthors began their search with a set of 62 sunquakes that had previously been discovered in pictures of the solar photosphere. Their goal was to find evidence of these same sunquakes in 160- and 170-nm ultraviolet images from the Solar Dynamics Observatory (SDO) Atmospheric Imaging Assembly, which probe higher temperatures — and therefore higher altitudes — than the photospheric images.

A grayscale image of the Sun with a small, curved wavefront

An example of a sunquake wavefront (indicated by the red arrow) in a 170-nm image from SDO. [Adapted from Quinn et al. 2021]

Using the locations of the 62 photospheric sunquakes to guide their search, Quinn and collaborators first examined the SDO ultraviolet images by eye. The team found that 25 of the photospheric sunquakes also produced some kind of motion in the ultraviolet images, and nine of these events were confirmed based on a secondary analysis of the motion of the sunquake wavefronts.

Because the SDO ultraviolet images capture photons from a range of altitudes, it’s challenging to discern the exact location of these sunquakes. However, previous analysis of SDO images found that flare-associated 160- and 170-nm emission arises from the chromosphere. This suggests that the nine sunquakes studied in this article also occurred in the chromosphere and can be used as a starting point for future studies.

The Investigation Continues

Solar flare at three wavelengths

These Solar Dynamics Observatory images of the Sun show a solar flare in three extreme ultraviolet wavelengths. From left to right: 17.1, 30.4, and 13.1 nanometers. [NASA/GSFC/SDO]

There’s still much we don’t know about sunquakes. Why are only some solar flares accompanied by sunquakes while others are seismically quiet? Similarly, why do some sunquakes only ripple through the photosphere, while others extend up into the chromosphere? The most widely accepted model of sunquake production suggests that nearly all solar flares should generate sunquakes, so alternative models may be necessary. With a little luck — and a lot of image analysis — these questions and more may be answered by further investigations of data from Solar Dynamics Observatory and other spacecraft.

Citation

“Flare-induced Sunquake Signatures in the Ultraviolet as Observed by the Atmospheric Imaging Assembly,” Sean Quinn et al 2021 ApJ 920 25. doi:10.3847/1538-4357/ac0139

The Sculptor Dwarf Galaxy, a small galaxy that looks like a clump of stars.

Editor’s note: Haley Wahl is a fifth-year graduate student at West Virginia University, and she was recently selected as the 2021–2022 AAS Media Fellow. We’re excited to welcome Haley to the team and look forward to featuring her writing on AAS Nova regularly!

The first stars to light up the cosmos have so far eluded astronomers. However, new research may now have uncovered these obscure objects in the dusty recesses of a dwarf galaxy 300,000 light-years away.

An Elusive Population

The birthplaces of stars are clouds of gas and dust hundreds of times bigger than our solar system. These nebulae can be formed in a variety of ways and are often the leftover material from a previous star that ended its life in a violent supernova explosion. If this is the case, the nebula can contain elements manufactured in the star that exploded, such as carbon and magnesium, as well as heavier elements forged in the supernova itself, such as silver. Stars that were formed in the aftermath of a supernova contain traces of all these elements.

pop iii stars

Artist’s impression of the first stars in the universe. [NASA/WMAP Science Team]

Based on their composition, stars can be categorized into three populations: Population I stars, which are young metal-rich stars (“metals” here are elements heavier than helium); Population II stars, which are metal-poor stars that started forming early on in the universe when it was only a few billion years old; and Population III stars, which are extremely bright, hot stars that contain almost no metals, only hydrogen, and formed in the earliest stages of the universe. Population III stars represent some of the first stars formed after the Big Bang, and they could provide new insights into what our universe was like when it was only ~800 million years old.

Population III stars have never been observed, only hypothesized, but a team of astronomers led by Ása Skúladóttir (University of Florence, Italy) may be closer than ever to observing these elusive astronomical wonders.

Searching Spectra

The star AS0039 was discovered in the dwarf galaxy Sculptor as part of a large survey done by the European Southern Observatory and observed more in-depth via spectroscopy with the Very Large Telescope/X-Shooter instrument, which reveals the composition of the star. Using the effective temperature of the star obtained from Gaia data, the gravity obtained through photometry, the microturbulent velocity measured through empirical calibration, and a stellar atmospheric model, the team performed spectral analyses on the star to determine its chemical composition.

A plot showing Fe/H vs. Mg/Ti and Fe/H vs. Mg/Ti. Both lines have a slope of around 0.

The ratio of abundances of different metals in stars in AS0039’s host galaxy (blue), dwarf spheroidal galaxies (dSph; green), ultra-faint dwarf galaxies (UDF; yellow), and the Milky Way (gray). AS0039’s metal abundances, shown in red, are unlike the stars in any of these galaxies. [Skúladóttir et al. 2021]

From this analysis, Skúladóttir and collaborators determined that AS0039 has very few metals, and it is different from other metal-poor stars because it is especially lacking in carbon and magnesium, which are formed by nuclear fusion in massive stars. This has intriguing implications for the origin of the nebula from which AS0039 formed.

These abundances of AS0039 are characteristic of elements formed in a hypernova, a giant explosion bigger than a supernova that occurred at the beginning of the universe when stars were more massive. By comparing AS0039’s abundances to those from simulations of Population III supernovae over a wide range of progenitor masses and explosive energies, the authors determined that AS0039 was likely born from the material left over after a star 21 times the mass of the Sun exploded as a hypernova. This discovery provides a link between the current generation of stars and their elusive Population III ancestors.

Future Work

Before this star was spotted, there was only weak evidence of Population III stars from the imprints of low-energy supernovae seen in carbon-enhanced metal-poor stars. The massive star that enriched the material from which AS0039 formed is unlike any star seen before, but this single discovery allows us to probe only a tiny subset of all the possible properties of Population III stars. The discovery of AS0039 will allow astronomers to study these stars in a different light, by probing them through the remnants of the massive explosions of the first stars. Future developments in theoretical simulations and larger spectroscopic surveys will bring astronomers one step closer to solving the mystery of what the first stars were like.

Citation

“Zero-metallicity Hypernova Uncovered by an Ultra-metal-poor Star in the Sculptor Dwarf Spheroidal Galaxy,” Ása Skúladóttir et al 2021 ApJL 915 L30. doi:10.3847/2041-8213/ac0dc2

Simulated image showing a foreground black hole warping spacetime around it, with a background of red and blue stars in the center of a galaxy.

When galaxies merge, what happens to the massive black holes at their centers? Today’s article explores the math behind the merger.

Hubble image of two spiral galaxies in the process of merging

When galaxies merge, it shakes up star formation and sets the stage for a massive black hole merger. [NASA, ESA, the Hubble Heritage (STScI/AURA)-ESA/Hubble Collaboration, and A. Evans (University of Virginia, Charlottesville/NRAO/Stony Brook University)]

An Emerging Question 

Two galaxies, adrift in the universe, pass near one another. If they become gravitationally entangled, the billion-year process of merging begins as they gradually coalesce into a single galaxy. As part of this process, the massive black holes at the centers of the colliding galaxies undergo a merger of their own.

As these massive black holes begin their death spiral, they encounter other galactic material like stars and gas. While simulations have shown that interacting with nearby stars causes the black-hole binary to spiral inward more quickly, the results aren’t as clear when it comes to gaseous material. Some studies have found that the presence of gas hastens the merger, while others suggest that it delays the merger instead.

The rate at which massive black holes merge has implications for upcoming gravitational-wave observatories, like the Laser Interferometer Space Antenna (LISA). Massive black-hole mergers at the centers of colliding galaxies are expected to be the loudest source of low-frequency gravitational waves in upcoming surveys — but if some process prevents these mergers, there may be nothing to listen to.

binary black hole merger

Artist’s illustration of the merger of two black holes in space. [LIGO/T Pyle]

Black Holes on Paper

Elisa Bortolas (University of Milano-Bicocca, Italy) and collaborators used a mathematical model of a black-hole merger to understand how interactions with stars and the presence of gas affect the inspiraling of the binary. Unlike most previous work, the set of differential equations developed by Bortolas and coauthors allowed for the effects of stars and gas to be considered simultaneously rather than separately.

The authors find that stars and gas tend to compete with one another as the black holes merge. If the black-hole pair accretes only a little mass from the surrounding material, gravitational interactions with nearby stars cause the black-hole pair to tighten inward. If the accretion rate is higher, the presence of a gaseous disk works to expand the binary pair, delaying the merger. Eventually, though, the stars win out, and the binary pair draws close enough to shed massive amounts of energy in the form of gravitational waves, sending the black holes on a collision course.

Conceptual artwork of a flat-topped circular spacecraft with two red laser-beam arms against a starry background

The LISA mission, planned for the 2030s, aims to to detect gravitational waves from space using its extremely long (2.5-million-km) “arms.” [LISA Consortium]

Looking Ahead to Future Detections

The results from Bortolas and coauthors showed that while the presence of gas can delay a merger, it won’t prevent it altogether. Under the conditions the authors explored, the presence of gas increased the time to the merger by a factor of a few, but all mergers occurred within a few hundred million years.

This is good news for LISA and other gravitational-wave detectors, and there are implications for the non-gravitational-wave detections of these events as well; the presence of gas in the black holes’ surroundings seems to make them pause with just a few light-years between them, increasing the chance that a survey might detect them in this phase.

Citation

“The Competing Effect of Gas and Stars in the Evolution of Massive Black Hole Binaries,” Elisa Bortolas et al 2021 ApJL 918 L15. doi:10.3847/2041-8213/ac1c0c

Tracing Gas in Distant Galaxies

Stars are forming in galaxies near and far, fueled by massive clouds of gas. What can carbon monoxide ­— a familiar but dangerous gas on Earth — tell us about star formation in distant galaxies?

Fuel for Star Formation

A representative-color image of a star-forming region. Huge clouds of molecular gas and dust are punctuated by hundred of background stars. At the center and right-hand side of the image, newly formed stars glow brightly in the cavities they have carved out.

Molecular clouds, like those in the Vela Molecular Cloud Ridge complex pictured here, are the sites of star formation. [NASA/JPL-Caltech/UCLA]

Stars form in huge clouds of molecular hydrogen gas, which are difficult to observe directly. Luckily, these clouds contain smaller amounts of other gases that are easier to detect, like carbon monoxide. While you wouldn’t want to find it in your home, it’s a helpful thing to find in another galaxy; the spectral lines of carbon monoxide are sensitive to the density of the surrounding gas cloud.

The photons emitted by molecules like carbon monoxide make up just one small part of the light we observe from other galaxies. Most of the interstellar radiation field comes from the combined photons from stars, gas, and dust (as well as any background radiation that has passed through the galaxy). The interstellar radiation field contains a huge amount of information about a galaxy’s reservoir of star-forming gas — if we can find a way to extract it.

Gathering Galaxies

In today’s article, a team led by Daizhong Liu (Max Planck Institute for Astronomy, Germany) explores the relationship between emissions from carbon monoxide, the interstellar radiation field, and factors that determine the rate of star formation. 

A plot of flux density, in units of milli-Janskys, versus observed-frame wavelength in microns, for the galaxy PACS-819 at a redshift of 1.4451. The fitted spectral energy distribution peaks at approximately 200 microns and 70 milli-Janskys. The components of the fit peak at 5 microns (stellar), 100 microns (warm dust), and 200 microns (cold dust).

An example of the team’s fitting routine, as applied to observations (blue circles) of distant galaxy PACS-819. The best-fitting model of the galaxy’s spectra energy distribution (black line) is composed of several emission components: stellar (cyan), warm dust (red), cold dust (blue), and radio (purple). [Adapted from Liu et al. 2021]

Liu and coauthors assembled a sample of 76 galaxies for which at least two emission lines from carbon monoxide have been observed, as well as continuum emission from optical to submillimeter wavelengths. Their sample contains galaxies of all kinds, from relatively nearby galaxies (~25 million light-years away) with average rates of star formation to high-redshift starburst galaxies alight with new stars.

In order to understand how emission lines are related to a galaxy’s star-forming capabilities, the authors modeled each galaxy’s spectral energy distribution — the amount of energy emitted at each wavelength — and the strength of its carbon monoxide emission lines. The spectral energy distribution modeling determined the intensity of the interstellar radiation field, while the carbon monoxide modeling demonstrated how the relative strength of the molecule’s emission lines depend on the density and temperature of the surrounding molecular cloud.

A New Item in Our Toolkit

A cigar-shaped band of soft, diffuse light from the plane of M82 is crisscrossed by dark dust clouds.

Spectral lines from carbon monoxide molecules may serve as a useful probe of starburst galaxies, like M82, which have unusually high rates of star formation. [NASA, ESA and the Hubble Heritage Team (STScI/AURA)]

What does this mean for our understanding of star formation in other galaxies? Based on their modeling, Liu and collaborators found that the average intensity of the interstellar radiation field is tightly correlated with the temperature of the reservoir of star-forming gas, which they determined from the observations of carbon monoxide.

While the correlation between radiation field intensity and temperature was linear, the correlation with density was not. This implies that while the star-forming rate may increase smoothly with density and temperature in typical star-forming galaxies, galaxies experiencing bursts of star formation while merging with another galaxy might show huge increases in density without a large increase in temperature. The authors hope that studying carbon monoxide will allow us to probe the star-forming conditions in distant galaxies — an impressive feat for a humble molecule!

Citation

“CO Excitation, Molecular Gas Density, and Interstellar Radiation Field in Local and High-redshift Galaxies,” Daizhong Liu et al 2021 ApJ 909 156. doi:10.3847/1538-4357/abd801

A Better Space Weather Forecasting Tool

High in the Sun’s atmosphere, solar storms are brewing. As magnetic fields twist and coil, they build up enough energy to unleash flares and massive outbursts of plasma into the solar system. For the sake of the thousands of satellites in Earth’s orbit and the well-being our astronauts, we’d like to know when that’s going to happen. How can we predict space weather events?

A gray circle against a black background, speckled with tiny black and white dots. At approximately 30 degrees north and south latitude, there are larger groups of black and white spots. In these areas, there tends to be a black spot directly next to a white spot.

An example of a magnetic field map from Solar Dynamics Observatory. The black areas indicate magnetic field lines that point away from Earth, while the white areas indicate magnetic field areas pointing toward Earth. Each pair of black and white areas roughly corresponds to the location of a sunspot. [NASA/SDO/GSFC]

Signs on the Sun’s Surface

To predict inclement space weather before it happens, scientists need to know the strength and configuration of the magnetic field in the Sun’s upper atmosphere — its chromosphere and corona — where magnetic energy builds up and is released in the form of solar flares and immense eruptions of solar plasma called coronal mass ejections. This region is difficult to observe, so most space weather forecasts use measurements of the magnetic field lower in the Sun’s atmosphere, in the photosphere, instead.

Although these photospheric measurements are plentiful, they’re too far removed from the region where space weather is launched to yield accurate forecasts. In today’s article, a team led by Philip Judge (High Altitude Observatory, National Center for Atmospheric Research) explores other ways to probe the magnetic field structure of the Sun’s upper atmosphere and make better space weather predictions.

Simulation of a region of magnetic flux emerging from the solar photosphere. The altitudes at which several spectral lines are emitted are shown. From lowest to highest altitude: the iron-2 lines at 2769.75, 2746.48, 2739.55, and 2599.39 Angstroms, and the magnesium-2 line. The magnesium-2 spectral line probes up to 15 million meters above the photosphere, approximately the greatest extent of the magnetic flux region.

Simulation of an emerging system of magnetic flux (blue region). The colored lines indicate the altitude at which the individual spectral lines of magnesium and iron form. The simulated spectral lines all probe regions well above the solar photosphere, with the magnesium line probing the highest altitudes. Click to enlarge. [Adapted from Judge et al. 2021]

Precisely Measured Photons

Judge and collaborators combined archival data with simulations to analyze the solar spectrum, hunting for wavelengths emitted by the hot plasma in the Sun’s chromosphere and corona. The authors were interested in finding emission lines sensitive to the Zeeman effect, in which the presence of a magnetic field splits spectral lines into multiple components, and the Hanle effect, in which the presence of a magnetic field randomizes the orientations of the electric fields of the emitted light (in other words, this effect reduces the polarization of the emissions).

The authors highlighted near-ultraviolet emissions from magnesium and iron in the 256–281-nm range as the best for studying the sources of solar eruptions, since these wavelengths arise from high in the Sun’s atmosphere. By modeling the polarization of magnesium lines in this wavelength range, Judge and collaborators demonstrate that observations of this portion of the Sun’s spectrum can probe a large range of magnetic field strengths and orientations — key for predicting when and where solar flares and coronal mass ejections will occur.

A long, skinny rocket launched into space, trailed by puffy white exhaust clouds. In the foreground, there is a chain-link fence, a telephone pole, and some scraggly bushes.

CLASP-2 made the first measurement of polarized emission from magnesium at ultraviolet wavelengths. [US Army]

A New Eye on the Sun?

Although the authors demonstrate that this wavelength range is a promising window into the Sun’s magnetic field configuration, exploring it requires a space telescope to perform an exacting technique called spectropolarimetry — measuring the polarization of individual wavelengths of light — and extract the desired magnetic-field information.

Though this technique is relatively new in solar physics, Judge and coauthors point to a 2019 sounding-rocket experiment, Chromospheric LAyer SpectroPolarimeter 2 (CLASP-2), which made spectropolarimetric measurements of the Sun during the 6 minutes it was high in Earth’s atmosphere, as a proof of concept. The authors suggest that even a small (~25-cm) space telescope would suffice, greatly improving our ability to forecast space weather events.

Citation

“Measuring the Magnetic Origins of Solar Flares, Coronal Mass Ejections, and Space Weather,” Philip Judge et al 2021 ApJ 917 27. doi:10.3847/1538-4357/ac081f

ALMA

Large galaxies host supermassive black holes at their centers. While studying these central black holes in nearby galaxies, we’ve discovered that the masses of the black holes can be tied to certain properties of their host galaxies. But is this still true for more distant galaxies, which we see as they were when the universe was younger?

quasar

Artist’s illustration of a distant quasar surrounded by a swirling, superheated accretion disk. [NOIRLab/NSF/AURA/J. da Silva]

Tying Black Holes and Galaxies Together

The observed relation between black hole mass and host galaxy properties is nothing to sneeze at! It suggests a particular evolution process for both the galaxy and its black hole, which could tell us about how galaxies even formed to begin with.

Notable galaxy properties that seem to be tied to black hole mass are stellar velocity dispersion — how stars move about the galaxy — and bulge mass, or the mass of stars densely clustered near the center of the galaxy. These properties both involve stars, and the most significant way a central black hole can impact star formation in its host is when it’s an active galactic nucleus, gorging on nearby material and spitting large amounts of energy out into space. When the black hole is in this violent phase, it can push star-forming material out of the galaxy and slow down star formation overall. But when and for how long do active galactic nuclei affect their galaxies like this?

The y-axis runs from 10^7 to 10^10 solar masses, while the x-axis runs from 10^10 solar masses to nearly 10^12 solar masses. The dashed line is bounded by a translucent gray rectangle to indicate undercentaity. The dotted line intersects the dashed line at about (4 x 10^10, 2 x 10^8). Shapes are arrayed across the plot with different uncertainties and upper and lower limits on both dimensions. The latter are shown with arrows pointing in the relevant direction. Red shapes are brighter while blue shapes are dimmer. The star shape for J1243+0100 is located at (6 x 10^10, 3 x 10^8), while the square is located at (2 x 10^10, 2 x 10^8).

Central black hole mass and galaxy dynamical mass — the mass of the galaxy as determined by its internal motion — for quasars at redshifts ≥ 6, when the universe was just under a billion years old. The dashed and dotted lines are predicted relations between black hole mass and dynamical mass based on observations and simulations, respectively. Non-circular shapes correspond to J1243+0100 and two other quasars at similar distance. Click to enlarge. [Izumi et al. 2021]

The answer lies in looking at distant galaxies, which we see as they were when the universe was younger. Active galactic nuclei don’t seem terribly numerous when the universe was 2 billion years old, so we need to look back even further. A recent study led by Takuma Izumi (National Astronomical Observatory of Japan/The Graduate University for Advanced Studies, SOKENDAI, Japan) examines a galaxy from when the universe was less than a billion years old, and probes whether the relation between black hole mass and host galaxy properties still holds.

Information from the Infrared

The galaxy in question hosts the quasar J1243+0100, which was identified in a Subaru Telescope survey. Quasars are the most active sort of active galactic nuclei, but J1243+0100 is one of the least energetic distant quasars ever observed. This means it might have settled into the state that produces the observed relation between black hole mass and galaxy properties.

J1243+0100 was discovered in optical observations, so to learn more about it Izumi and collaborators used far infrared observations taken by the Atacama Large Millimeter/submillimeter Array (ALMA). These observations were sensitive to broad infrared radiation from J1243+0100 and its host galaxy as well as a particular spectral feature called [C II], which is associated with carbon. The broad infrared radiation and [C II] can tell us about the internal motions of J1243+0100’s host and how rapidly stars are being formed.

ALMA observations of the broad infrared emission from J1243+0100 (left) and its [C II] emission (right). The black cross in both images is centered on the most intense broad infrared emission. [Izumi et al. 2021]

Izumi and collaborators found that J1243+0100’s host likely has a compact bulge, which places it nicely on the expected relation with black hole mass. The star formation rate suggests the galaxy could be aging into the state we observe older, more evolved galaxies in. Izumi and collaborators also found signs of a massive outflow of material powered by J1243+0100, which could quell extensive star formation.

The bottom line is that the relation between central black hole mass and galaxy properties likely fell into place very early in the universe. Of course, only one object was covered in this study, but there are many other viable quasars that ALMA will observe in the future.

Citation

“Subaru High-z Exploration of Low-luminosity Quasars (SHELLQs). XIII. Large-scale Feedback and Star Formation in a Low-luminosity Quasar at z = 7.07 on the Local Black Hole to Host Mass Relation,” Takuma Izumi et al 2021 ApJ 914 36. doi:10.3847/1538-4357/abf6dc

Illustration of the Milky Way with a spot in one arm identified. A zoom-in inset shows a spherical grid in which two molecular clouds are plotted.

Astronomers have long suffered from the challenge of studying a 3D universe through its 2D projection on our sky. But as technology has improved, astronomers are making use of richer data spanning more dimensions. Why shouldn’t the way we view their work span new dimensions, too?

Two new studies of star forming clouds have expanded into the 3D universe — and now you can explore their results in 3D, too.

Taurus molecular cloud

The Taurus molecular cloud (shown here as observed at millimeter wavelengths by the APEX telescope) is a well-known star-forming region. But what does its structure look like in three dimensions? [ESO]

3D Maps of Molecular Clouds

Stars are born within dense clouds of molecular gas — so to better understand star formation, we need to study how molecular clouds form and evolve. But while we can view projections of the molecular clouds that are in our local environment, understanding their full 3D layout is a trickier prospect.

New observatories and innovative computational and statistical techniques are key for translating 2D data into 3D. By combining precise distance measurements to nearby stars — made possible by the incredible precision of missions like Gaia — with measurements of extinction caused by dust between us and the stars, we can build detailed 3D pictures of how this dust is distributed around us.

In a new publication led by Catherine Zucker (Center for Astrophysics | Harvard & Smithsonian), a team of scientists has now used these dust maps to analyze the 3D spatial structure and thicknesses of nearby star forming regions for the first time. By by working in three dimensions, Zucker and collaborators are able to map out the full volume structure of the molecular clouds that lie within 1,300 light-years of us.

A Surprise Bubble Between Perseus and Taurus

Two panels show two different views of modeled data representing the perseus and taurus molecular clouds: a "front" view from earth, and a "side" view.

When viewed from Earth (top panel), the Taurus (blue) and Perseus (red) molecular clouds look like they’re right next to each other. But when viewed from the side, it becomes evident that these clouds lie on opposite sides of a spherical void (bottom panel). You can explore this yourself with the interactive figure and AR integration available in the article. [Adapted from Bialy et al. 2021]

This analysis adds a new dimension (literally) to our view of the nearby birthplaces of stars — but what can we learn from it? In a partner publication led by Shmuel Bialy (also at the Center for Astrophysics), researchers analyzed the 3D structure of two well-known nearby molecular clouds — Perseus and Taurus — that had previously only been studied in projection.

By mapping out the clouds in 3D, Bialy and collaborators discovered that while Perseus and Taurus appear to touch each other in the plane of our sky, Taurus is actually nearly 500 light-years closer to us than Perseus. Exploring the clouds in 3D, it becomes evident that they actually form opposite sides of a bubble-like spherical void.

The authors show that these clouds likely formed as the result of a shockwave sent out by one or several supernovae that exploded at the center of the void roughly 10 million years ago. Thus, the Perseus and Taurus molecular clouds — birthplaces of future stars — are the direct result of previous stellar death.

Data Visualization of the Future

These studies demonstrate the value of being able to work in three dimensions to map out structures in our universe. But can we, as readers, still only find out about this research via flat, 2D scientific papers?

Not so! AAS journals have long supported other ways of presenting data in online journal articles, including via videos and interactive figures. The recent works by Zucker, Bialy, and collaborators include interactive figures as a means of exploring the authors’ data, but they also introduce a new option: Bialy et al. 2021 is the first AAS journal article to include augmented reality (AR) integration.

Want to project the data on your living room floor, and walk around it to view it from different angles? That’s an option — all you have to do is use your smartphone to scan in the QR code that’s in the article. Want to hold star formation in the palm of your hand? You can do that too, via integration with new technology like Merge Cube.

Check out the video below to learn more about these studies and how you can interact with the data. And expect to keep seeing new rich, interactive visualizations over here at AAS journals, as our authors keep pushing analysis and presentation of scientific data into the future.

Citation

“On the Three-Dimensional Structure of Local Molecular Clouds,” Catherine Zucker et al 2021 ApJ 919 35. doi:10.3847/1538-4357/ac1f96

“The Per-Tau Shell: A Giant Star-Forming Spherical Shell Revealed by 3D Dust Observations,” Shmuel Bialy et al 2021 ApJL 919 L5. doi:10.3847/2041-8213/ac1f95

Photograph of the sun that shows a bright region on the right limb.

Solar activity sometimes stays trapped close to the Sun’s surface — but sometimes it breaks free in enormous ejections of hot plasma. What determines whether a solar flare stays confined or is followed by a catastrophic eruption? A new study reveals clues.

A Flare Conundrum

image of a roiling surface with complex magnetic structures including holes and filaments.

False-color H-alpha image of an active region on the Sun’s surface. The Earth is provided in the corner for scale. Click to enlarge. [Dutch Open Telescope]

During the rise of the Sun’s 11-year solar cycle, its surface transitions from quiet calm to a roiling environment containing active regions — temporary areas where the strong and complex magnetic field is disturbed. These active regions release magnetic energy in the form of solar flares, the largest of which are often — but not always — associated with coronal mass ejections (CMEs), significant expulsions of hot plasma and magnetic fields into interstellar space.

At the height of the solar cycle, when active regions are more common, the Sun expels around three CMEs per day — and the most violent of these can disrupt radio transmissions on Earth, damage satellites in orbit, and even produce power outages. To predict these catastrophic eruptions, it’s critically important that we better understand the origin of CMEs and how they are launched from active regions.

So what determines whether a solar flare stays confined to the Sun’s surface, or whether it’s associated with an eruptive CME? A new study led by Ting Li (National Astronomical Observatories, Chinese Academy of Sciences) now further explores how the fate of a flare may be influenced by the active region where it originates.

Image of the solar disk with black and white regions colored on the sun's surface, indicating magnetic fields.

An example of a full-disk solar magnetogram produced by HMI. [NASA/SDO]

Digging Into the Data

Li and collaborators analyzed observations of more than 700 solar flares cataloged by the Geostationary Operational Environmental Satellite (GOES) system between 2010 and 2019. The authors compared these data to CME catalogs from satellites like the Solar and Heliospheric Observatory (SOHO) to determine which flares were associated with eruptions and which ones stayed confined.

The team then explored the properties of the active regions that produced these flares. For each flare, Li and collaborators used corresponding vector magnetograms — images that trace the 3D magnetic field on the solar disk — from the Helioseismic and Magnetic Imager (HMI) to calculate the total magnetic flux passing through the active regions just before flare onset.

To Trap an Eruption

Plot of CME association rate vs. flare intensity, showing five lines of different slopes.

The relation between the flare–CME association rate (i.e., what percentage of flares are accompanied by CMEs) and flare intensity is plotted here for five different bins of active region total magnetic flux (different colors). For each bin, CMEs are more common for larger flares. But the slope of the relation is steeper for smaller active region flux, which means a flare of a given intensity is more likely to be confined if the active region flux is larger. Click to enlarge. [Adapted from Li et al. 2021]

Unsurprisingly, Li and collaborators found that larger flares are more likely to be connected with an ensuing CME, whereas smaller flares are more likely to stay confined.

But they also determined that the total magnetic flux of the active region plays an important role in determining the eruptive character of solar flares. As the flux of the active region increases, the slope of the relationship between flare intensity and the flare–CME association rate becomes less steep.

What does this mean? For a given flare intensity, the flare is more likely to come with an eruptive CME if its active region has less magnetic flux. More magnetic flux means that there’s stronger confinement of the flare by an overlying background field, preventing it from erupting.

These results provide a valuable framework for understanding the flare–CME connection, not just on the Sun, but also on other solar-type stars in the galaxy — thus bringing us a step closer to being able to predict the potential impacts of flaring activity in our solar system and other planetary systems like it.

Citation

“Magnetic Flux and Magnetic Nonpotentiality of Active Regions in Eruptive and Confined Solar Flares,” Ting Li et al 2021 ApJL 917 L29. doi:10.3847/2041-8213/ac1a15

1 42 43 44 45 46 111