
Astronomers have long suffered from the challenge of studying a 3D universe through its 2D projection on our sky. But as technology has improved, astronomers are making use of richer data spanning more dimensions. Why shouldn’t the way we view their work span new dimensions, too?
Two new studies of star forming clouds have expanded into the 3D universe — and now you can explore their results in 3D, too.
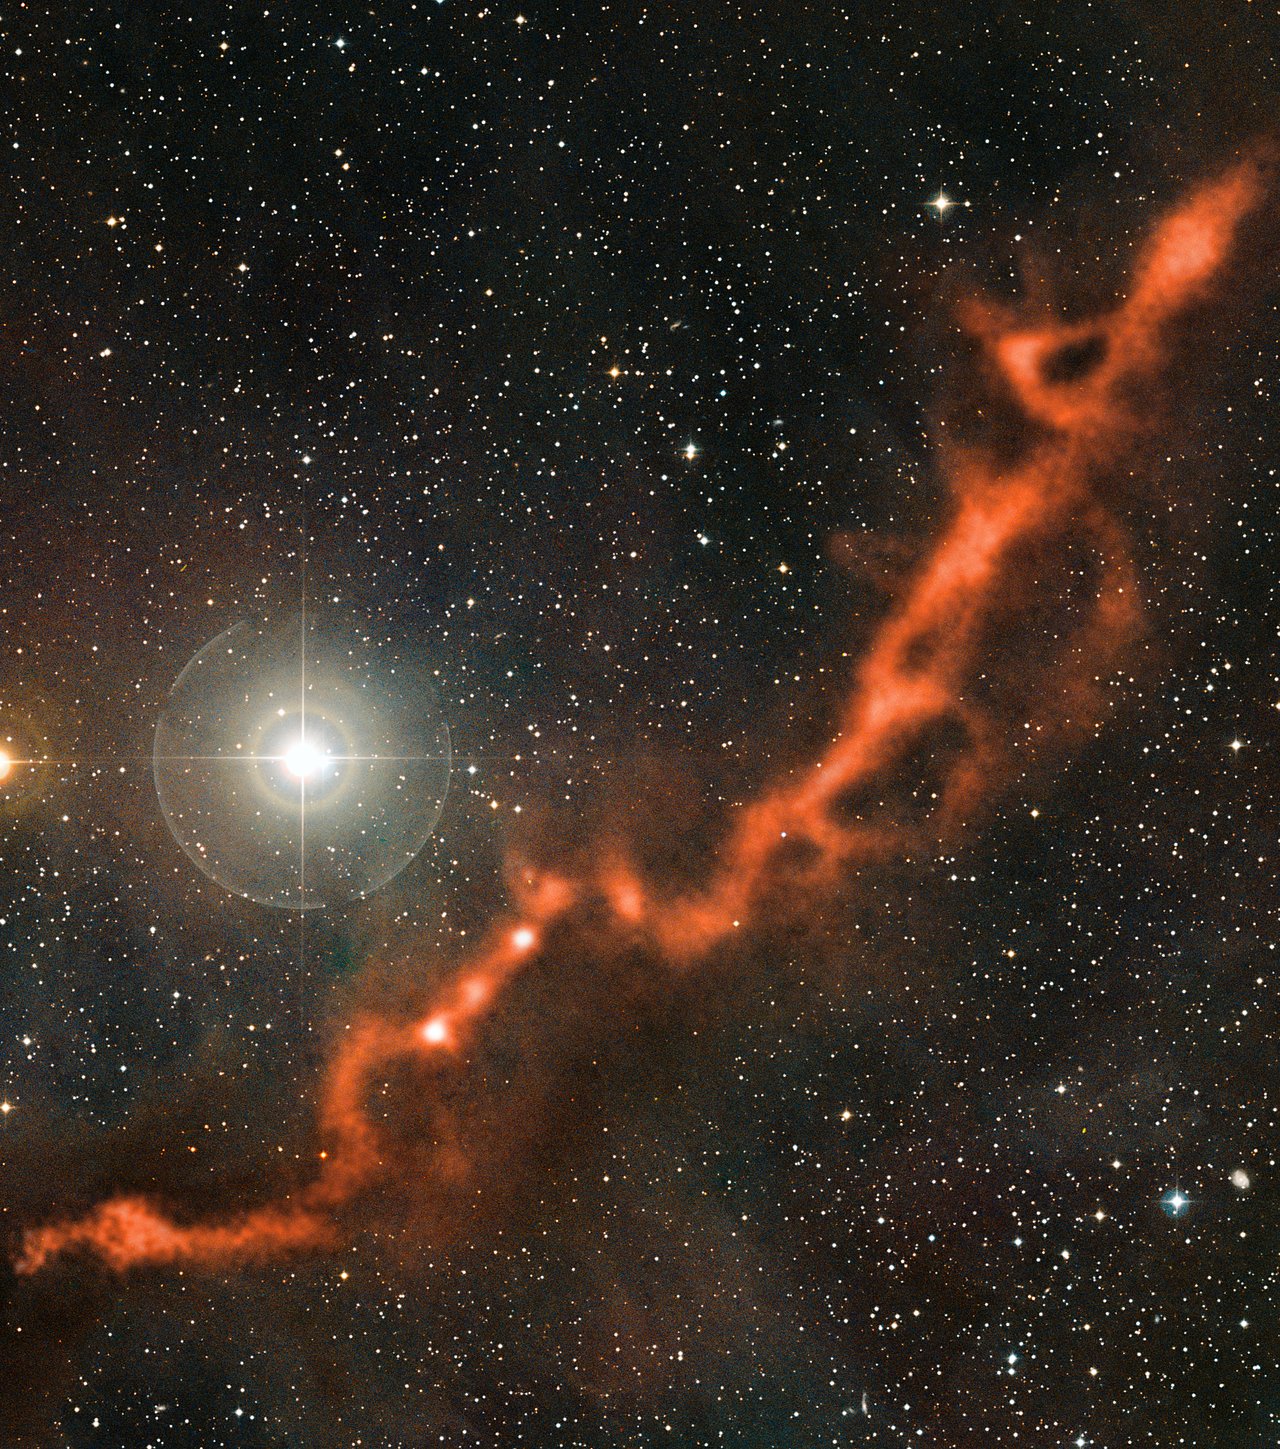
The Taurus Molecular Cloud, as viewed in millimeter wavelengths by the APEX telescope. [ESO/APEX (MPIfR/ESO/OSO)/A. Hacar et al./Digitized Sky Survey 2. Acknowledgment: Davide De Martin; CC BY 4.0]
3D Maps of Molecular Clouds
Stars are born within dense clouds of molecular gas — so to better understand star formation, we need to study how molecular clouds form and evolve. But while we can view projections of the molecular clouds that are in our local environment, understanding their full 3D layout is a trickier prospect.
New observatories and innovative computational and statistical techniques are key for translating 2D data into 3D. By combining precise distance measurements to nearby stars — made possible by the incredible precision of missions like Gaia — with measurements of extinction caused by dust between us and the stars, we can build detailed 3D pictures of how this dust is distributed around us.
In a new publication led by Catherine Zucker (Center for Astrophysics | Harvard & Smithsonian), a team of scientists has now used these dust maps to analyze the 3D spatial structure and thicknesses of nearby star forming regions for the first time. By by working in three dimensions, Zucker and collaborators are able to map out the full volume structure of the molecular clouds that lie within 1,300 light-years of us.
A Surprise Bubble Between Perseus and Taurus
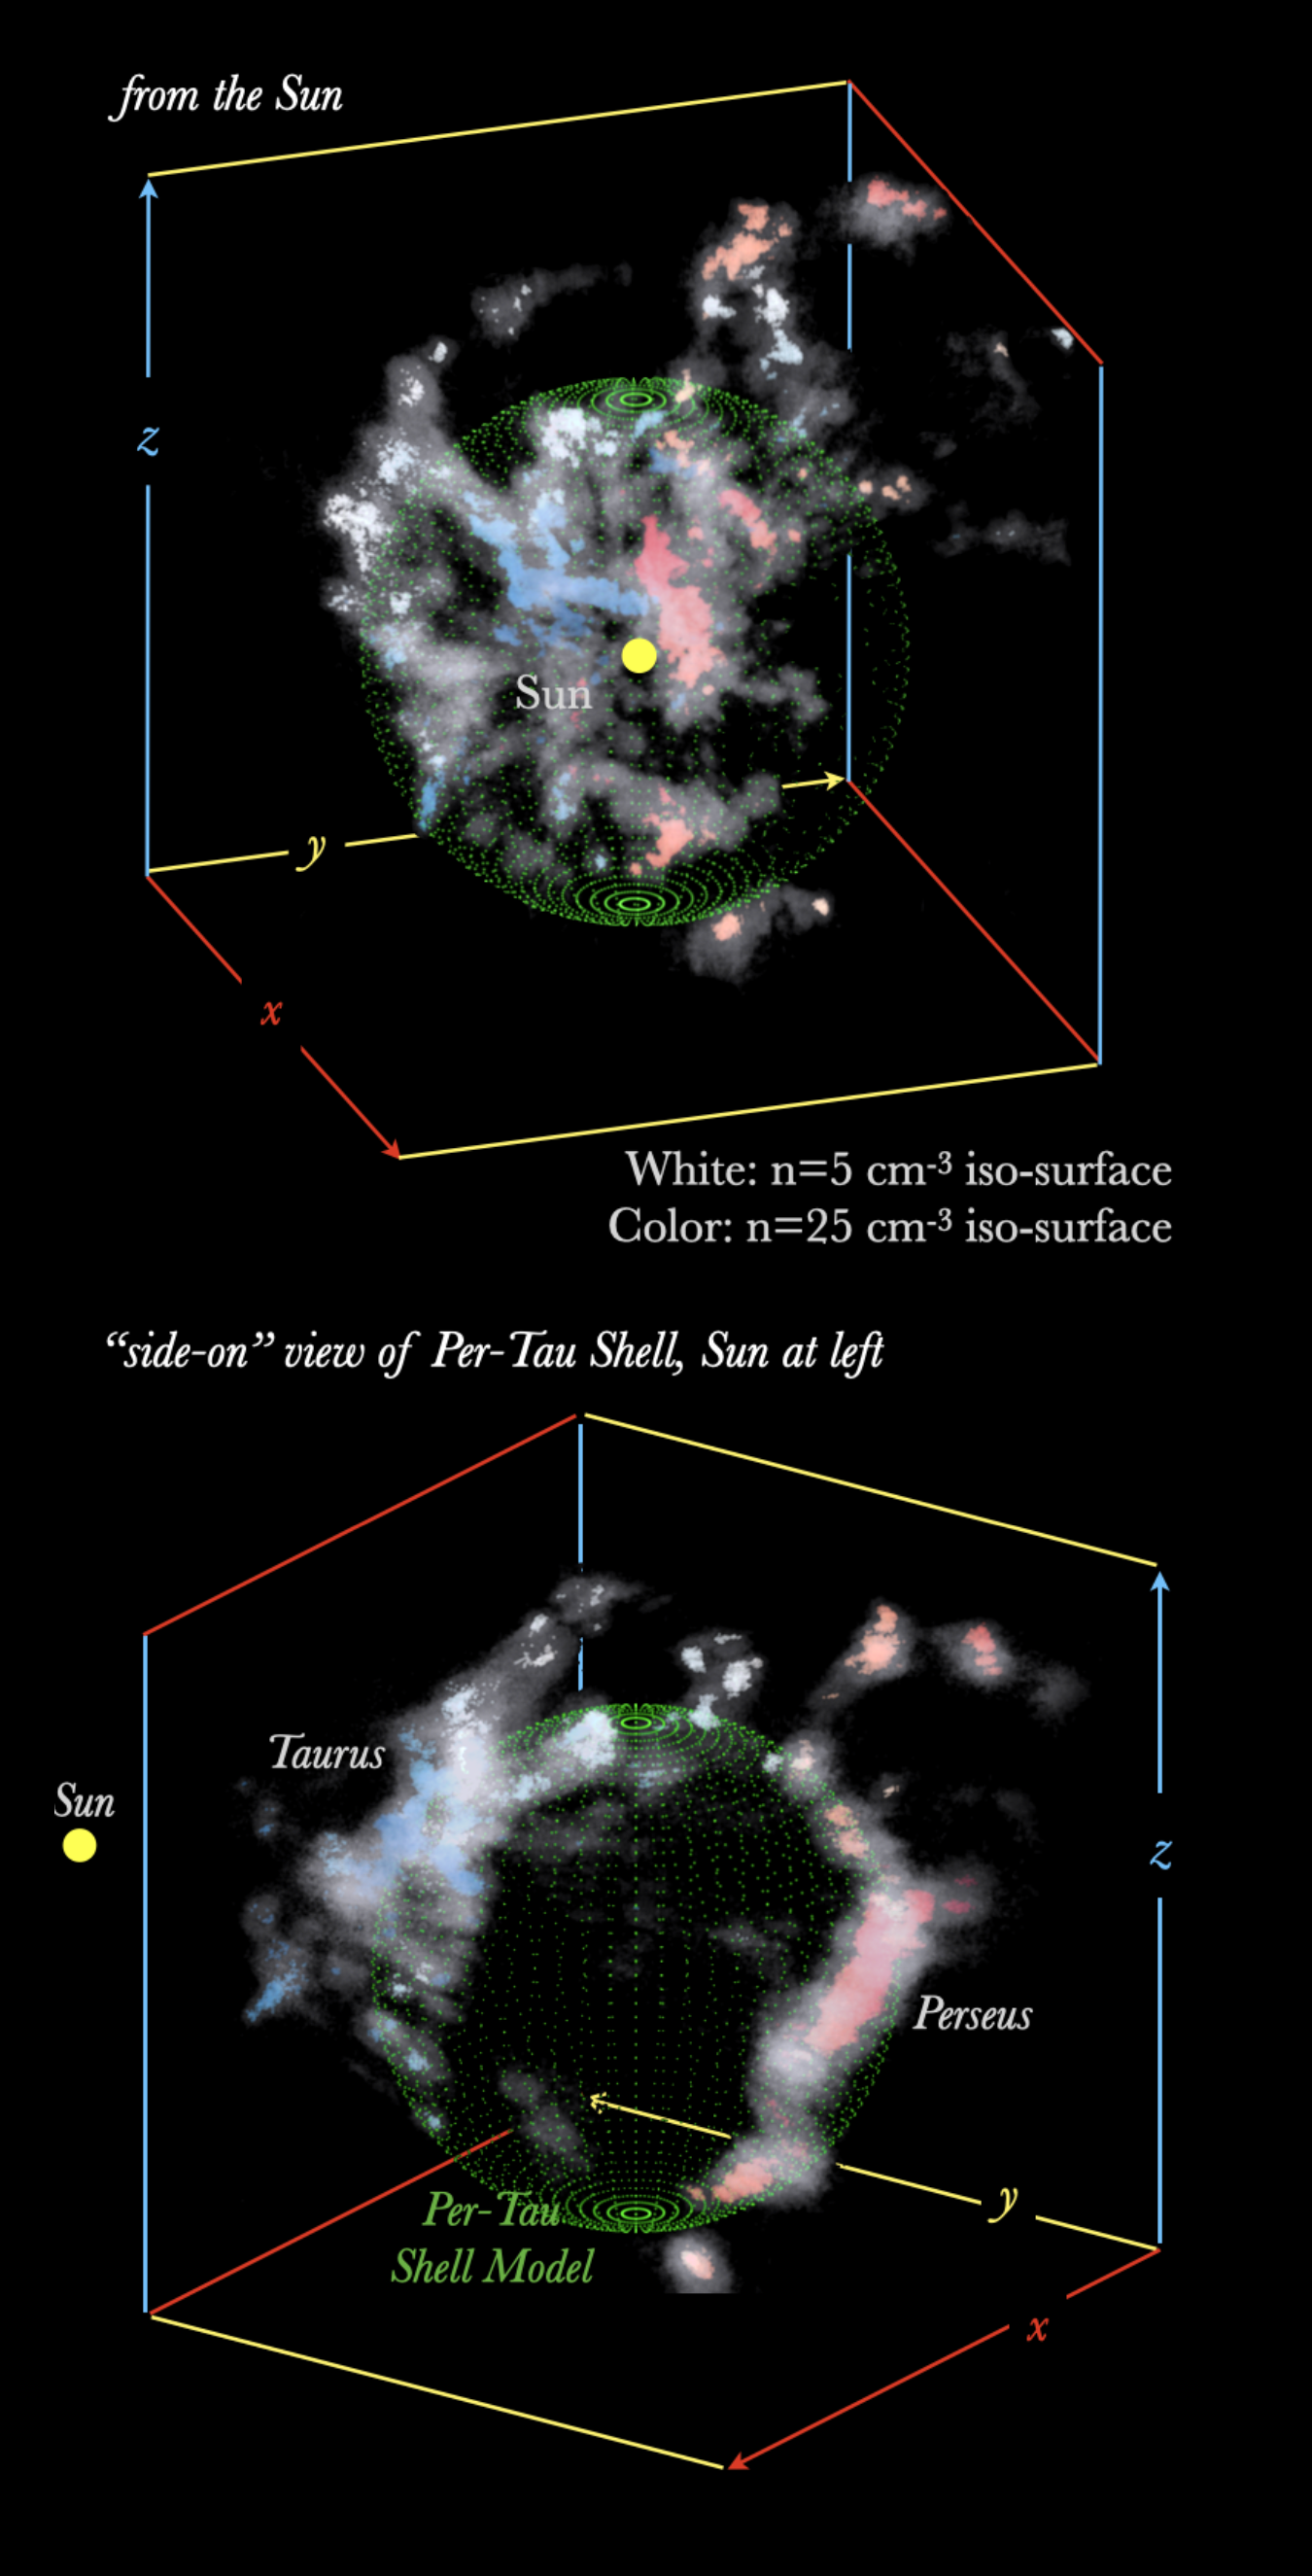
When viewed from Earth (top panel), the Taurus (blue) and Perseus (red) molecular clouds look like they’re right next to each other. But when viewed from the side, it becomes evident that these clouds lie on opposite sides of a spherical void (bottom panel). You can explore this yourself with the interactive figure and AR integration available in the article. [Adapted from Bialy et al. 2021]
By mapping out the clouds in 3D, Bialy and collaborators discovered that while Perseus and Taurus appear to touch each other in the plane of our sky, Taurus is actually nearly 500 light-years closer to us than Perseus. Exploring the clouds in 3D, it becomes evident that they actually form opposite sides of a bubble-like spherical void.
The authors show that these clouds likely formed as the result of a shockwave sent out by one or several supernovae that exploded at the center of the void roughly 10 million years ago. Thus, the Perseus and Taurus molecular clouds — birthplaces of future stars — are the direct result of previous stellar death.
Data Visualization of the Future
These studies demonstrate the value of being able to work in three dimensions to map out structures in our universe. But can we, as readers, still only find out about this research via flat, 2D scientific papers?
Not so! AAS journals have long supported other ways of presenting data in online journal articles, including via videos and interactive figures. The recent works by Zucker, Bialy, and collaborators include interactive figures as a means of exploring the authors’ data, but they also introduce a new option: Bialy et al. 2021 is the first AAS journal article to include augmented reality (AR) integration.
Want to project the data on your living room floor, and walk around it to view it from different angles? That’s an option — all you have to do is use your smartphone to scan in the QR code that’s in the article. Want to hold star formation in the palm of your hand? You can do that too, via integration with new technology like Merge Cube.
Check out the video below to learn more about these studies and how you can interact with the data. And expect to keep seeing new rich, interactive visualizations over here at AAS journals, as our authors keep pushing analysis and presentation of scientific data into the future.
Citation
“On the Three-Dimensional Structure of Local Molecular Clouds,” Catherine Zucker et al 2021 ApJ 919 35. doi:10.3847/1538-4357/ac1f96
“The Per-Tau Shell: A Giant Star-Forming Spherical Shell Revealed by 3D Dust Observations,” Shmuel Bialy et al 2021 ApJL 919 L5. doi:10.3847/2041-8213/ac1f95