Features RSS

Photograph of the aurora taken from the International Space Station

Geomagnetic storms — disturbances in Earth’s protective magnetic shield caused by oncoming solar particles — can have real-world consequences. A recent research article explores how machine learning can be used to create an early warning system for these events.

Geomagnetic Storms on the Horizon

photograph of the solar corona

The ghostly solar corona and a billowing coronal mass ejection (right side of the image) emerge from behind a coronagraph that blocks the Sun from view in this image from the Solar and Heliospheric Observatory. [SOHO (ESA & NASA)]

A spacecraft at a distant vantage point glimpses a tangled mass of plasma and magnetic fields emerging from the Sun — a coronal mass ejection — headed our way. It’ll be hours or days before the coronal mass ejection collides with Earth, potentially disrupting radio communications, damaging spacecraft electronics, and threatening power grids. How can we predict if a coronal mass ejection will cause these disastrous consequences?

In a recent publication, a team led by Andreea-Clara Pricopi (Technical University of Cluj-Napoca, Romania) tested the ability of machine learning to predict whether a coronal mass ejection will disrupt Earth’s magnetic shield. This technique may provide a way to anticipate geomagnetic storms days in advance.

An Expansive Sample

Machine learning is a relatively new technique in which computers are trained on a set of inputs with known outcomes. The trained computer can then predict the outcomes of a fresh set of inputs.

Pricopi and collaborators took as inputs the speed, angle, and acceleration of coronal mass ejections identified in white-light images, as well as a measure of the overall solar flare activity. The corresponding output is a measure of how disrupted Earth’s magnetic field became, known as the disturbance storm time index. The team trained the model on these inputs and outputs for a subset of 24,403 coronal mass ejections observed between 1996 and 2014, 172 (0.7%) of which caused geomagnetic storms.

illustration of solar particles impinging on the magnetosphere

Artist’s impression of solar particles interacting with Earth’s protective magnetic shield, or magnetosphere, causing a geomagnetic storm. [NASA]

Because so few of the coronal mass ejections in the sample caused geomagnetic storms, Pricopi and collaborators had to be careful about assessing the model’s performance — after all, a model that simply labeled all 24,403 events as not causing a storm would be 99.3% accurate, but it would be useless as a predictor of geomagnetic storms! The team also wanted to be sure that their model correctly predicted all or most storms, even at the risk of false alarms, since the consequences of failing to prepare for a damaging geomagnetic storm are worse than preparing for a storm that never comes.

Prioritizing Powerful Events

Pricopi and coauthors trained their models on 80% of the data set, reserving the remaining 20% for testing the models’ performance. In order to push the models to prioritize finding geomagnetic storms, the team tested several strategies, including penalizing models that misclassified these events and creating synthetic storms based on real data to bulk up the sample size.

visualization of the model output

A visualization of the best model’s performance on the 20% of the data set reserved for testing. The color of the symbols indicates whether the model result was a true negative (TN, blue), false positive (FP, yellow), true positive (TP, green), or false negative (FN, red). Click to enlarge. [Pricopi et al. 2022]

The best model correctly predicted about 80% of storms. The storms overlooked by the model tended to have poor quality data, and false alarms were most common for certain types of coronal mass ejections, giving clues as to how the model might be improved in the future.

These results show that machine learning can be used to predict geomagnetic storms days in advance using a limited number of inputs. However, the authors acknowledge that models that incorporate data from later in a coronal mass ejection’s evolution are more accurate. This suggests that the technique described in this work could be used to flag potentially damaging events, passing them to more precise models to get more information and improve our ability to prepare for an oncoming storm.

Citation

“Predicting the Geoeffectiveness of CMEs Using Machine Learning,” Andreea-Clara Pricopi et al 2022 ApJ 934 176. doi:10.3847/1538-4357/ac7962

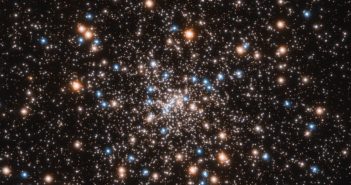
Hubble Space Telescope image of the globular cluster NGC 6397

Astronomers have discovered a second millisecond pulsar — a rapidly spinning, ultra-dense remnant of a massive star — in one of the nearest globular clusters to Earth. The new observations might help explain the surprising rarity of millisecond pulsars discovered in dense globular clusters.

Close Encounters of the Stellar Kind

animation still of a millisecond pulsar

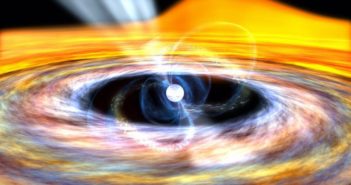
Still image from an animation of a millisecond pulsar accreting material from its companion. [NASA]

In the cores of globular clusters, where gravitational encounters between stars are common, compact remnants of massive stars form binary systems with a wide range of properties. This sets the stage for the formation of millisecond pulsars: tiny, dense, rapidly spinning stellar remnants composed entirely of neutrons. All pulsars spin incredibly fast, but millisecond pulsars are the fastest of them all; if you stood on the equator of the speediest known millisecond pulsar, you’d whirl around at 24% of the speed of light. Astronomers believe that most millisecond pulsars started out as more slowly rotating solo acts, but after gaining a stellar companion, pulsars accrete matter and get spun up to “millisecond” status.

Nearby globular cluster NGC 6397 — a glittering, spherical collection of 400,000 stars — is home to a curious binary system that has been detected at X-ray, optical, and ultraviolet wavelengths. Its X-ray emission flashes with the period of the binary orbit, and optical observations show a red star at the same location. Previous research has suggested that this system contains a millisecond pulsar, but the characteristic radio pulses have been elusive.

plot of the radio pulses of the newly confirmed pulsar

Left: Phase-folded radio observations from the Parkes Telescope, showing the characteristic radio signal of the newly confirmed pulsar. Right: Timing residuals as a function of orbital phase. The pulsar is not visible when the phase is between 0 and 0.5 and the pulsar is farthest from the observer. Click to enlarge. [Zhang et al. 2022]

In Pursuit of a Pulsar

In a new article, a team led by Lei Zhang (Chinese Academy of Sciences and Swinburne University of Technology, Australia) reports the results of their observations of the system made between 2019 and 2022 using the Parkes (Murriyang) radio telescope in Australia and the MeerKAT array in South Africa. Zhang and collaborators discerned faint but detectable radio pulses every 5.8 milliseconds, and the pulses were modulated with a period of 1.97 days — the same period as the orbital period of the X-ray-emitting binary system at the same location.

This confirms that the system contains a millisecond pulsar, dubbed NGC 6397B, and further analysis of the timing of the pulses suggests that the pulsar is also the source of the X-ray emission detected previously.

Implications of an Intermittent System

plot of orbital period versus companion mass for known millisecond pulsars

Orbital period and companion mass for millisecond pulsars (MSPs) discovered in globular clusters (filled circles) and in the field (empty circles). The black and gray symbols indicate whether the companion is a white dwarf (WD), main-sequence star (MS), or an ultralight or planet-mass object (UL). Click to enlarge. [Zhang et al. 2022]

Even after the team tracked down the elusive pulsar, it still managed to give them the slip; the radio pulses became undetectable for 14 months before reemerging in early 2022. The system’s on-again off-again radio emission could point to one of two possibilities: hot, ionized gas flowing out from the companion star could be blocking the radio emission from reaching us when the binary system swings into certain orientations, or the act of accreting material from the companion star — the process that generates the X-rays — could temporarily halt the pulsar’s radio emission.

Previous research has suggested that pulsars in binary systems should be common in globular clusters with exceptionally dense cores, like NGC 6397, but most known pulsars in so-called core-collapse clusters are singletons. The particulars of the newly discovered system may provide an explanation as to why pulsar-hosting binary systems have been elusive in these environments: pulsars in binary systems might have faint or intermittent radio emission, making them hard to track down.

Citation

“Radio Detection of an Elusive Millisecond Pulsar in the Globular Cluster NGC 6397,” Lei Zhang et al 2022 ApJL 934 L21. doi:10.3847/2041-8213/ac81c3

European Southern Observatory image of the spiral galaxy NGC 6744

Milky Way–like galaxies are abundant in the universe. A recent publication scours astronomical surveys to understand how these familiar spirals grow over billions of years.

How Does Your Galaxy Grow?

visible-light image of hundreds of galaxies

A field of galaxies from the Cosmic Assembly Near-infrared Deep Extragalactic Legacy Survey. Click to enlarge. [NASA, ESA, P. Oesch and I. Momcheva (Yale University), and the 3D-HST and HUDF09/XDF Teams]

In the first billion years after the Big Bang, galaxies began to form. But how the earliest galaxies evolved into those we see in the local universe today is still up for debate. One facet of this question is the growth of galaxies’ stellar mass — the amount of mass locked up in stars as opposed to gas clouds or dark matter. A galaxy’s stellar mass grows over time as gas clouds collapse to form stars, but it’s not yet clear how this growth proceeds; are galactic centers early hubs of star formation, do the outskirts skirt out ahead, or do all regions gain stellar mass at a similar rate?

In a recent study, a team led by Maryam Hasheminia (Shiraz University and Institute for Advanced Studies in Basic Sciences) turned to survey data to understand how the Milky Way and galaxies like it grew into the galaxies they are today.

Size evolution of Milky Way–like galaxies selected using the first method (red), the second method (blue), and from cosmological simulations (green). The quantities r20, r50, and r80 are the radii within which 20%, 50%, and 80% of the galaxies’ stellar mass is contained, respectively. [Adapted from Hasheminia et al. 2022]

Looking for Lookalikes

When we observe galaxies as they existed billions of years ago, how do we know which galaxies will grow to look like the Milky Way? Hasheminia and collaborators used two methods to pick Milky Way–like galaxies out of the Cosmic Assembly Near-infrared Deep Extragalactic Legacy Survey (CANDELS) and the 3D-Hubble Space Telescope survey.

In the first method, the team assumed that Milky Way–type galaxies follow the observed relationship between galactic stellar mass and star formation rate for galaxies that are actively forming stars, and the authors selected galaxies out of the survey data that followed that relation. In the second method, the team matched the stellar masses and ages of galaxies in the survey data to the stellar growth history of the Milky Way as derived from chemical evolution models.

Self-Similar Growth

Evolution of the half-mass radius (r50) of Milky Way–like galaxies with increasing stellar mass. [Adapted from Hasheminia et al. 2022]

Hasheminia and collaborators then studied how the stellar masses of the selected galaxies evolved over time and compared their findings against results from cosmological simulations. Both methods showed that the half-mass radius — the radius within which half a galaxy’s stars (by mass) are contained — of Milky Way–like galaxies has changed little over the past 10 billion years.

The results indicate that all parts of these galaxies gain stellar mass at a similar rate. This contrasts with the hypothesis of inside-out growth, in which star formation ramps up in the center of a galaxy first before spreading to the outer regions, as well as the results of cosmological simulations; simulations matched the team’s findings early in the history of the universe, but they diverged around 6 billion years ago.

The team suggests that their findings are consistent with previous Milky Way evolution scenarios, in which a thick disk of stars formed when the universe was about 6 billion years old, before star formation stalled and a bar of stars formed in the center of the galaxy. To fully unravel the growth history of the Milky Way and galaxies like it, we’ll need high-resolution observations of galaxies in the distant past — and with JWST, such observations are in our future!

Citation

“No Evolution in the Half-mass Radius of Milky Way–type Galaxies over the Last 10 Gyr,” Maryam Hasheminia et al 2022 ApJL 932 L23. doi:10.3847/2041-8213/ac76c8

1.25 mm continuum image of the protoplanetary disk AS 209

Astronomers may have found a gaseous disk around a planet orbiting the young star AS 209. This is one of just four circumplanetary disk candidates discovered so far, and these observations enable the first mass estimate of a circumplanetary disk’s gas.

Views of AS 209 in emission from (clockwise from top left) CO, HCN, C2H, HC3N, and H2CO. Click to enlarge. [Adapted from Öberg et al. 2021]

Disks within Disks

The disks of gas and dust that collect around young stars are the sites of planet formation. Thanks to high-resolution radio observations from instruments like the Atacama Large Millimeter/submillimeter Array (ALMA), we can study these disks in incredible detail and attempt to catch planet formation in the act.

Recently, researchers used ALMA to observe five nearby circumstellar disks at high resolution as part of the Molecules with ALMA at Planet-forming Scales (MAPS) observing program. Using MAPS data, a team led by Jaehan Bae (University of Florida) finds evidence that the 1.6-million-year-old star AS 209 hosts a disk within a disk — a circumplanetary disk around a hidden planet orbiting far from the central star.

A Planet, Perhaps?

Bae and collaborators analyzed new ALMA observations of radio emissions from three forms of carbon monoxide gas and archival observations of 1.25-millimeter dust emission. Several pieces of evidence suggest that the team has detected carbon monoxide gas belonging to a circumplanetary disk within the larger disk surrounding AS 209:

  1. The location of the circumplanetary disk (CPD) candidate in the 13CO observations. [Adapted from Bae et al. 2022]

    The carbon monoxide (12CO) observations reveal a 78-au-wide gap in the gas of AS 209’s disk at a distance of 200 au from the central star, in the same location as a gap seen in scattered-light images of the disk. This suggests that a young planet is carving a gap in the disk.
  2. The 12CO data show localized changes in the velocity of the gas near this gap, which can result from an embedded planet disturbing the gas of the disk.
  3. The 13CO observations show a point source 206 au from the central star — right in the middle of the 12CO gap and close to the velocity perturbations. Given ALMA’s resolving power, the point-like nature of the object indicates that it is no larger than 14 au in diameter.

Left: Comparison of the location of the gap (a) and the circumplanetary disk candidate (b). Middle: 12CO emission with the location of the gap marked with the gray dashed lines. Right: A zoomed-in version of the previous panel with the 13CO emission contours placed on top. Click to enlarge. [Bae et al. 2022]

Point-Source Possibilities

Based on these observations, Bae and collaborators estimated that the circumplanetary disk contains roughly 30 Earth masses of gas and just 2.2 Moon masses of dust, suggesting a low dust-to-gas ratio of 0.0009. At a temperature of 35K, the gas is 13K warmer than expected given the distance from the central star. This likely means that there is an additional heat source in the vicinity of the circumplanetary disk, such as accretion by the planet or turbulence within the disk.

AS 209 hosts just the fourth circumplanetary disk candidate ever found, and this work marks the first time that researchers have detected the gas within a circumplanetary disk and estimated its mass. Future observations with ALMA and JWST should help answer lingering questions about the structure of the circumplanetary material, the mass and age of the young planet, and how the planet formed at such a large distance from its parent star.

Citation

“Molecules with ALMA at Planet-forming Scales (MAPS): A Circumplanetary Disk Candidate in Molecular-line Emission in the AS 209 Disk,” Jaehan Bae et al 2022 ApJL 934 L20. doi:10.3847/2041-8213/ac7fa3

hubble space telescope image of the rosette nebula and the young stars at its center

Researchers have modeled the turbulent gas of the interstellar medium in a new way, with important implications for how we interpret observations of distant galaxies.

Probing the Early Universe

optical image of the Milky Way star-forming region S106

The nebulae surrounding young stars, like the S106 star-forming region pictured here, frequently show intricate and irregular structure. [NASA, ESA, and the Hubble Heritage Team (STScI/AURA)]

How can we tell what makes galaxies billions of light-years away shine? Astronomers use photoionization models to analyze the photons we collect from galaxies in the early universe and discern what sources of energy, like young stars, shocks, or active galactic nuclei, make them glow.

In a recent study, a team led by Yifei Jin (金刈非; Australian National University and ARC Centre of Excellence for All Sky Astrophysics in 3 Dimensions) used photoionization models — with a turbulent twist — to simulate the intricate emission nebulae that surround young, massive stars in galaxies near and far.

plots of the hydrogen beta emission from the modeled nebula as well as the density of the nebular gas

Top: The modeled H-beta emission from the nebula. Bottom: The density of the interstellar gas with the outline of the nebula traced on top. [Jin et al. 2022]

Forming Fractal Gas

Jin and collaborators used state-of-the-art models to simulate realistic emission nebulae from turbulent interstellar gas. The team placed a synthetic O star a million times more luminous than the Sun at the center of a cube 140 light-years on each side. They filled the cube with gas with an average density of 100 particles per cubic centimeter — a typical value for nebulae in the Milky Way — and the same chemical composition as the Sun.

The main advance in this work is the use of a fractal density pattern for the simulated interstellar gas. Unlike previous models, which assumed that the gas had the same density throughout, the team’s model incorporates density variations on large and small scales, resulting in a clumpy interstellar medium similar to what is seen in observations. As high-energy photons from the synthetic O star ionize the gas, they create an emission nebula with a complex and irregular shape.

Volume versus Boundary

To determine the properties of their modeled nebula, Jin and collaborators tracked the strength of the emission lines and categorized each emission line as either a volume species or a boundary species, depending on where in the nebula the line was produced. The volume species — H-alpha, H-beta, and [O III] — are produced mainly in the body of the nebula, while the boundary species — [O I], [S II], and [N II] — are produced along the outer edge.

Comparison of the fluxes of several emission lines and emission-line ratios between the realistic nebula case and the spherical nebula case. A value of zero indicates no change in flux or the flux ratio. Click to enlarge. [Jin et al. 2022]

By comparing against a modeled spherical nebula formed in a region of uniform gas, the team found that the more complex the structure of the nebula, the more prominent the emission from the boundary species. This effect becomes more important the more concentrated an emission line is toward the edge of the nebula; for instance, H-alpha emission is scarcely different between the two models, but [O I] emission — 99.5% of which is produced along the boundary of the nebula — soars by 253% when a realistic nebular shape is adopted.

This study by Jin and collaborators demonstrates that modeling turbulent interstellar gas in a realistic way can have a huge impact on the resultant emission lines — which in turn has implications for how we interpret emission lines from distant galaxies. The team predicts that using fractal geometry for models of interstellar gas will be key to interpreting observations of galaxies early in the universe, when interstellar gas was likely highly turbulent.

Citation

“Theoretically Modeling Photoionized Regions with Fractal Geometry in Three Dimensions,” Yifei Jin et al 2022 ApJL 934 L8. doi:10.3847/2041-8213/ac80f3

image of the Sun releasing two coronal mass ejections

A chance alignment between Earth and a Mars-bound spacecraft has given us a rare glimpse into the movement of high-energy particles from the Sun. The data from this event can help researchers understand the radiation environment near Mars — a key factor in planning crewed missions to our neighboring planet and beyond.

Energetic Particle Parade

illustration of energetic particles being ejected by the sun

Illustration of energetic particles being ejected by the Sun. [NASA’s Goddard Space Flight Center Conceptual Image Lab]

The space between the planets in our solar system is filled with a wispy sea of charged particles that flow out from the Sun’s atmosphere. This particle population is augmented by cosmic rays — speedy protons and atomic nuclei accelerated in extreme environments across the universe — which ebb and flow against the 11-year solar activity cycle. This undulating particle background is punctuated by bursts of high-energy particles from the Sun, which can be unleashed suddenly in violent solar storms.

Spacecraft that venture out from the protection of Earth’s magnetic field must navigate this ocean of particles and weather solar storms. And if we someday wish to send astronauts to other planets, we’ll need to know how high-energy solar particles, which pose a risk to the health of astronauts and electronic systems alike, travel through the solar system.

location of Tianwen-1 relative to Earth, Mars, and other spacecraft

Location of Tianwen-1 (TW-1) relative to Solar Orbiter (SolO), Parker Solar Probe (PSP), and STEREO-A (STA), Earth, and Mars. The black arrow marks the location of the active region that launched the solar storm. [Adapted from Fu et al. 2022]

When Spacecraft Align

In a new publication, a team led by Shuai Fu (Macau University of Science and Technology), Zheyi Ding (China University of Geosciences), and Yongjie Zhang (Chinese Academy of Sciences) studied the high-energy solar particles produced in an event in November 2020, when the Sun emitted a solar flare and a massive explosion of solar plasma called a coronal mass ejection.

This event coincided with a chance alignment of multiple spacecraft along the same solar magnetic field line. This alignment meant that several spacecraft near Earth and the Tianwen-1 spacecraft en route to Mars measured the same burst of energetic particles millions of miles apart, providing a rare opportunity to study how energetic particles from the Sun travel through space along magnetic field lines.

Diffusion and Evolution

By comparing the timing of measurements from Tianwen-1 to those from three spacecraft near Earth, the team discerned that the magnetic field line that connected the spacecraft did not connect back to the origin of the particles. This means that the particles must have traveled, or diffused, across magnetic field lines to reach the spacecraft.

plots of particle flux as a function of energy at eight time steps

Comparison of proton fluence (number of particles collected per unit area) measured by spacecraft at Earth (blue) and by Tianwen-1 at 1.39 au (red). The time increases from (a) to (h). The spectra at Earth and at Tianwen-1 “break” or bend at roughly the same energy, suggesting that there is little evolution as the particles travel outward. Click to enlarge. [Fu et al. 2022]

In addition, the team found that the shape of the particle energy distribution remained the same at moderate and high energies as the particles traveled between Earth and Tianwen-1’s location at 1.39 au. This suggests that the shape of the energy distribution is determined earlier, at the time the particles are accelerated to high energies, rather than as the particles travel through space.

The November 2020 event marked the first solar energetic particle event observed by Tianwen-1, but surely not the last. The spacecraft will continue to monitor high-energy particles from its station in Mars orbit as the solar cycle revs up, collecting valuable data for understanding the radiation environment around Mars and planning future missions.

Citation

“First Report of a Solar Energetic Particle Event Observed by China’s Tianwen-1 Mission in Transit to Mars,” Shuai Fu et al 2022 ApJL 934 L15. doi:10.3847/2041-8213/ac80f5

very large telescope image of the protoplanetary disk around IM Lupi

The disk surrounding the star IM Lupi has come into clearer focus in the past few years thanks to new observations that revealed spirals, kinks, and other interesting structures. Could a hidden planet be the cause of all these features?

A Detailed Disk

radio image of the disk around IM Lupi

IM Lupi as seen at a wavelength of 1.25 mm. The white bar in the lower right-hand corner is a 10-au scale bar. [Adapted from Andrews et al. 2018]

IM Lupi is a young star with an intriguing protoplanetary disk. Observations of IM Lupi’s disk over the past few years have found that the disk doesn’t rotate evenly; there are more than a dozen “kinks” where the gas moves at a different rate than what we would expect for a smoothly rotating disk. In addition, a spiral pattern is imprinted upon the disk’s upper surface.

Previous research has suggested that these features could signal that IM Lupi’s expansive disk hides a massive planet orbiting the star at a distance of 117 au. In a new publication, a team led by Harrison Verrios (Monash University, Australia) puts that theory to the test.

On a Hunt for Planets

Verrios and collaborators used hydrodynamic modeling to understand how the presence of a planet would affect IM Lupi’s disk. In addition to modeling a planet-less disk as a control case, the team investigated the effects of a planet with a mass 2, 3, 5, or 7 times the mass of Jupiter orbiting the central star at a distance of 100–120 au.

Observed and modeled polarized intensity maps

Observed (left) and modeled (right) polarized intensity maps. The model shows the results for a planet with a mass of 2 Jupiter masses. Click to enlarge. [Verrios et al. 2022]

In order to compare against observations, the team generated images from their hydrodynamic models. Specifically, they modeled the emission from the disk at wavelengths of 1.25 millimeters (which traces the warm dust) and 1.6 microns (which shows the polarized light scattered off the disk). The team found that by including a planet in their simulations, they could reproduce all of the observed velocity kinks as well as the distinctive spiral pattern on the disk’s surface. The team’s models also predicted that the wake created by the planet’s motion should be visible in velocity maps, and observations match this prediction closely. Overall, the authors found that a 2–3-Jupiter-mass planet orbiting at a distance of roughly 110 au produced the best match to the observations.

Disk Disturbances Demystified

Comparison of observed and modeled velocity maps

Comparison of observed (top row) and modeled (bottom row) 1.25-mm images and velocity maps. The Δv at the bottom of each panel denotes the difference from the rest velocity of the 12CO J=2–1 transition. Click to enlarge. [Adapted from Verrios et al. 2022]

Does this study rule out the possibility that the structures in IM Lupi’s disk have a different cause, such as a gravitational instability? Protoplanetary disks are notorious for having features that mimic the signals of planets, and more work is needed to confirm the presence of a planet tucked away in IM Lupi’s disk — but the authors’ simulations suggest that a planet can explain all the intriguing features of the disk without invoking another cause.

Previously, researchers theorized that a planet could only disturb its disk in a small region immediately surrounding the planet, which would suggest that the more widespread disturbances in IM Lupi’s disk must have another cause. However, Verrios and coauthors found that widespread features popped up in their simulations, suggesting that planets can have more far-reaching effects than predicted.

Citation

“Kinematic Evidence for an Embedded Planet in the IM Lupi Disk,” Harrison J. Verrios et al 2022 ApJL 934 L11. doi:10.3847/2041-8213/ac7f44

An artist's impression of a stellar-mass black hole

At the heart of some galaxies, a disk of gas whirls around a central supermassive black hole. A recent publication explores what might happen when stars and stellar-mass black holes meet in the disks around supermassive black holes.

Getting an Assist from an Active Galactic Nucleus

plot of stellar orbital evolution

Simulated orbital evolution of four stars orbiting an active galactic nucleus. This plot shows how the orbital semimajor axis (top), eccentricity (middle), and angle between the stellar orbit and the disk rotation axis (bottom) change over time. [Yang et al. 2022]

The disks around supermassive black holes, which together power luminous active galactic nuclei across the universe, can enable interesting interactions between stars and compact objects. Stars orbiting the centers of these galaxies at all angles repeatedly pass through the disk, collecting gas and gaining mass. Over time, the friction of these repeated passages alters the stars’ orbits and brings some of the stars to new orbits that lie within the disk itself.

Once the stars are settled in the disk, they migrate inward and become susceptible to gravitational entanglements with other objects. Some of these stars will link up with stellar-mass black holes to form binary systems. From there, astronomers predict that the orbits of these binaries shrink until the black hole’s tidal forces rip the star apart, causing a small-scale version of the same phenomenon that occurs around supermassive black holes: a tidal disruption event (TDE). But how common are these theorized micro-TDEs likely to be, and what observational signatures would they have?

table of merger and disruption rates

Estimated rates of different types of binary mergers or disruptions within the disk surrounding an active galactic nucleus. Results are in units of events per cubic gigaparsec per year. Micro-TDEs refer to interactions between stars and stellar-mass black holes. [Yang et al. 2022]

Event Estimation

A research team led by Yang Yang (University of Florida) estimated the frequency of these events as well as the kind of electromagnetic signals they would emit. The team began by estimating how many stars and black holes will end up in aligned orbits within the disk of an active galactic nucleus. From there, the authors applied a random distribution of masses to the stars and black holes and calculated how quickly binary systems assembled from these populations would merge, resulting in a rate of one event per year per cubic gigaparsec (1 cubic gigaparsec = 3.5×1028 cubic light-years; about 50,000 times the volume of the Virgo Supercluster).

As to what kind of electromagnetic signals these events might produce, Yang and collaborators suggest that they would resemble the signals from TDEs around supermassive black holes — but with some key differences. The stream of accreted material that forms around a stellar-mass black hole will be hotter than the stream that forms around a supermassive black hole, producing copious X-ray emission, and micro-TDEs may reach their peak luminosity later than full-scale TDEs.

Disruption Detection

An artist's impression of a tidal disruption event.

An artist’s impression of a tidal disruption event. [NASA’s Goddard Space Flight Center]

It’s a big universe out there — where should we look for signs of micro-TDEs? Because micro-TDEs and full-scale TDEs have similar electromagnetic signals, Yang and collaborators suggest that galaxies where TDEs are rare are the first places we should look. Luckily, we already know where that might be: supermassive black holes weighing in above 100 million solar masses likely consume Sun-like stars whole rather than ripping them apart. If we observe a TDE-like signal coming from the neighborhood of such a black hole, it could be a sign of a micro-TDE instead.

At present, two candidate events have been discovered, though the authors can’t rule out the possibility that they are regular TDEs. As with any as-yet-unobserved phenomenon, more theoretical work is needed to ensure we’ll be able to identify micro-TDEs when we find them.

Citation

“Tidal Disruption on Stellar-mass Black Holes in Active Galactic Nuclei,” Y. Yang et al 2022 ApJL 933 L28. doi:10.3847/2041-8213/ac7c0b

mosaic of the large magellanic cloud from swift observatory

Across the universe, luminous galactic centers are fueled by supermassive black holes that accrete gas, dust, and stars from their surroundings. These powerful active galactic nuclei (AGN) radiate across the electromagnetic spectrum and emit jets of energetic particles, potentially shaping the evolution of the galaxies they inhabit. Collecting spectra of AGN is key to understanding the structure of the material that surrounds them and the role they may play in galaxy evolution — and a new public data release from a spectroscopic survey of AGN discovered by the Neil Gehrels Swift Observatory has expanded our ability to probe these objects.

An illustration of the Neil Gehrels Swift Observatory in front of a gamma-ray burst

An illustration of the Neil Gehrels Swift Observatory in front of a gamma-ray burst. [Spectrum and NASA E/PO, Sonoma State University, Aurore Simonnet]

Since 2005, the Neil Gehrels Swift Observatory has monitored the sky from gamma-ray to optical wavelengths, primarily in pursuit of the sources of gamma-ray bursts: extragalactic explosions potentially caused by massive stars going supernova or compact objects merging. However, Swift sees far more than just gamma-ray bursts — its Burst Alert Telescope (BAT), which scans 80% of the sky each day at X-ray and gamma-ray energies (14–195 kiloelectronvolts), has discovered hundreds of AGN in the local universe.

But detecting AGN is just the first step toward understanding the nature and importance of these objects — dedicated spectroscopic follow-up is a critical next step. Enter the BAT AGN Spectroscopic Survey (BASS): a project that aims to survey the most powerful AGN that have been detected in high-energy X-rays by Swift Observatory. In a new special issue of the Astrophysical Journal Supplement Series, the BASS team presents the latest step toward their goal of producing an immense catalog of AGN spectra.

projection of the sky with symbols indicating the locations of the active galactic nuclei being surveyed

Locations of the objects surveyed in the second BASS data release. The symbol shape and color indicates the instrument and telescope used to collect that object’s spectrum. Click to enlarge. [Koss et al. 2022]

This data release contains 1,449 optical spectra — 1,181 of which have never been released before — and 233 near-infrared spectra, all from 858 AGN in the local universe. The just published special issue presents catalogs of spectra, derived quantities, and first science results, including the following important findings:

  • The objects discovered by the Burst Alert Telescope span a wide range of properties. Namely, the black hole masses, luminosities, accretion rates, and degree to which the targets are obscured by gas and dust all vary by at least five orders of magnitude, making this survey a useful probe of a wide variety of AGN. Additionally, few of the sources observed in this survey are contained in other surveys, making the BASS project a source of unique information.
  • For the first time, the black hole mass function and the Eddington ratio distribution function — how the black hole mass and AGN luminosity vary with other factors — have been determined directly for heavily obscured objects. The resulting distribution functions show that obscured AGN are intrinsically less luminous compared to their theoretical maximum luminosities than their unobscured counterparts. This suggests that radiation plays a large role in determining the structure of the material close to an AGN.
  • plot of number of active galactic nuclei versus redshift

    Redshift distribution of AGN in the BASS second data release. [Oh et al. 2022]

    The masses of the supermassive black holes at the heart of obscured AGN tend to be underestimated when the mass is determined from measurements of hydrogen emission lines. Researchers can reduce this effect in the future studies by applying multiplicative factors when estimating masses this way.
  • New diagnostics based on mid-infrared luminosities can distinguish between obscured and unobscured AGN, yielding new candidate sources that are heavily obscured. However, separating out star-forming galaxies remains a challenge.

The publicly available sample of spectra developed by the BASS team provides a valuable tool for researchers wishing to study AGN in the local universe. Looking forward, the team plans to supplement their current catalog with observations of fainter sources made by the Burst Alert Telescope, expanding our understanding of these cosmic engines.

Citation

Special ApJS Issue on the BAT AGN Spectroscopic Survey Second Data Release

“BAT AGN Spectroscopic Survey XXI: The Data Release 2 Overview,” Michael J. Koss et al 2022 ApJS 261 1. doi:10.3847/1538-4365/ac6c8f

extreme-ultraviolet image and magnetic field map of a bipolar ephemeral active region

Among the smallest and most fleeting occupants of the zoo of solar phenomena are bipolar ephemeral active regions (BEARs). In today’s article, researchers studied the evolution of these regions to understand how they generate miniature solar flares — and understand what this might mean for how massive solar flares are ejected.

image of the sun's disk with its magnetic field strength indicated in greyscale

This map of the Sun’s magnetic field from the Solar Dynamics Observatory shows large bipolar active regions, where field lines pointing in opposite directions are located close together. These regions are associated with sunspots, solar flares, and coronal mass ejections. [NASA/SDO]

The Life Cycle of an Active Region

The roiling plasma of the solar surface gives rise to an amazing variety of phenomena. Many solar phenomena are linked to active regions: places where loops of the solar magnetic field emerge from beneath the solar surface. Sunspots arise from active regions, and the evolution of the plasma and magnetic fields contained within large active regions is thought to power solar flares, coronal mass ejections, and other solar outbursts.

However, a large active region might take weeks or even months from the moment it emerges to the moment it unleashes a solar flare or a coronal mass ejection. During those weeks or months, active regions will rotate out of view, hiding parts of their evolution on the far side of the Sun. Is there a way to study the full life cycle of an active region?

diagram of the magnetic field lines surrounding a BEAR

A drawing of the magnetic field orientation around a BEAR situated in a region of open solar field lines that extend out into space. The top panel shows a top-down view and the bottom panel shows a side view. [Moore et al. 2022]

A Range of Scales

To answer that question, a research team led by Ronald Moore (University of Alabama in Huntsville and NASA Marshall Space Flight Center) turned to bipolar ephemeral active regions, or BEARs, which are among the smallest active regions. BEARs contain arching magnetic field lines that rise above the solar surface, span roughly 10,000 km, and aren’t associated with sunspots. As the “ephemeral” part of the name suggests, their lives are fleeting — BEARs emerge in just half a day and disperse roughly two days later, making it possible to study their entire lives in detail.

Moore and collaborators note that the structure of the magnetic field lines above BEARs is largely the same as it is above larger active regions, and both types of active regions are associated with solar explosions: massive solar flares arise from large active regions and microflares erupt from BEARs. This suggests that all active regions, regardless of size, are governed by the same processes and evolve in the same way. By that logic, we can gain the same understanding from studying the smallest active regions as we can from the largest.

Toward a Universal Mechanism

To study the life cycles of solar BEARs and determine what makes them eject microflares, Moore and collaborators used data from the Solar Dynamics Observatory to track the magnetic field strength and extreme-ultraviolet emission from 10 BEARs as they evolved.

histogram of the number of microflares produced by each BEAR

Histogram showing the number of microflares produced by each BEAR in the team’s sample. [Moore et al. 2022]

The team found that the 10 BEARs released 43 microflares in total, with each BEAR emitting zero to 12 microflares during its lifetime. Movies of the magnetic field evolution revealed that each microflare followed an instance of flux cancellation: when the roiling motion of solar plasma brings together magnetic field lines that point in opposite directions, they “cancel” each other out and the flux that was present dissipates. Because the magnetic field structure above BEARs and other active regions is so similar, and because flux cancellation appears to be a universal process for the formation of microflares, Moore and collaborators suggest that this process drives the ejection of massive solar flares as well.

Bonus

Check out this video from the authors’ article, which shows the evolution of the extreme-ultraviolet emission and magnetic field in one of the BEARs in the sample. The left panel shows the 21.1-nanometer extreme-ultraviolet emission, the middle panel shows the magnetic field (white indicates outward-directed magnetic flux and black indicates inward-directed magnetic flux), and the right panel superimposes magnetic field strength contours on an extreme-ultraviolet image. The movie shows 16 hours of the BEAR’s evolution.

Citation

“Bipolar Ephemeral Active Regions, Magnetic Flux Cancellation, and Solar Magnetic Explosions,” Ronald L. Moore et al 2022 ApJ 933 12. doi:10.3847/1538-4357/ac6181

1 43 44 45 46 47 122