Features RSS

Artist's impression of a star orbited by five planets

Astronomers have just taken a closer look at an unusual system containing three stars and at least five planets. In doing so they may have solved a mystery around its formation. The system, known as Kepler-444, is also around 11 billion years old, showing that such systems can be stable over a significant fraction of the universe’s current age.

One System, Three Stars, Five Planets

image of the three stars in the Kepler-444 system

Typical observation of the central star Kepler-444 A and the binary pair Kepler-444 BC. [Adapted from Zhang et al. 2023]

Located 117 light-years away toward the constellation Lyra, the system is centered on the K0 star Kepler-444 A. Then there’s a tight-knit binary pair of M-type stars orbiting it some 66 astronomical units away (known as Kepler-444 BC). A quintet of planets also orbits Kepler-444 A. All five worlds have radii between 0.4 and 0.7 Earth radius, and every one has an orbital period under 10 days.

A team of astronomers led by Zhoujian Zhang (University of California, Santa Cruz) recently set about measuring the properties of the crowded system more precisely in several different ways. They used the High Resolution Spectrograph of the Hobby-Eberly Telescope at the McDonald Observatory in Texas to measure Kepler-444 A’s radial velocity. The star’s speed changes as it is pulled around by the other objects in the system. Zhang’s team also measured the relative radial velocities between the binary pair and the central star using the High Resolution Echelle Spectrometer at the W. M. Keck Observatory in Hawaii.

The gravitational pull of its companions causes Kepler-444 A to follow a wiggling path across the night sky. Measuring this changing position is known as astrometry. Zhang’s team conducted astrometric measurements of Kepler-444 A using Keck’s near-infrared imager (NIRC2).

Expanding Planet-Forming Potential

Putting all these pieces of the puzzle together, the team arrived at a deeper understanding of the Kepler-444 system and its history. Previous measurements of the system suggested that the binary swings in to within 5 astronomical units of Kepler-444 A. That would have truncated Kepler-444 A’s protoplanetary disk, severely depleting the amount of planet-forming material available. It wasn’t clear how five rocky planets could have formed there.

plot of observed and modeled on-sky separation between the central star and the binary pair

Top panel: Observed (orange circles) and modeled (green lines) separations between Kepler-444 A and Kepler-444 BC. The black line shows the best-fitting model. Bottom panel: Observed values minus modeled values. [Adapted from Zhang et al. 2023]

Now, based on their new measurements, Zhang’s team conclude that the Kepler-444 BC binary only gets within 23 astronomical units of Kepler-444 A. This wider separation would have led to a larger and more massive protoplanetary disk truncated to 8 astronomical units. The team calculate that there would have been 500 Earth masses’ worth of dust available from which to build planets. That compares to just 4 Earth masses of dust using previous estimates. Suddenly the presence of five planets is less perplexing.

As astronomers gain a greater understanding of exoplanets, it’s becoming clear that there’s more than one way to make a solar system.

Citation

“The McDonald Accelerating Stars Survey: Architecture of the Ancient Five-planet Host System Kepler-444,” Zhoujian Zhang et al 2023 AJ 165 73. doi:10.3847/1538-3881/aca88c

Solar Dynamics Observatory image of the Sun on a day with no sunspots

Solar flares and massive coronal explosions get all the attention, but the quiet Sun is interesting in its own right. Two recent research articles explore new phenomena that have come to light when the Sun is at its calmest.

WINQSE from the Sun

When the Sun releases a solar flare, fast-moving electrons accelerated by the flare spiral around solar magnetic field lines. This process produces short bursts of radio waves called radio transients. Even when the Sun is quiet, though, with no solar flares or other activity, researchers have detected brief flashes of radio emission lasting less than a second. These fleeting radio sparks might be the counterpart to a special kind of solar flare: a nanoflare.

Although nanoflares are thought to have the same basic cause as solar flares (the release of pent-up magnetic energy), they are far less powerful. Less powerful, but more frequent: in theory, nanoflares might flicker on the Sun’s surface almost constantly, providing a steady source of heat to the Sun’s rarefied upper atmosphere, or corona. Nanoflares are a potential solution to what is known as the coronal heating problem — the challenge of heating the solar atmosphere from ~6000K near its surface to millions of kelvin in the corona.

Ultraviolet image of the Sun overlaid with radio contours of a WINQSE

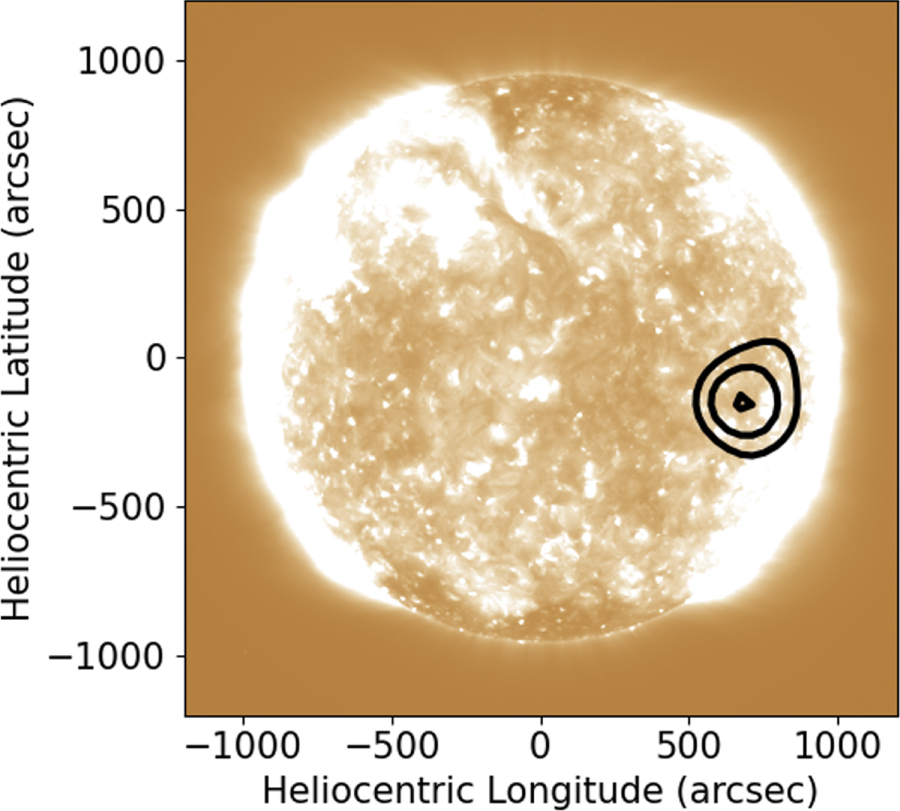
Radio contours (black lines) corresponding to an individual WINQSE observed at a frequency of 136 megahertz (wavelength of 2.2 meters). The background image shows the Sun at a wavelength of 19.3 nanometers. [Mondal et al. 2023]

In 2020, a research team led by Surajit Mondal (New Jersey Institute of Technology) reported the detection of flickering radio emission across the Sun’s disk when there were no solar flares or sunspots. The team dubbed these events Weak Impulsive Narrowband Quiet Sun Emissions (WINQSEs). Now, Mondal and collaborators have expanded their search for solar WINQSEs using observations from a time when the Sun was extremely quiet.

Using the Murchison Widefield Array in Western Australia, the team once again detected numerous WINQSEs and characterized their properties. These observations confirmed that WINQSEs are extremely fast, with most events likely shorter than the 0.5-second cadence of the observations, and they appear all across the Sun. As the body of WINQSE observations grows, Mondal and coauthors hope that interest in these fleeting events will grow as well, spurring the community toward a greater understanding of this phenomenon.

Emission from Spiraling Electrons

On the theoretical side, a team led by Elena Orlando (University of Trieste, Italy; National Institute for Nuclear Physics and Trieste Observatory of the Italian National Institute for Astrophysics) explored another phenomenon: emission from galactic cosmic rays tangled in the Sun’s magnetic field. Galactic cosmic rays aren’t “rays” at all, but rather high-energy charged particles thought to be accelerated in distant cosmic engines like supernovae. When galactic cosmic ray protons or atomic nuclei reach the Sun, their interactions with solar photons and the solar atmosphere generate high-energy emission. This process occurs during active and quiet times on the Sun.

plot of modeled emission from galactic cosmic ray electrons interacting with the Sun's magnetic field

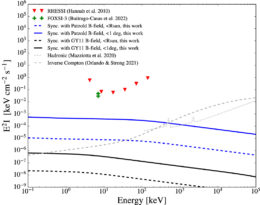
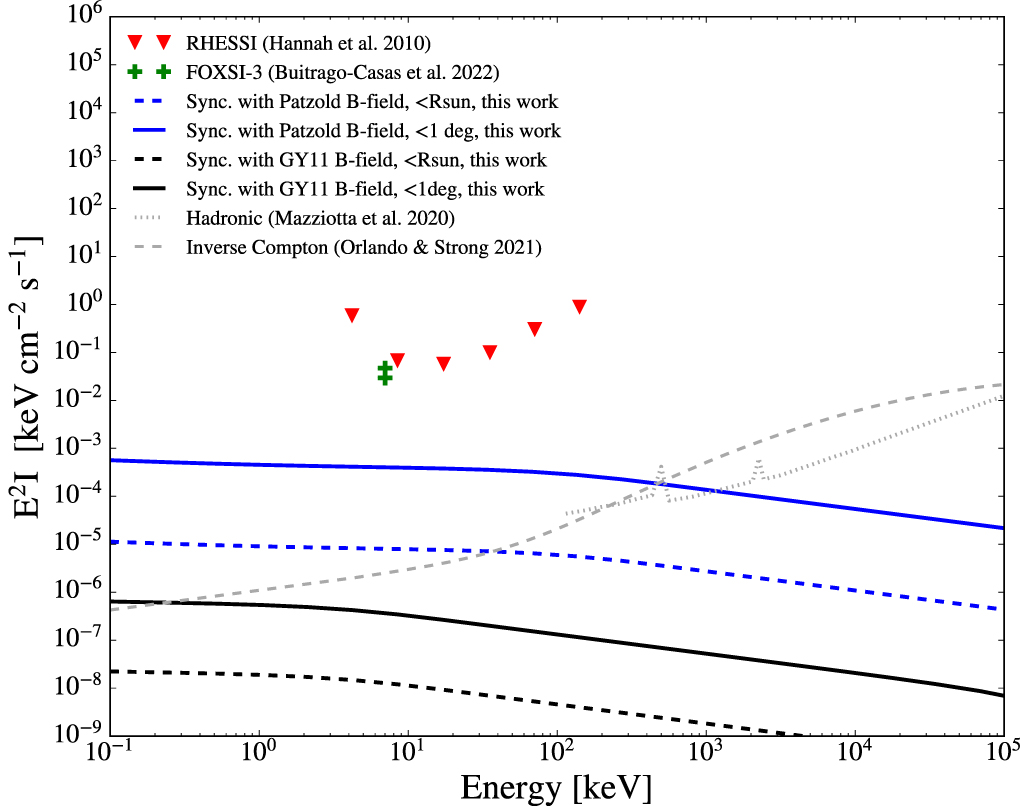
Modeled flux (solid and dashed lines) compared to observational upper limits (red and green symbols). The blue and black lines use different models for the Sun’s magnetic field, and the results are shown integrated over the Sun’s disk (dashed) and integrated over a 1-degree circle centered on the Sun’s disk (solid). The grey lines show the modeled emission strengths for other processes related to galactic cosmic rays. Click to enlarge. [Orlando et al. 2023]

While most galactic cosmic rays are protons or the nuclei of helium atoms, a small fraction — maybe 1% — of galactic cosmic rays are electrons. In a recent publication, Orlando and collaborators proposed that galactic cosmic ray electrons spiraling around solar magnetic field lines might also contribute detectable emission from the quiet Sun.

The team used existing measurements of inbound galactic cosmic rays and models of the Sun’s magnetic field to model the strength of the emission as a function of location and wavelength. They found that the emission is essentially constant across the Sun’s disk and is brightest just beyond the edge of the disk, where the magnetic field is strongest. They found that the Sun’s thermal emission far surpasses the expected emission from swirling cosmic ray electrons at wavelengths from radio to ultraviolet, but at higher energies, things seem more promising: while the emission strengths are well below upper limits previously measured, instruments like the Focusing Optics X-Ray Solar Imager (FOXSI) or the Nuclear Spectroscopic Telescope Array (NuSTAR) might be sensitive enough to track it down.

Citation

“Study of Radio Transients from the Quiet Sun During an Extremely Quiet Time,” Surajit Mondal et al 2023 ApJ 943 122. doi:10.3847/1538-4357/aca899

“A New Component from the Quiet Sun from Radio to Gamma Rays: Synchrotron Radiation by Galactic Cosmic-Ray Electrons,” Elena Orlando et al 2023 ApJ 943 173. doi:10.3847/1538-4357/acad75

An artists depiction of a star around a pulsar slowly being torn apart.

Tiny but deadly, black widow pulsars are some of the cruelest astronomical objects in the galaxy: first they consume most of their companion, then they destroy the remains. A recent study has caught yet another in the final act of this gruesome sequence and draws insights from the population of these celestial arachnids as a whole.

New Specimen

As tranquil as the night sky can be, some truly vicious monsters lurk above us. Pulsars, the highly magnetized zombie remains of a supernova, are scary enough, but certain subpopulations take it a step further. Black widow pulsars, keeping with their terrestrial namesakes, prey upon larger nearby stars first with extreme gravitational tides and later with venomous doses of high-energy radiation. Stars partially devoured by these beasts must end their lives in a doomed fight to avoid dissolution by these high-energy winds, and their struggle releases gamma rays, X-rays, and occasional optical signatures detectable here on Earth.

The list of systems in the midst of such death throes is short but growing, and recently a study led by Samuel J. Swihart (National Academy of Sciences, US Naval Research Laboratory) has lengthened it further. They report the discovery of J1408, the forty-first known black widow pulsar, caught in the act of destroying a stellar companion on a blisteringly fast 3-hour orbit.

Two telescope images, one an enlargement of a portion of the other

Images of the newly discovered black widow pulsar, along with representative ellipses marking the resolution of various high-energy telescopes used in the analysis. [Swihart et al. 2022]

Confirming this murder-in-progress required a fleet of telescopes spanning the entire electromagnetic spectrum. After the broad region surrounding J1408 appeared in a catalog of Fermi gamma-ray sources, Swihart and collaborators narrowed in on the precise source and its nature using two X-ray telescopes, two optical telescopes, a radio observatory, and data from the Gaia spacecraft. By combining data from these disparate tools and techniques, the team conclusively showed that all measurements could be explained by a black widow on the hunt.

Insights from the Collection

A scatter plot of mass on the X axis and period on the Y.

The mass and period of many known millisecond pulsars, colored by subpopulation. Note the lack of objects between 0.07 and 0.1 solar mass. [Swihart et al. 2022]

Following this discovery, the team took a step back from their new object and considered the population of spider pulsars as a whole. They started by curating a collection of measurements for all black widows known to date, then compared these to a closely related species known as “redback” pulsars. This other group of venomous neutron stars has a taste for higher-mass companions, but interestingly, the transition between black widow and redback companions is not smooth. Instead, this comparison emphasized a previously noted discontinuity: while black widows prey on everything below 0.07 solar mass and redbacks hunt stars above 0.1 solar mass, astronomers have yet to find a companion that falls between those values.

Why that might be remains a mystery, since redbacks and black widows are thought to form via the same pathway. Regardless of the reason, it seems that at least some stars might be immune to spider bites.

Citation

“A New Flaring Black Widow Candidate and Demographics of Black Widow Millisecond Pulsars in the Galactic Field,” Samuel J. Swihart et al 2022 ApJ 941 199. doi:10.3847/1538-4357/aca2ac

Visualization of the accretion disk around a black hole

What do black holes have to do with dark energy, the subtle pressure that accelerates the expansion of our universe? New research suggests that the two may be inextricably linked, potentially solving the long-standing mystery of the nature of dark energy.

Multiple Black Hole Models

annotated illustration of a black hole

Illustration of a traditional black hole model with important components of the model labeled. Click to enlarge. [ESO; CC BY 4.0]

When a massive star ends its life, it collapses to form a black hole, creating a well in spacetime so deep that even light cannot escape. Although our understanding of black holes has grown over time, there’s still much we don’t know about them, and we rely on mathematical models to learn more and make predictions that we can test. The most common model predicts a spinning black hole containing a singularity — a point of hypothetically infinitely curved spacetime where our equations describing gravity break down — hidden by the black hole’s event horizon.

However, this common black hole model is in tension with the overall expansion of the universe, leading some scientists to propose alternative models. In one such model, black holes do not contain a singularity, but are instead filled with vacuum energy. These vacuum-energy black holes are intriguing because their growth is coupled to the expansion of the universe: as the universe expands, these black holes gain mass.

Do Black Holes Gain Mass as the Universe Expands?

In a research article published today, Duncan Farrah (University of Hawaiʻi) and collaborators tested this black hole model by studying the growth of supermassive black holes over billions of years. The team studied elliptical galaxies since these galaxies’ central supermassive black holes are unlikely to grow much by other means, such as by consuming nearby stars and gas.

plots of probability versus cosmological coupling strength

The probability of different coupling strengths as derived from several different data sets. The results are incompatible with traditional black holes (BHs), which are not coupled to the expansion of the universe. [Farrah et al. 2023]

By measuring how the masses of black holes at the centers of elliptical galaxies billions of years ago compare to those present today, Farrah and coauthors determined the strength of the coupling between black hole mass and the expansion of the universe. Traditional singularity-containing black holes would have a coupling strength of 0, while vacuum-energy black holes would have a coupling strength of 3. Ultimately, the team found the coupling strength to be around 3.11, and they ruled out the possibility of zero coupling at 99.98% confidence. This finding supports the vacuum-energy black hole model and suggests that black holes do gain mass as the universe expands.

Dark Energy, Illuminated

plot of star formation rate density as a function of cosmic time

Star formation rate density (SFRD) as a function of redshift. The green shaded area shows the possible star formation rates that will yield the density of black holes necessary to produce the observed dark energy density. The solid lines show the model results for different initial mass distributions of newborn stars. Click to enlarge. [Farrah et al. 2023]

What does it mean for black hole growth to be linked to the expansion of the universe? Certain physical quantities must be conserved as black holes gain mass, and as a result, the growth of black holes produces pressure that drives the acceleration of the universe’s expansion. In other words, black holes that grow as the universe expands are a source of dark energy, a long sought-after component of our models of the cosmos.

Farrah and collaborators performed additional modeling showing that the expected population of vacuum-energy black holes can account for the density of dark energy previously measured by the Planck satellite — so not only do vacuum-energy black holes generate dark energy, they generate the same amount of dark energy we’ve measured! Hopefully, the next few months to years will bring more research on this topic, expanding our understanding of the fundamental physics of our universe.

Citation

“Observational Evidence for Cosmological Coupling of Black Holes and Its Implications for an Astrophysical Source of Dark Energy,” Duncan Farrah et al 2023 ApJL 944 L31. doi:10.3847/2041-8213/acb704

a spiral galaxy with two long, distinct spiral arms and a central bar

Astronomers recently released details of the first Cepheid variable stars observed with JWST. These unique objects are used as cosmic rulers and so the new measurements have important consequences for our understanding of the universe’s expansion.

A Rung in the Cosmic Distance Ladder

Hubble image of Cepheid variable star RS Puppis

Cepheid variable RS Puppis, pictured here in an image from the Hubble Space Telescope, is 15,000 times brighter than the Sun. Cepheids provide a way to measure the distances to other galaxies. [NASA, ESA, and the Hubble Heritage Team (STScI/AURA)–Hubble/Europe Collaboration; Acknowledgment: H. Bond (STScI and Pennsylvania State University)]

As their name suggests, Cepheid variable stars change in brightness over time in a regular, repeating pattern. Astronomers have known for more than a century that inherently brighter Cepheids take longer to vary that brightness. The inherent brightness of a Cepheid can then be compared to how bright the star appears to us. As light fades over distance, a bigger difference implies the Cepheid is farther away. So astronomers have long used Cepheids as a yardstick to measure the distance to nearby galaxies using instruments such as the Hubble Space Telescope.

However, calculating those distances has always required some assumptions. Cepheids are often found in regions of recent star formation, so they are embedded in a lot of dust. Pushing Hubble observations into the near infrared helped to mitigate the effect of the dust, but had the knock-on effect of reducing Hubble’s resolution by a factor of two to three. In turn, this limited the precision with which astronomers could measure the brightness of the Cepheids.

JWST Enters the Scene

JWST represents a big upgrade. It has a greater resolution to start with and is specifically designed to work in the infrared. Astronomers plan to revisit all the Cepheids observed by Hubble. This will take years, but a team led by Wenlong Yuan (Johns Hopkins University) has released the preliminary results of an observation run taking in 31 Cepheids in the galaxy NGC 1365.

plot of magnitude versus period for Cepheid variable stars

Apparent magnitude of Cepheid variable stars as a function of their period. JWST observations are shown in red and Hubble Space Telescope observations, translated to the same frequency as the JWST data, are shown in grey. Click to enlarge. [Yuan et al. 2022]

The team found good agreement with the previous brightness measurements made by Hubble. It’s a vital step in trying to resolve an ongoing issue in cosmology known as the Hubble tension. Different methods for measuring the expansion of the universe disagree on how fast the cosmos in expanding. One proposed solution is that the work to correct the Hubble measurements of Cepheids introduced a bias that was throwing the measurements off. This seems less likely now given that JWST data appear to agree with the Hubble observations.

That said, the authors note the preliminary nature of these observations and that they are “far from the best JWST can do.” Future observations will have a longer exposure time and will benefit from improved calibration data. Only then will we truly know whether Cepheids are the key to unlocking the enigma of the Hubble tension.

Citation

“A First Look at Cepheids in a Type Ia Supernova Host with JWST,” Wenlong Yuan et al 2022 ApJL 940 L17. doi:10.3847/2041-8213/ac9b27

Hubble image of a face-on spiral galaxy

JWST’s observations of galaxies in the distant universe have already shaken up our understanding of how the first galaxies evolved. But could our observations of faraway galaxies be misled by closer interlopers?

example of a high-redshift galaxy discovered with JWST

One of the many galaxies with redshift of z > 10, corresponding to the first 500 million years after the Big Bang, discovered with JWST observations. [Adapted from: Science: NASA, ESA, CSA, Tommaso Treu (UCLA); Image Processing: Zolt G. Levay (STScI)]

Distance Makes the Galaxy Grow Redder… but So Does Dust

During its first year, JWST observed many candidate high-redshift galaxies, corresponding to when the universe was just a few hundred million years old. As these candidates piled up, their numbers and masses started to stretch the bounds of what is likely under leading theories of galaxy formation and evolution. The tension between theory and observations has led some researchers to suggest that overhauling our theories is in order.

Before we give existing theories the boot, there’s another possibility to consider: some galaxies with reported redshifts of > 10 may actually be dusty star-forming galaxies at z < 7, skewing our statistics. Why might we confuse these two very different galaxy populations, and what can we do about it?

Lyman Breaks vs. Dusty Dropouts

Here’s how the mix-up can occur: researchers pick out extremely distant galaxies by searching for the Lyman break — a sharp drop-off in galactic emission at short wavelengths due to clouds of neutral hydrogen that absorb starlight beyond a certain wavelength. In practice, astronomers search for galaxies that are present in redder filters and “drop out” of bluer images.

Dusty star-forming galaxies may appear similar in our observations. When strong ultraviolet emission powered by ultra-hot young stars is soaked up by dust and re-emitted at longer wavelengths, the resulting color of the galaxy can mimic that of a more distant galaxy, including the drop-out behavior. As the authors point out, the confusion between nearby dusty galaxies and more distant galaxies isn’t unique to JWST; researchers analyzing Hubble Space Telescope data wrestled with the same issue, though the redshift ranges were different — in Hubble images, z ~ 6–8 galaxies vied with z ~ 2–3 galaxies for our attention.

images of CEERS-DSFG-1 in six JWST filters

Images of the galaxy CEERS-DSFG-1, which exhibits drop-out behavior in JWST images. The galaxy is clearly visible in the longer-wavelength filters and drops out at shorter wavelengths. [Zavala et al. 2023]

Inspecting High-Redshift Candidates

In a recent publication, Jorge Zavala (National Astronomical Observatory of Japan) and collaborators tackled this challenge by searching for thermal emission from dust in the galaxy CEERS-DSFG-1, which JWST observed as part of the Cosmic Evolution Early Release Science (CEERS) survey. CEERS-DSFG-1 shows drop-out behavior similar to other high-redshift galaxy candidates, but detecting dust emission could indicate that the galaxy is located at a lower redshift.

probability density function for the redshift of a candidate high-redshift galaxy.

Probability of CEERS-DSFG-1 having certain redshifts as derived from near-infrared (NIR) JWST data, longer-wavelength data (labeled FIR), and a combination of the two. The combined fit (green shaded area) places the strongest constraints on the redshift. This plot also shows the importance of using properly calibrated JWST data. Click to enlarge. [Zavala et al. 2023]

The team detected dust emission from the galaxy at a wavelength of 1.1 millimeters, and they tracked the galaxy at shorter wavelengths down to 2.0 microns (1 micron = 10-6 meter), at which point the emission abruptly dropped off. By using a range of models to fit the galaxy’s spectral energy distribution — the energy emitted by a source as a function of wavelength — the team showed that longer-wavelength data provide an important constraint on the galaxy’s redshift. Considering near-infrared JWST data and 1.1-millimeter data simultaneously places the galaxy at a redshift of z = 5.1 (>1 billion years after the Big Bang), while estimates based solely on the near-infrared JWST data leave open the possibility that the galaxy is located at z ~ 12–14 (300–400 million years after the Big Bang).

This study makes it clear that high-redshift galaxies detected by JWST need further investigation before they can be confirmed. Hopefully, follow-up long-wavelength observations of high-redshift candidates will confirm their redshift one way or another, allowing us to hone our models of the early universe further.

Citation

“Dusty Starbursts Masquerading as Ultra-high Redshift Galaxies in JWST CEERS Observations,” Jorge A. Zavala et al 2023 ApJL 943 L9. doi:10.3847/2041-8213/acacfe

A computerized rendering of a small spacecraft with extended solar panels shown above the surface of a grey moon. The surface is erupting with white jets of material in front of and behind the spacecraft.

Daring high-speed, low-altitude maneuvers and scientists wrestling with questions of life elsewhere in the universe: these are both elements found not only in Hollywood blockbusters, but also in a recently proposed mission to Saturn’s moon Enceladus.

But Why, Some Say, (This) Moon?

An illustration of Enceladus with a quarter of the moon removed to reveal an inner layered structure. Each layer and several other notable features are labeled. The layers are: ice shell, global ocean, rocky core.

A schematic of the interior structure of Enceladus as best understood today. The plumes are launched from the “Tiger Stripes” in the southern hemisphere. [Cable et al. 2021]

At barely 300 miles across, tiny Enceladus is not the most dominating exploration target in the outer solar system. What it lacks in size, though, it makes up for with panache. Enceladus simply cannot contain itself, and it makes its presence known by spewing forth plumes of ice and gas from an immense reservoir of liquid water trapped beneath the surface ice. This dramatic performance was intriguing enough to convince the Cassini mission to take a closer look, and what it found convinced planetary scientists that Enceladus was more than just a showboat: it’s a complex system that just might offer habitable conditions at the bottom of its ocean.

Some of Cassini’s most exciting finds were specific particles and molecules in the plumes that are usually associated with hydrothermal vents here on Earth, where strange life forms survive just fine even without sunlight. However, Cassini was limited both by the technology of its time and by its design: since its engineers didn’t know the plumes existed before it launched, it carried no instruments designed specifically to investigate them.

A top-down sketch of ellipses around Saturn. Titan's orbit is the furthest out, Enceladus's is the closest. The spacecraft trajectories are eccentric and pass between the two distances set by the other moons.

Orbital trajectory around Saturn, which is represented by the green circle. Enceladus’s orbit is marked in pink, Titan’s is shown in red. Two sets of spacecraft orbits that would allow for close flybys of Enceladus at different mission phases are marked in purple and cyan. [Mousis et al 2022]

Recently, a team of international collaborators led by Olivier Mousis (Aix-Marseille University) decided it is time to pick up where Cassini left off. In response to the European Space Agency’s (ESA) call for proposals for €550 million Medium-class missions, they submitted a concept for a spacecraft designed to fly straight through the plumes, one which would sniff out gases and ices as it buzzes less than 100 km over the surface at 4 km/s. The mission, called Moonraker, would spend more than a decade cruising to Saturn and would arrive no earlier than 2048.

Mixed Blessings

Unfortunately for the proposal team, ESA did not select Moonraker as one of the four mission concepts for further development, citing difficulties keeping the cost and mission duration within the scope of a Medium-class mission. However, what was surely disappointing news at the time seems much rosier in hindsight: since crafting this initial modest mission plan, ESA announced that they’ll soon seek proposals for much larger, €1 billion missions reliant on larger rockets. The team now plans to regroup, add a few more instruments and science goals to their concept, then resubmit a more ambitious proposal for this latest opportunity.

While it’s impossible to say which missions will ultimately get selected, it remains possible that we’ll celebrate the earliest part of the second half of this century with a robotic dive through these distant, frigid jets.

Citation

“Moonraker: Enceladus Multiple Flyby Mission,” O. Mousis et al 2022 Planet. Sci. J. 3 268. doi:10.3847/PSJ/ac9c03

painting of the aurora over the ocean

Earth sits in a sea of plasma that is usually calm. Sometimes, though, solar storms streak across space, and new research explores what can happen when two storms collide before reaching Earth.

Solar Storms on the Horizon

photograph of a coronal mass ejection

The Solar & Heliospheric Observatory (SOHO) took this coronagraphic image of a coronal mass ejection on 20 April 1998. [SOHO (ESA & NASA)]

Each year, the Sun launches tens to hundreds of coronal mass ejections (CMEs): bundles of plasma and magnetic fields flung from the Sun’s upper atmosphere out into the solar system. When a CME strikes Earth, our planet’s protective magnetic shield is compressed and distorted, admitting energetic particles from the Sun that generate the aurora — and can damage spacecraft electronics or interfere with radio communications.

A single CME is already powerful, but successive CMEs can crash into each other and combine, creating even larger storms. There’s evidence that some of the most intense solar storms that we know of, like the 1859 Carrington event that pushed the Northern Lights south to the Caribbean, resulted from two or more CMEs joining forces. In a recent publication, Gordon Koehn (Imperial College London) and collaborators sought to understand how to produce the strongest solar storm possible from the collision of two CMEs — the “perfect” storm.

representation of the modeled plasma density

Example of model output 30 hours after the launch of a single CME. The color scale shows the normalized plasma density. [Adapted from Koehn et al. 2022]

Magnetic Modeling

Koehn and coauthors used magnetohydrodynamic models to simulate pairs of CMEs and determine the strength of the resultant storm. The team explored three factors: the tilt of the CMEs with respect to Earth’s magnetic field, how their magnetic fields twist, and the time between the first and second CME being launched from the Sun.

To quantify the strength of the storms, the team measured how compressed Earth’s simulated magnetic field was and calculated the Disturbance Storm Time (Dst) index — a measure of the electric current generated by the incoming solar plasma — which is a common measure of a storm’s severity.

Scaling Storm Severity

Koehn and collaborators first simulated just one CME to test the effects of changing its orientation. They found that when the CME is oriented so that its magnetic field exactly opposes Earth’s, it causes the largest disturbance. This is because the oppositely directed magnetic fields rearrange when they meet, peeling back Earth’s protective magnetic field and allowing solar plasma to stream into the atmosphere.

plot of simulated parameters

Southward-pointing magnetic field (top), Dst index (middle), and the distance to the magnetopause (bottom)  — the boundary between the region dominated by Earth’s magnetic field and the solar wind — as a function of the time between the CMEs. [Adapted from Koehn et al. 2022]

The team then threw a second CME into the mix, launched 12–36 hours after the first but traveling three times faster. In this set of scenarios, the CMEs collided anywhere from halfway between the Sun and Earth to out beyond Earth’s orbit. The largest storm occurred when the second CME was launched 28 hours after the first, leading to a collision just before striking Earth.

Lastly, the team found that changing the direction in which the CMEs’ magnetic fields twist can convert a moderate storm into a severe one. Each of these three tests showed that changing the characteristics of two colliding CMEs can dramatically change the outcome of their collision, emphasizing the need for precise modeling of CME interactions to support space weather forecasting.

Citation

“Successive Interacting Coronal Mass Ejections: How to Create a Perfect Storm,” G. J. Koehn et al 2022 ApJ 941 139. doi:10.3847/1538-4357/aca28c

Hubble image of spiral galaxy NGC 4051

Astronomers are still trying to figure out exactly how supermassive black holes form. They may be the result of smaller black holes combining, and a new study says that these smaller black holes could show up in an upcoming survey with JWST.

It Starts with a Seed

image of the Milky Way's central supermassive black hole

Supermassive black holes like the one at the center of our galaxy, shown here in an image from the Event Horizon Telescope, may have grown from smaller “seed” black holes. [EHT Collaboration; CC BY 4.0]

The biggest black holes in the universe can tip the scales at billions of solar masses. What’s more, the first ones formed within a couple of hundred million years of the Big Bang. Just how did the universe build such gargantuan objects so quickly?

Usually black holes form when a massive star dies, but no single star could birth a black hole that big. Instead, like flowers, supermassive black holes probably grow from seeds. Perhaps the smaller black holes created by the deaths of the first massive stars merged. This could create black holes up to a thousand solar masses, which gravity could then combine into supermassive black holes. Black holes up to a million solar masses may have formed directly from the gravitational collapse of dense gas clouds in the early universe. They too would merge over time.

Finding a seed that has yet to germinate into a supermassive black hole would allow astronomers to see the process in action. Andy Goulding and Jenny Greene (both Princeton University) have recently investigated whether black hole seeds could reveal themselves in upcoming deep sky surveys with JWST. They focus on black holes with approximately one million solar masses at redshifts between 7 and 10.

Colour Differences

By definition a black hole is invisible. Its gravitational pull is so intense that it swallows all light that falls upon it. Yet black holes often reveal themselves through their accretion discs — the super-heated queue of material waiting to be devoured. Their accretion discs are often bright enough to be seen across most of the visible universe. These bright centres of distant galaxies are called active galactic nuclei.

In their study, Goulding and Greene combined templates of active galactic nuclei at lower redshifts with mock galaxy catalogs specifically created for JWST. They concluded that the best local analogs of distant seed black hole active galactic nuclei are Seyfert I galaxies — active galaxies with broad emission lines in their spectra. The ultraviolet emission of black hole seeds and Seyfert I galaxies is expected to be similar.

image of stars and galaxies in the JADES field

The JADES study region, which overlaps with the Hubble Ultra Deep Field. Click to enlarge. [NASA, ESA, CSA, M. Zamani (ESA/Webb)]

They then looked at whether these active galactic nuclei could show up in the upcoming JWST Advanced Deep Extragalactic Survey (JADES). They found that a distant active galactic nucleus powered by a seed black hole should appear a different colour to the rest of the galaxy in images taken by JWST’s Near Infrared Camera (NIRCam). Specifically, the galaxy will appear blue and the nucleus will be redder.

While it’s hard to put an exact figure on it, Goulding and Greene estimated that astronomers might expect to find a few to tens of seed black holes within a one hundred square arcminute field. Perhaps then we’ll finally start to understand how supermassive black holes came to reside in the heart of almost every galaxy in the universe.


Citation

“An Empirical Approach to Selecting the First Growing Black Hole Seeds with JWST/NIRCam,” Andy D. Goulding and Jenny E. Greene 2022 ApJL 938 L9. doi:10.3847/2041-8213/ac9614

artist's impression of a tidal disruption event

A recent study of stars ripped apart by black holes — tidal disruption events — gives insight into the properties of these rare events and reveals a new category of events that lack strong spectral features.

Disruptive Encounters

sample tidal disruption event light curve

An example light curve of a tidal disruption event. Click to enlarge. [Adapted from Hammerstein et al. 2022]

When a star passes too close to a black hole, the black hole’s powerful tidal forces spaghettify the star, stretching and elongating it until it’s eventually ripped apart. Some of the doomed star’s gas spirals toward the black hole, forming a superheated accretion disk that shines across the electromagnetic spectrum, acting like a beacon that draws our attention toward an otherwise hidden black hole.

By collecting light curves and spectra of tidal disruption events as they brighten and fade over the course of months or years, astronomers have learned much about these dramatic events. In a recent publication, researchers tackled a new sample of shredded stars, aiming to understand how their spectral signatures and light curves map to their underlying physical properties.

images of nine galaxies

A subset of the tidal disruption event–hosting galaxies identified in the study. Click to enlarge. [Adapted from Hammerstein et al. 2022]

Sorting Spectra and Lining Up Light Curves

A team led by Erica Hammerstein (University of Maryland; NASA’s Goddard Space Flight Center) selected a sample of 30 tidal disruption events observed by the Zwicky Transient Facility, which surveys the entire northern night sky every few days. The team used a set of selection criteria such as color and the time it took the event to flare and fade to distinguish the desired stellar shredding from similarly fleeting events, like supernovae.

While the tidal disruption events in the team’s sample have similar colors and light curves, their spectra revealed hidden differences; the strength of hydrogen and helium emission lines varied from event to event, and some events had no hydrogen or helium emission lines at all, revealing a previously unknown class of featureless tidal disruption events. When Hammerstein and collaborators used models to delve into their curated sample of events, they found that the featureless events tended to occur around more massive black holes, and events showing only helium emission lines involved more massive stars than the other three spectral classes.

plot of disrupted star mass for each of the four spectral types

Cumulative distribution of the mass of the disrupted star for each of the four spectral types: featureless (black), hydrogen emission features (red), helium emission features (blue), hydrogen and helium emission features (green). [Hammerstein et al. 2022]

More to Learn

Analyzing the events’ light curves revealed further trends (too many to discuss here — be sure to check out the original article!), such as a potential connection between the maximum brightness of an event and how long it takes to fade.

As is often the case when we begin to study increasingly large samples of rare phenomena, the data tend to both provide hints and pose questions. Future observatories and surveys tailored to detecting transient events, such as the decade-long Legacy Survey of Space and Time that will kick off at the Vera C. Rubin Observatory in 2024, are poised to reveal many more tidal disruption events — guiding us toward a better understanding of torn-apart stars.

Citation

“The Final Season Reimagined: 30 Tidal Disruption Events from the ZTF-I Survey,” Erica Hammerstein et al 2023 ApJ 942 9. doi:10.3847/1538-4357/aca283

1 28 29 30 31 32 112