Features RSS

Smith cloud

What caused the newly discovered “supershell” in the outskirts of our galaxy? A new study finds evidence that a high-velocity cloud may have smashed into the Milky Way’s disk millions of years ago.

Mysterious Gas Shells

GS040.2+00.6–70

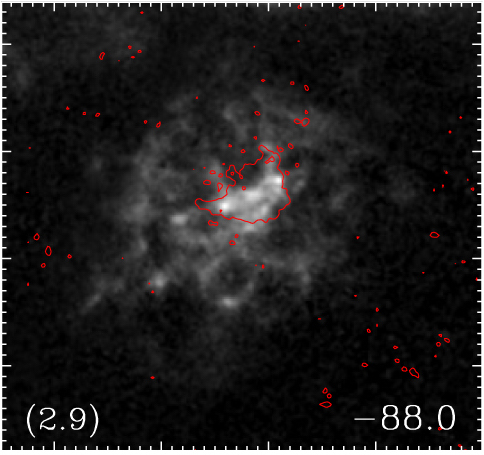
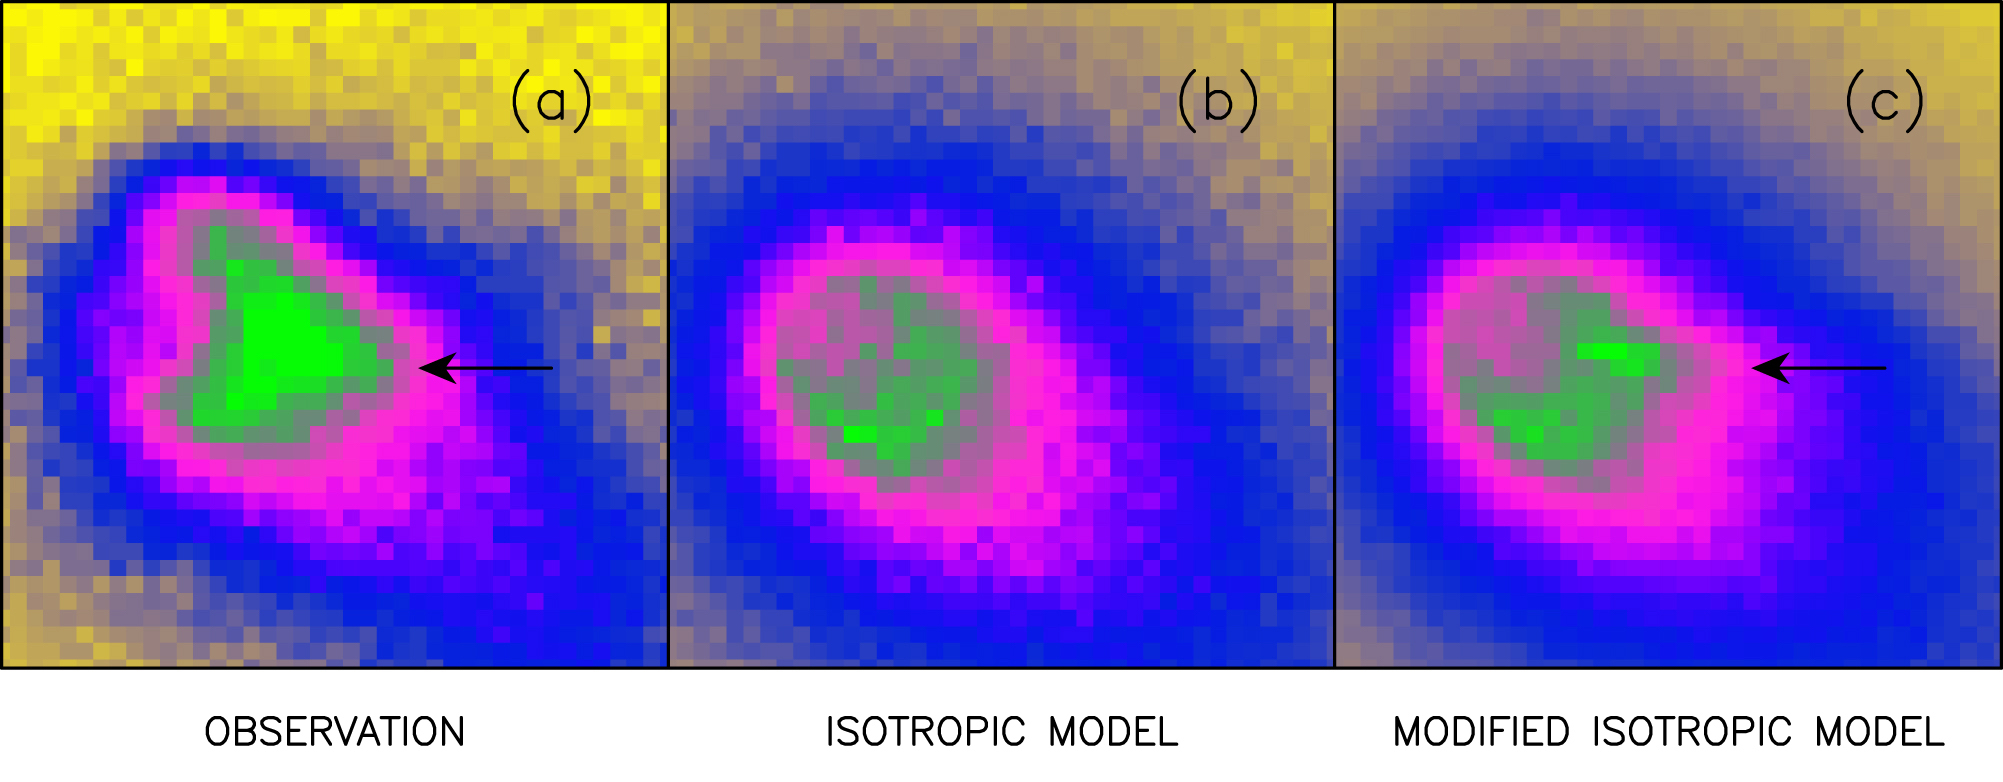
A single velocity-channel map of the supershell GS040.2+00.6–70, with red contours marking the high-velocity cloud at its center. [Adapted from Park et al. 2016]

The neutral hydrogen gas that fills interstellar space is organized into structures like filaments, loops, and shells. “Supershells” are enormous shells of hydrogen gas that can have radii of a thousand light-years or more; we’ve spotted about 20 of these in our own galaxy, and more in nearby dwarfs and spiral galaxies.

How do these structures form? One theory is that they result from several supernovae explosions occurring in the same area. But the energy needed to create a supershell is more than 3 x 1052 erg, which corresponds to over 30 supernovae — quite a lot to have exploding in the same region.

There’s an interesting alternative scenario: the supershells might instead be caused by the impacts of high-velocity clouds that fall into the galactic disk.

compact high-velocity cloud

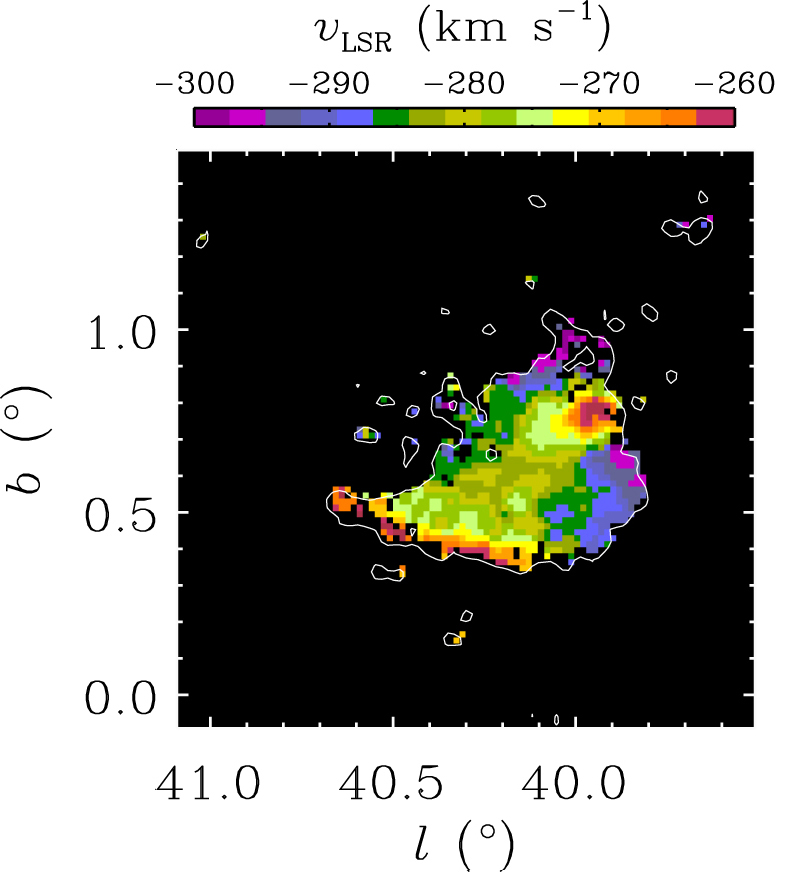
Velocity data for the compact high-velocity cloud CHVC040. The cloud is moving fast enough to create the supershell observed. [Adapted from Park et al. 2016]

The Milky Way’s Speeding Clouds

High-velocity clouds are clouds of mostly hydrogen that speed through the Milky Way with radial velocities that are very different from the material in the galactic disk. The origins of these clouds are unknown, but it’s proposed that they come from outside the galaxy — they might be fragments of a nearby, disrupting galaxy, or they might have originated from flows of accreting gas in the space in between galaxies.

Though high-velocity clouds have long been on the list of things that might cause supershells, we’ve yet to find conclusive evidence of this. But that might have just changed, with a recent discovery by a team of scientists led by Geumsook Park (Seoul National University).

Using the Arecibo radio telescope in Puerto Rico, Park and collaborators have observed a supershell in the outskirts of the Milky Way — and it has a high-velocity cloud at its center! Could this pair of objects be the evidence needed?

A Revealing Pair

The supershell, GS040.2+00.6–70, is roughly 3,000 light-years across, and it’s in the process of expanding outwards. The interior of the shell is filled with a complex structure that looks almost like spokes extending from a central hub. CHVC040, a compact high-velocity cloud, is located right at the central hub; the authors calculate a probability of less than a thousandth of a percent that this alignment is random.

supershell-HVC system

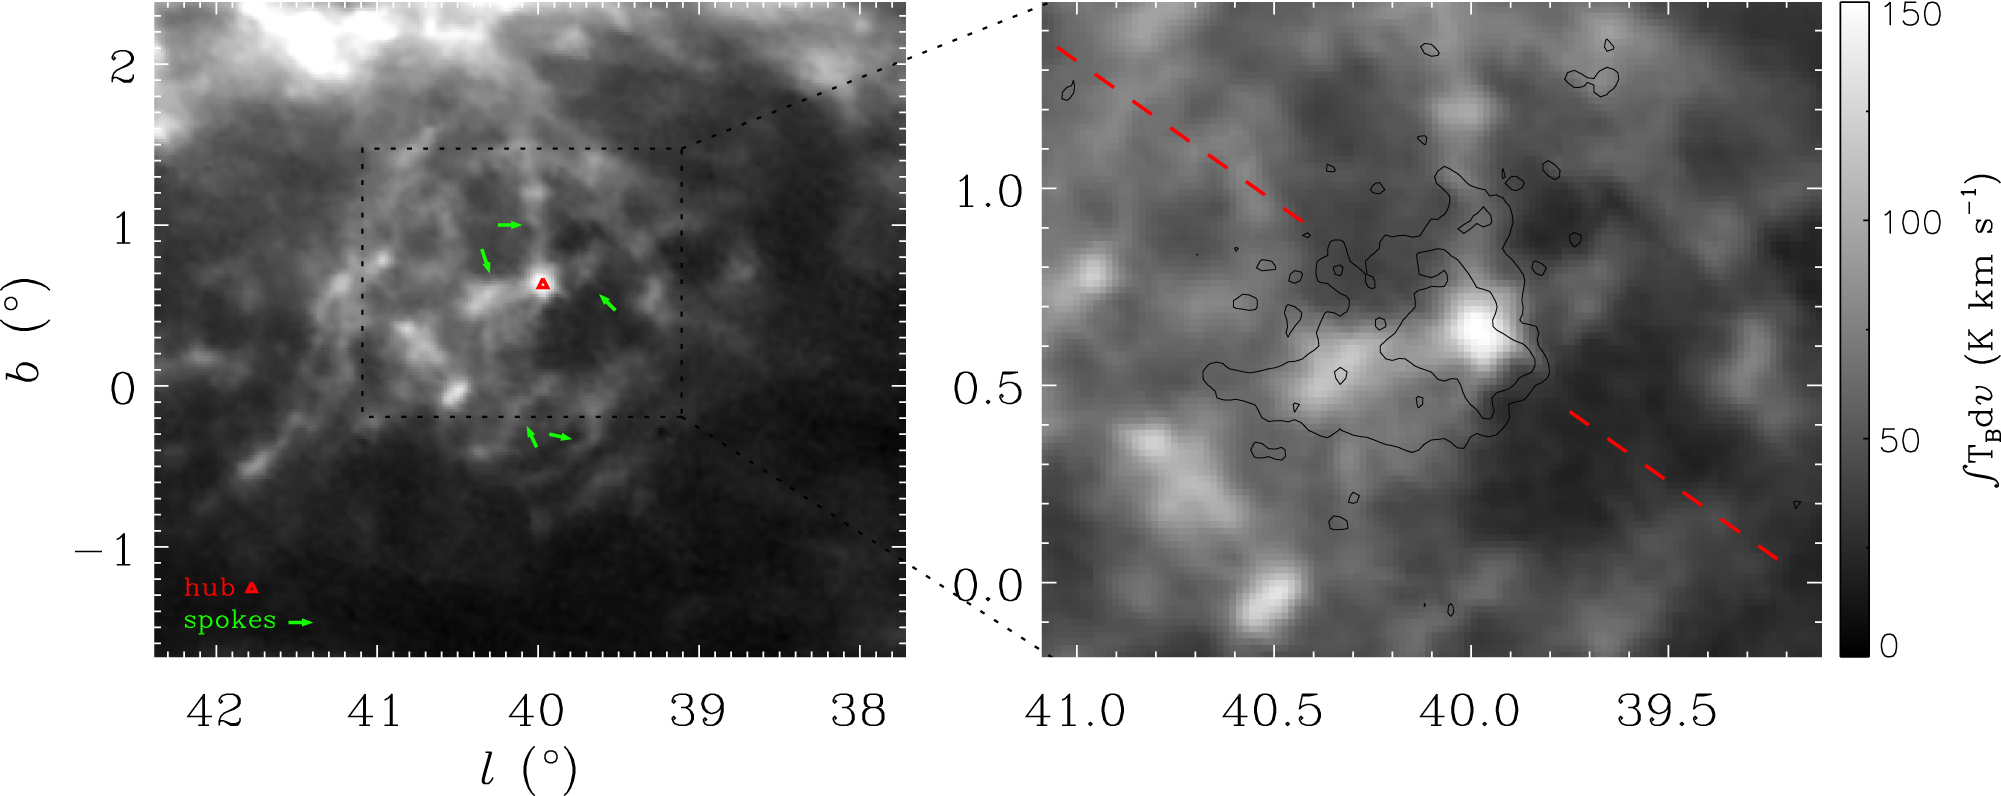
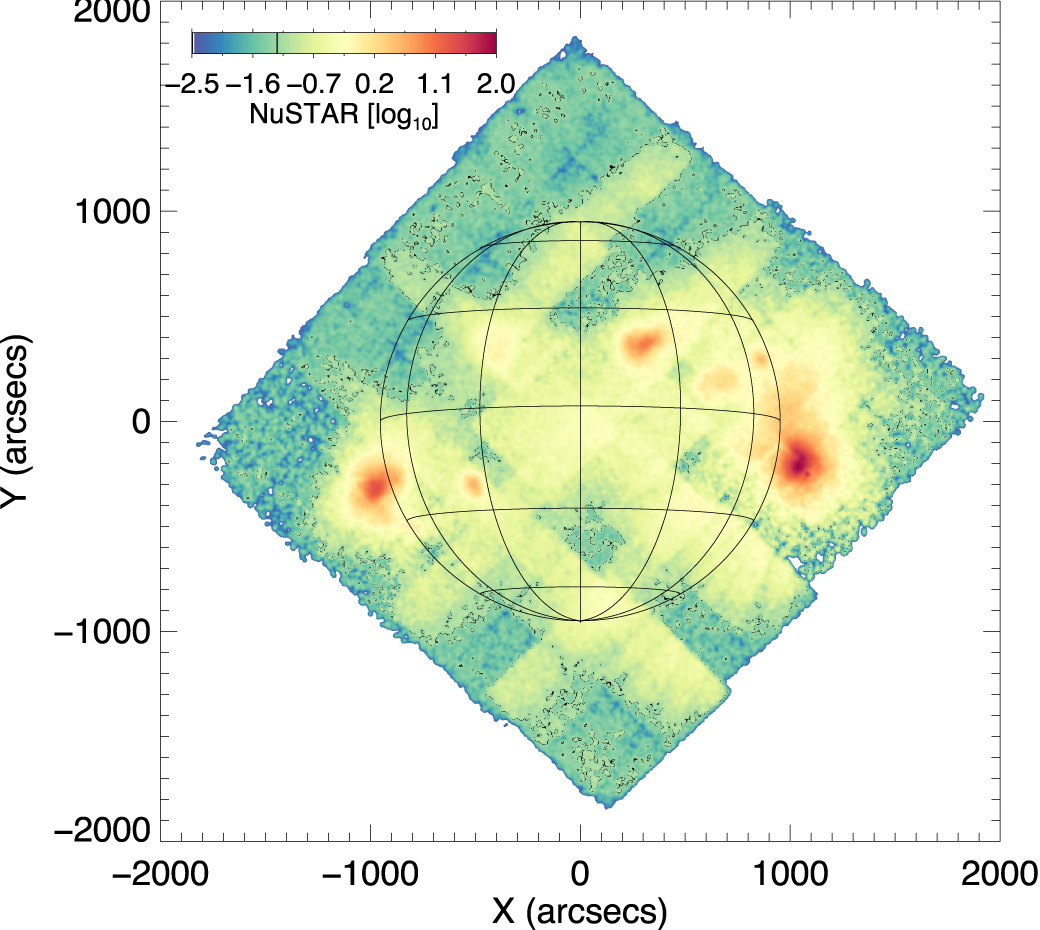
An integrated intensity map (click for a better look!) of neutral hydrogen showing the overall picture of the supershell (left), with the hub-and-spoke complex structure indicated within the shell. Contours in a close-up view (right) shows the location of the high-velocity cloud directly at the central hub. [Park et al. 2016]

Park and collaborators examine the morphology and the velocity data for the shell and the cloud. Based on the authors’ calculations, if CHVC040 were traveling at a typical velocity for high-velocity clouds (several hundred kilometers per second), it would have enough energy to have created the supershell when it slammed into the disk. The parameters of the shell allow the authors estimate when the collision happened: roughly five million years ago.

If this scenario is correct, Park and collaborators’ observations demonstrate that some compact high-velocity clouds can survive their trip through the galactic halo to smash into the galactic disk, forming a supershell on impact. A systematic study of the ~300 known compact high-velocity clouds in the Milky Way may reveal other, similar systems of compact high-velocity clouds coincident with supershells.

Citation

Geumsook Park et al 2016 ApJ 827 L27. doi:10.3847/2041-8205/827/2/L27

radio galaxy

Most radio galaxies exhibit a single pair of radio lobes marking the endpoints of their jets. But the unusual three pairs of radio lobes of a recently observed radio galaxy may reveal information about this galaxy’s past.

A 610 MHz image displaying J1216+0709’s three sets of radio lobes: inner, middle, and outer. These were likely caused by three different episodes of AGN activity. [Adapted from Singh et al. 2016]

A 610 MHz image displaying J1216+0709’s three sets of radio lobes: inner, middle, and outer. These were likely caused by three different episodes of AGN activity. [Adapted from Singh et al. 2016]

Core-Jet-Lobe

Radio galaxies, a subclass of active galactic nuclei (AGN), typically exhibit what’s known as a “core-jet-lobe” structure. A supermassive black hole accreting matter at the galaxy’s core flings material out at the poles, forming two symmetric jets of highly energetic particles. These jets can travel vast distances before spreading out into giant, radio-emitting lobes.

Thousands of these double-lobed radio galaxies have been observed, but a few dozen are unique cases that exhibit two pairs of lobes. These different pairs likely formed during two different phases of AGN activity: the jets were activated long enough to inflate the first lobes, then turned off, and then turned back on again and inflated the second lobes.

Now, the third-ever case of a triple set of lobes has been discovered: the radio galaxy J1216+0709, located roughly 2 billion light-years away.

Clues from Morphology

A spectral image map between the 325 and 620 MHz GMRT observations. There’s no signature of compact hot-spot structures in the outer lobes, indicating that the supply of jet material to the outer lobes stopped long ago. [Adapted from Singh et al. 2016]

A spectral image map between the 325 and 620 MHz GMRT observations. There’s no signature of compact hot-spot structures in the outer lobes, indicating that the supply of jet material to the outer lobes stopped long ago. [Adapted from Singh et al. 2016]

J1216+0709 is an early-type elliptical galaxy hosting a supermassive black hole of several billion solar masses at its core. The galaxy’s unusual radio structure was discovered by a team of scientists led by Veeresh Singh (Physical Research Laboratory in Ahmedabad, India), using India’s Giant Metrewave Radio Telescope (GMRT).

The radio lobes detected in J1216+0709 consist of an inner pair ~310 thousand light-years across, a nearly coaxial middle pair ~770 thousand light-years across, and an outer pair ~2.7 million light-years across. Singh and collaborators note several important observations about the galaxy’s morphology:

  1. The outer pair of lobes is much fainter than the inner pairs, and it doesn’t contain any hot spots. This makes sense if the outer lobes are the oldest, as expected, and are no longer being actively fed.
  2. The inner pairs of lobes are both brighter and longer on their eastern sides than on their western sides, suggesting that the jets are intrinsically asymmetric.
  3. The outer pair of lobes is bent with respect to the inner jets. This could mean that the material is interacting with the surrounding environment, which may have a large-scale density gradient. Alternatively, it could mean that the galaxy moved in between the two cycles of AGN activity.

Interaction as a Trigger

What could be triggering the bursts of jet activity? Singh and collaborators reference J1216+0709 against a catalog of galaxies and clusters, and find that the host galaxy is part of a small group of three galaxies.

Though there’s no visible disturbance in the host galaxy’s morphology, minor interactions with two nearby dwarf galaxies could be triggering the sporadic AGN activity. In the future, more sensitive optical data may be able to confirm this model.

Citation

Veeresh Singh et al 2016 ApJ 826 132. doi:10.3847/0004-637X/826/2/132

MWA

The modern search for extraterrestrial intelligence, known as SETI, began at radio observatories more than 50 years ago. Now scientists at the Murchison Widefield Array (MWA) in Western Australia have launched a new SETI endeavor — the first to look for signals in the low-radio-frequency regime.

New Approach

Because radio waves are such an important part of human communication, many SETI experiments search for signals from alien civilizations in radio bands — typically in the 1.4–1.7 GHz frequency range. But recently, new radio observatories are being developed in the lower-frequency range, including the MWA at 80–300 MHz.

The primary goals of the MWA are to detect neutral atomic hydrogen from the Epoch of Reionization and to study the Sun, heliosphere, and Earth’s ionosphere. In July of 2014 it was undertaking a spectral line survey of the galactic plane, when a team of scientists led by Steven Tingay (ICRAR, Curtin University, Australia; National Institute for Astrophysics, Italy) realized that this data could also be used for SETI purposes.

The Hunt for Communication

known exoplanet systems

Distribution of the 38 known exoplanet systems in the field of view of this study. [Tingay et al. 2016]

The MWA presents a unique opportunity for SETI: it’s on an extremely radio-quiet site, it’s a high-sensitivity array operating in a unique frequency range, and it has access to the southern hemisphere and an exceptionally large field of view.

Tingay and collaborators examined observations from the MWA that consisted of spectra in the 103–133 MHz range for each part of the sky in a 400-square-degree field of view. The authors compared this field to the Kepler catalog, identifying 45 planets in 38 known planetary systems within the field. They then examined the MWA spectra at the locations of each planetary system, searching for narrowband radio signals coming from the systems.

sample spectrum

Sample spectrum from one of the closest stars in the MWA field. No signals from alien civilizations are evident here. [Adapted from Tingay et al. 2016]

No Civilizations Yet

No such signals were found, and Tingay and collaborators used their observations to set upper limits on the power of any isotropic emission coming from each system. As an example, they found that no signals in the 103–133 MHz range are being broadcast from the planets around GJ 667C — which is 22 light-years away — with a power greater than ~1013 W.

This limit, however, is still 1000 times more powerful than the most powerful transmission ever deliberately broadcast into space by humans: a message sent from the Arecibo observatory with an equivalent isotropic transmission of ~1010 W. This means that these observations from the MWA may not be sensitive enough to detect messages from hypothetical alien civilizations.

Proof of Future Capabilities

SKA

Artist’s impression of the Square Kilometer Array, a future radio observatory. [SKA/Swinburne Astronomy Productions]

Tingay and collaborators are undeterred, however, arguing that the results motivate a deeper and larger search. This initial study covered a limited part of the sky at limited frequencies; the authors suggest that the next step is to perform a SETI experiment to the same depth as these observations, but over the full MWA frequency range and the full sky accessible from Western Australia. This would require a feasible ~1 month of observing time.

Longer observing time still could search even deeper, and future arrays observing in similar frequency ranges, like the Square Kilometer Array, will be even more sensitive. This study demonstrates the utility of such arrays for conducting SETI experiments in this new low-frequency band.

Citation

S. J. Tingay et al 2016 ApJ 827 L22. doi:10.3847/2041-8205/827/2/L22

misaligned stellar binary

More than half of all stars are thought to be in binary or multiple star systems. But how do these systems form? The misaligned spins of some binary protostars might provide a clue.

Two Formation Models

It’s hard to tell how multiple-star systems form, since these systems are difficult to observe in their early stages. But based on numerical simulations, there are two proposed models for the formation of stellar binaries:

  1. Turbulent fragmentation
    Turbulence within a single core leads to multiple dense clumps. These clumps independently collapse to form stars that orbit each other.
  2. Disk fragmentation
    Gravitational instabilities in a massive accretion disk cause the formation of a smaller, secondary disk within the first, resulting in two stars that orbit each other.
simulation protostars

Log column density for one of the authors’ simulated binary systems, just after the formation of two protostars. Diamonds indicate the protostar positions. [Adapted from Offner et al. 2016]

Outflows as Clues

How can we differentiate between these formation mechanisms? Led by Stella Offner (University of Massachusetts), a team of scientists has suggested that the key is to examine the alignment of the stars’ protostellar outflows — jets that are often emitted from the poles of young, newly forming stars.

Naively, we’d expect that disk fragmentation would produce binary stars with common angular momentum. As the stars’ spins would be aligned, they would therefore also launch protostellar jets that were aligned with each other. Turbulent fragmentation, on the other hand, would cause the stars to have independent angular momentum. This would lead to randomly oriented spins, so the protostellar jets would be misaligned.

simulation snapshots

Snapshots from the authors’ simulations. Left panel of each pair: column density; green arrows give protostellar spin directions. Right panel: synthetic observations produced from the simulations; cyan arrows give protostellar outflow directions. [Offner et al. 2016]

Simulations of Fragmentation

In order to better understand the alignment of protostellar outflows during binary formation, Offner and collaborators conduct a series of numerical simulations of the process of turbulent fragmentation.

The team’s radiation-magnetohydrodynamics simulations start with a spherical core with random turbulent velocities within it. The simulations then follow the formation of seeds within the core, which accrete mass and eventually launch protostellar outflows.

In total, Offner and collaborators run twelve simulations, in which five produce single stars, five produce binaries, and two produce triple star systems.

Comparison to Observations

CDF of angle

Cumulative density function of the angles between simulated binary pairs’ protostellar outflows. The black line is the MASSES data (observations of actual binaries). The alignments from the simulations are consistent with the real observational data. [Offner et al. 2016]

As a final step, the authors generate synthetic observations from their simulations, to demonstrate what the protostellar outflows would look like. They then compare these to real observations of outflow orientations in young binaries from a survey known as MASSES.

Statistical analysis shows that the protostellar jets in the authors’ simulations are consistent with being randomly aligned or misaligned. This confirms what we would expect — since the systems formed at wide separations from separate gravitational collapse events — and the alignment distribution is consistent with observations of binaries in MASSES.

Offner and collaborators’ work in this study indicates that the presence of misaligned binaries in observations supports turbulent fragmentation as the mechanism for binary formation. The authors caution, however, that we’re dealing with small-number statistics: MASSES consists of only 19 binary pairs. The next step is to obtain a larger sample of observations for comparison.

Citation

Stella S. R. Offner et al 2016 ApJ 827 L11. doi:10.3847/2041-8205/827/1/L11

planetary system

What’s the latest from the Kepler K2 mission? K2 has found its first planetary system containing more than three planets — an exciting five-planet system located ~380 light-years from Earth!

Opportunities From K2

HIP 41378 light curve

Raw K2 light curve (blue, top) and systematic corrected light curve (orange, bottom) for HIP 41378. The three deepest transits are single transits from the three outermost planet candidates. [Vanderburg et al. 2016]

The original Kepler mission was enormously successful, discovering thousands of planet candidates. But one side effect of Kepler’s original observing technique, in which it studied the same field for four years, is that it was very good at detecting extremely faint systems — systems that were often too faint to be followed up with other techniques.

After Kepler’s mechanical failure in 2013, the K2 mission was launched, in which the spacecraft uses solar pressure to stabilize it long enough to perform an 80-day searches of each region it examines. Over the course of the K2 mission, Kepler could potentially survey up to 20 times the sky area of the original mission, providing ample opportunity to find planetary systems around bright stars. These stars may be bright enough to be followed up with other techniques.

Multi-Planet Systems

There’s a catch to the 80-day observing program: the K2 mission is less likely to detect multiple planets orbiting the same star, due to the short time spent observing the system. While the original Kepler mission detected systems with up to seven planets, K2 had yet to detect systems with more than three candidates … until now.

Led by Andrew Vanderburg (NSF Graduate Research Fellow at the Harvard-Smithsonian Center for Astrophysics), a team of scientists recently analyzed K2 observations of the bright star HIP 41378. The team found that this F-type star hosts five potential planetary candidates!

phase-folded transits

Phase-folded light curve for each of the five transiting planets in the HIP 41378 system. The outermost planet (bottom panel) may provide an excellent target for transmission spectroscopy, to examine its atmosphere. [Vanderburg et al. 2016]

Newly Discovered Candidates

The system’s candidates include two sub-Neptune-sized planets, which were both observed over multiple transits. They orbit in what is nearly a 2:1 resonance, with periods of 31.7 and 15.6 days. Based on modeling of their transits, Vanderburg and collaborators estimate that they have radii of 2.6 and 2.9 Earth radii.

The system also contains three larger outer-planet candidates: one Neptune-sized (~4 Earth radii), one sub-Saturn-sized (~5 Earth radii), and one Jupiter-sized (~10 Earth radii). These planets were detected with only a single transit each, so their properties are harder to determine with certainty. The authors’ models, however, suggest that their periods are ~160 days, ~130 days, and ~1 year.

This system’s brightness, the accessible size of its planets, and its rich architecture make it an excellent target for follow-up observations. In particular, the brightness of the host star and the transit depth of the outermost planet, HIP 41378 f, make this candidate an ideal target for future transit transmission spectroscopy measurements. Since past observations of exoplanet atmospheres have been primarily of short-period, highly irradiated planets, being able to examine the atmosphere of such a long-period gas giant could open up a new regime of exoplanet atmospheric studies.

Citation

Andrew Vanderburg et al 2016 ApJ 827 L10. doi:10.3847/2041-8205/827/1/L10

asteroid

In late April of this year, asteroid P/2016 G1 (PANSTARRS) was discovered streaking through space, a tail of dust extending behind it. What caused this asteroid’s dust activity?

Asteroid or Comet?

P/2016 G1

Images of asteroid P/2016 G1 at three different times: late April, late May, and mid June. The arrow in the center panel points out an asymmetric feature that can be explained if the asteroid initially ejected material in a single direction, perhaps due to an impact. [Moreno et al. 2016]

Asteroid P/2016 G1 is an interesting case: though it has the orbital elements of a main-belt asteroid — it orbits at just under three times the Earth–Sun distance, with an eccentricity of e ~ 0.21 — its appearance is closer to that of a comet, with a dust tail extending 20” behind it.

To better understand the nature and cause of this unusual asteroid’s activity, a team led by Fernando Moreno (Institute of Astrophysics of Andalusia, in Spain) performed deep observations of P/2016 G1 shortly after its discovery. The team used the 10.4-meter Great Canary Telescope to image the asteroid over the span of roughly a month and a half.

A Closer Look at P/2016 G1

P/2016 G1 lies in the inner region of the main asteroid belt, so it is unlikely to have any ices that suddenly sublimated, causing the outburst. Instead, Moreno and collaborators suggest that the asteroid’s tail may have been caused by an impact that disrupted the parent body.

To test this idea, the team used computer simulations to model their observations of P/2016 G1’s dust tail. Based on their models, they demonstrate that the asteroid was likely activated on February 10 2016 — roughly 350 days before it reached perihelion in its orbit — and its activity was a short-duration event, lasting only ~24 days. The team’s models indicate that over these 24 days, the asteroid lost around 20 million kilograms of dust, and at its maximum activity level, it was ejecting around 8 kg/s!

Observation and model of asteroid

Comparison of the observation from late May (panel a) and two models: one in which the emission is all isotropic (panel b), and one in which the emission is initially directed (panel c). The second model better fits the observations. [Adapted from Moreno et al. 2016]

Activation By Impact

To reproduce the observed asymmetric features in the asteroid’s tail, Moreno and collaborators show that the ejected material could not have been completely isotropically emitted. Instead, the observations can be reproduced if the material was initially ejected all in the same direction (away from the Sun) at the time of the asteroid’s activation.

These conclusions support the idea that the asteroid’s parent body was impacted by another object. The initial impact caused a large ejection of material, and the subsequent activity is due to the partial or total disruption of the asteroid as a result of the impact.

To further test this model for P/2016 G1, the next step is to obtain higher-resolution and higher-sensitivity imaging (as could be provided by Hubble) of this unusual object. Such images would allow scientists to search for smaller fragments of the parent body that could remain near the dust tail.

Citation

F. Moreno et al 2016 ApJ 826 L22. doi:10.3847/2041-8205/826/2/L22

Dark matter halo

Are massive black holes hiding in the halos of galaxies, making up the majority of the universe’s mysterious dark matter? This possibility may have been ruled out by a star cluster in a small galaxy recently discovered orbiting the Milky Way.

Dark Matter Candidates

Constituents of the universe

The relative amounts of the different constituents of the universe. Dark matter makes up ~27%. [ESA/Planck]

Roughly 27% of the mass and energy in the observable universe is made up of “dark matter” — matter invisible to us, which is neither accounted for by observable baryonic matter nor dark energy.

What makes up this dark matter? Among the many proposed candidates, one of the least exotic is that of massive compact halo objects, or MACHOs. MACHOs are hypothesized to be black holes that formed in the early universe and now hide in galactic halos. We can’t detect light from these objects — but their mass adds to the gravitational pull of galaxies.

So far, MACHOs’ prospects aren’t looking great. They have not been detected in gravitational lensing surveys, ruling out MACHOs between 10-7 and 30 solar masses as the dominant component of dark matter in our galaxy. MACHOs over 100 solar masses have also been ruled out, due to the existence of fragile wide halo binaries that would have been disrupted by the presence of such large black holes.

But what about MACHOs between 30 and 100 solar masses? In a new study, Timothy Brandt (NASA Sagan Postdoctoral Fellow at the Institute for Advanced Study, in Princeton, NJ) uses a recently discovered faint galaxy, Eridanus II, to place constraints on MACHOs in this mass range.

Constraints from Eri II

MACHO constraints from the survival of a star cluster in Eri II, assuming a cluster age of 3 Gyr (a lower bound; constraints increase when assuming an age of 12 Gyr). [Adapted from Brandt 2016]

A Star Cluster in Eri II

Eridanus II is an ultra-faint dwarf galaxy that lies roughly 1.2 million light-years away from us. This dim object is a satellite galaxy of the Milky Way, discovered as part of the Dark Energy Survey. One feature of Eri II is especially intriguing: a single bright star cluster nearly coincident with the galaxy’s center.

What makes this cluster so interesting? Ultra-faint dwarf galaxies are dominated by their dark matter content — so if MACHOs make up most of the universe’s dark matter content, Eri II should be full of them! But, Brandt points out, interactions between such MACHOs and Eri II’s star cluster would result in dynamical heating of the cluster. This would cause the cluster to puff up in size.

Brandt calculates that the compact star cluster observed in Eri II couldn’t exist if the galaxy’s dark matter is made up of MACHOs of mass >15 solar masses.

Further Constraints From Other Dwarfs

Constraints from compact dwarfs

MACHO constraints from the observed sizes of compact ultra-faint dwarf galaxies. [Brandt 2016]

This same argument can be extended to the entire stellar populations of dwarf galaxies. Due to dynamical heating, compact ultra-faint dwarfs would have much larger radii than we observe if their dark matter were in the form of MACHOs.

Brandt shows that the existence of these compact dwarfs rules out dark matter consisting entirely of MACHOs of mass >10 solar masses, closing the gap in our tests of the MACHO model for dark matter. Though black holes hiding in halos could still make up part of the universe’s dark matter, an additional culprit will need to be identified to explain the bulk of it.

Citation

Timothy D. Brandt 2016 ApJ 824 L31. doi:10.3847/2041-8205/824/2/L31

NuSTAR Sun

The Nuclear Spectroscopic Telescope Array (NuSTAR) is a space telescope primarily designed to detect high-energy X-rays from faint, distant astrophysical sources. Recently, however, it’s occasionally been pointing much closer to home, with the goal of solving a few longstanding mysteries about the Sun.

NuSTAR Observation 3

Intensity maps from an observation of a quiet-Sun region near the north solar pole and an active region just below the solar limb. The quiet-Sun data will be searched for small flares that could be heating the solar corona, and the high-altitude emission above the limb may provide clues about particle acceleration. [Adapted from Grefenstette et al. 2016]

An Unexpected Target

Though we have a small fleet of space telescopes designed to observe the Sun, there’s an important gap: until recently, there was no focusing telescope making solar observations in the hard X-ray band (above ~3 keV). Conveniently, there is a tool capable of doing this: NuSTAR.

Though NuSTAR’s primary mission is to observe faint astrophysical X-ray sources, a team of scientists has recently conducted a series of observations in which NuSTAR was temporarily repurposed and turned to focus on the Sun instead.

These observations pose an interesting challenge precisely because of NuSTAR’s extreme sensitivity: pointing at such a nearby, bright source can quickly swamp the detectors. But though the instrument can’t be used to observe the bright flares and outbursts from the Sun, it’s the perfect tool for examining the parts of the Sun we’ve been unable to explore in hard X-rays before now — such as faint flares, or the quiet, inactive solar surface.

In a recently published study led by Brian Grefenstette (California Institute of Technology), the team describes the purpose and initial results of NuSTAR’s first observations of the Sun.

Solar Mysteries

What is NuSTAR hoping to accomplish with its solar observations? There are two main questions that hard X-ray observations may help to answer.

  1. How are particles accelerated in solar flares?
    The process of electron acceleration during solar flares is not well understood. When a flare-producing active region is occulted by the solar limb, NuSTAR will able to directly observe the flare loop above the solar surface — which is where that acceleration is thought to happen.
  2. How is the solar corona heated?
    The solar corona is a toasty 1–3 million Kelvin — significantly warmer than the ~6000 K solar photosphere. So how is the corona heated? One proposed explanation is that the Sun’s surface constantly emits tiny nanoflares — in active regions, or even in the quiet Sun — that are so faint that we haven’t detected them. But with its high sensitivity, NuSTAR may be able to!
NuSTAR mosaic

The first NuSTAR full-disk mosaic of the Sun. The checkerboard pattern is an artifact of the detectors being hit by particles from active regions outside of the field of view — a problem which will be reduced as the Sun enters the upcoming quieter part of the solar cycle. [Adapted from Grefenstette et al. 2016]

First Observations

In NuSTAR’s first four observations of the Sun, the team unexpectedly observed a major flare (which unsurprisingly swamped the detectors), watched the emission above an active region that was hidden by the solar limb, stared at a section of quiet Sun near the north solar pole, and composed a full-disk mosaic of the solar surface from 16 12’ x 12’ tiles.

All of these initial observations are currently being carefully analyzed and will be presented in detail in future publications. In the meantime, NuSTAR has demonstrated its effectiveness in detecting faint emission in solar hard X-rays, proving that it will be a powerful tool for heliophysics as well as for astrophysics. We look forward to seeing the future results from this campaign!

Citation

Brian W. Grefenstette et al 2016 ApJ 826 20. doi:10.3847/0004-637X/826/1/20

WISE 0855

Lying a mere 7.2 light-years away, WISE 0855 is the nearest known planetary-mass object. This brown dwarf, a failed star just slightly more massive than Jupiter, is also the coldest known compact body outside of our solar system — and new observations have now provided us with a first look at its atmosphere.

temperature-pressure profiles

Temperature–pressure profiles of Jupiter, WISE 0855, and what was previously the coldest extrasolar object with a 5-μm spectrum, Gl 570D. Thicker lines show the location of each object’s 5-μm photospheres. WISE 0855’s and Jupiter’s photospheres are near the point where water starts to condense out into clouds (dashed line). [Skemer et al. 2016]

Challenging Observations

With a chilly temperature of 250 K, the brown dwarf WISE 0855 is the closest thing we’ve been able to observe to a body resembling Jupiter’s ~130 K. WISE 0855 therefore presents an intriguing opportunity to directly study the atmosphere of an object whose physical characteristics are similar to our own gas giants.

But studying the atmospheric characteristics of such a body is tricky. WISE 0855 is too cold and faint to be able to obtain traditional optical or near-infrared (< 2.5 µm) spectroscopy of it. Luckily, like Jupiter, the opacity of its gas allows thermal emission from its deep atmosphere to escape through an atmospheric window around ~5 µm.

A team of scientists led by Andrew Skemer (UC Santa Cruz) set out to observe WISE 0855 in this window with the Gemini-North telescope and the Gemini Near-Infrared Spectrograph. Though WISE 0855 is five times fainter than the faintest object previously detected with ground-based 5-µm spectroscopy, the dry air of Mauna Kea (and a lot of patience!) allowed the team to obtain unprecedented spectra of this object.

observed vs. modeled spectrum

WISE 0855’s spectrum shows absorption features consistent with water vapor, and it’s best fit by a cloudy brown-dwarf model. [Skemer et al. 2016]

Water Clouds Found

Exoplanets and brown dwarfs cooler than ~350 K are expected to form water ice clouds in upper atmosphere — and these clouds should be thick enough to alter the emergent spectrum that we observe. Does WISE 0855 fit this picture?

Yes! By modeling the spectrum of WISE 0855, Skemer and collaborators demonstrate that it’s completely dominated by water absorption lines. This represents the first evidence of water clouds in a body outside of our solar system.

Atmospheric Turbulence

WISE 0855’s water absorption profile bears a striking resemblance to Jupiter’s. Where the spectra differ, however, is in the lower-wavelength end of observations: Jupiter also shows absorption by a molecule called phosphine, whereas WISE 0855 doesn’t.

WISE 0855 vs. Jupiter

Jupiter’s spectrum is strikingly similar to WISE 0855’s from 4.8 to 5.2 μm, where both objects are dominated by water absorption. But from 4.5 to 4.8 μm, Jupiter’s spectrum is dominated by phosphine absorption, indicating a turbulent atmosphere, while WISE 0855’s is not. [Skemer et al. 2016]

Interestingly, if the bodies were both in equilibrium, neither WISE 0855 nor Jupiter should contain detectable phosphine in their photospheres. The reason Jupiter does is because there’s a significant amount of turbulent mixing in its atmosphere that dredges up phosphine from the planet’s hot interior. The fact that WISE 0855 has no sign of phosphine suggests its atmosphere may be much less turbulent than Jupiter’s.

These observations represent an important step as we attempt to understand the atmospheres of extrasolar bodies that are similar to our own gas-giant planets. Observations of other such bodies in the future — especially using new technology like the James Webb Space Telescope — will allow us to learn more about the dynamical and chemical processes that occur in cold atmospheres.

Citation

Andrew J. Skemer et al 2016 ApJ 826 L17. doi:10.3847/2041-8205/826/2/L17

Be star

Recent, unusual X-ray observations from our galactic neighbor, the Small Magellanic Cloud, have led to an interesting model for SXP 214, a pulsar in a binary star system.

pulsar

Artist’s illustration of the magnetic field lines of a pulsar, a highly magnetized, rotating neutron star. [NASA]

An Intriguing Binary

An X-ray pulsar is a magnetized, rotating neutron star in a binary system with a stellar companion. Material is fed from the companion onto the neutron star, channeled by the object’s magnetic fields onto a “hotspot” that’s millions of degrees. This hotspot rotating past our line of sight is what produces the pulsations that we observe from X-ray pulsars.

Located in the Small Magellanic Cloud, SXP 214 is a transient X-ray pulsar in a binary with a Be-type star. This star is spinning so quickly that material is thrown off of it to form a circumstellar disk.

Recently, a team of authors led by JaeSub Hong (Harvard-Smithsonian Center for Astrophysics) have presented new Chandra X-ray observations of SXP 214, tracking it for 50 ks (~14 hours) in January 2013. These observations reveal some very unexpected behavior for this pulsar.

X-ray Puzzle

energy distribution

The energy distribution of the X-ray emission from SXP 214 over time. Dark shades or blue colors indicate high counts, and light shades or yellow colors indicate low counts. Lower-energy X-ray emission appeared only later, after about 20 ks. [Hong et al. 2016]

Three interesting pieces of information came from the Chandra observations:

  1. SXP 214’s rotation period was measured to be 211.5 s — an increase in the spin rate since the discovery measurement of a 214-second period. Pulsars usually spin down as they lose angular momentum over time … so what caused this one to spin up?
  2. Its overall X-ray luminosity steadily increased over the 50 ks of observations.
  3. Its spectrum became gradually softer (lower energy) over time; in the first 20 ks, the spectrum only consisted of hard X-ray photons above 3 keV, but after 20 ks, softer X-ray photons below 2 keV appeared.

Hong and collaborators were then left with the task of piecing together this strange behavior into a picture of what was happening with this binary system.

SXP 214 model

The authors’ proposed model for SXP 214. Here the binary has a ~30-day orbit tilted at 15° to the circumstellar disk. The pulsar passes through the circumstellar disk of its companion once per orbit. The interval marked “A” (orange line) is suggested as the period of time corresponding to the Chandra observations in this study: just as the neutron star is emerging from the disk after passing through it. [Hong et al. 2016]

Passing Through a Disk

In the model the authors propose, the pulsar is on a ~30-day eccentric orbit that takes it through the circumstellar disk of its companion once per orbit.

In this picture, the authors’ Chandra detections must have been made just as the pulsar was emerging from the circumstellar disk. The disk had initially hidden the soft X-ray emission from the pulsar, but as the pulsar emerged, that component became brighter, causing both the overall rise in X-ray counts and the shift in the spectrum to lower energies.

Since the pulsar’s accretion is fueled by material picked up as it passes through the circumstellar disk, the accretion from a recent passage through the disk likely also caused the observed spin-up to the shorter period.

If the authors’ model is correct, this series of observations of the pulsar as it emerges from the disk provides a rare opportunity to examine what happens to X-ray emission during this passage. More observations of this intriguing system can help us learn about the properties of the disk and the emission geometry of the neutron star surface.

Citation

JaeSub Hong et al 2016 ApJ 826 4. doi:10.3847/0004-637X/826/1/4

1 102 103 104 105 106 117