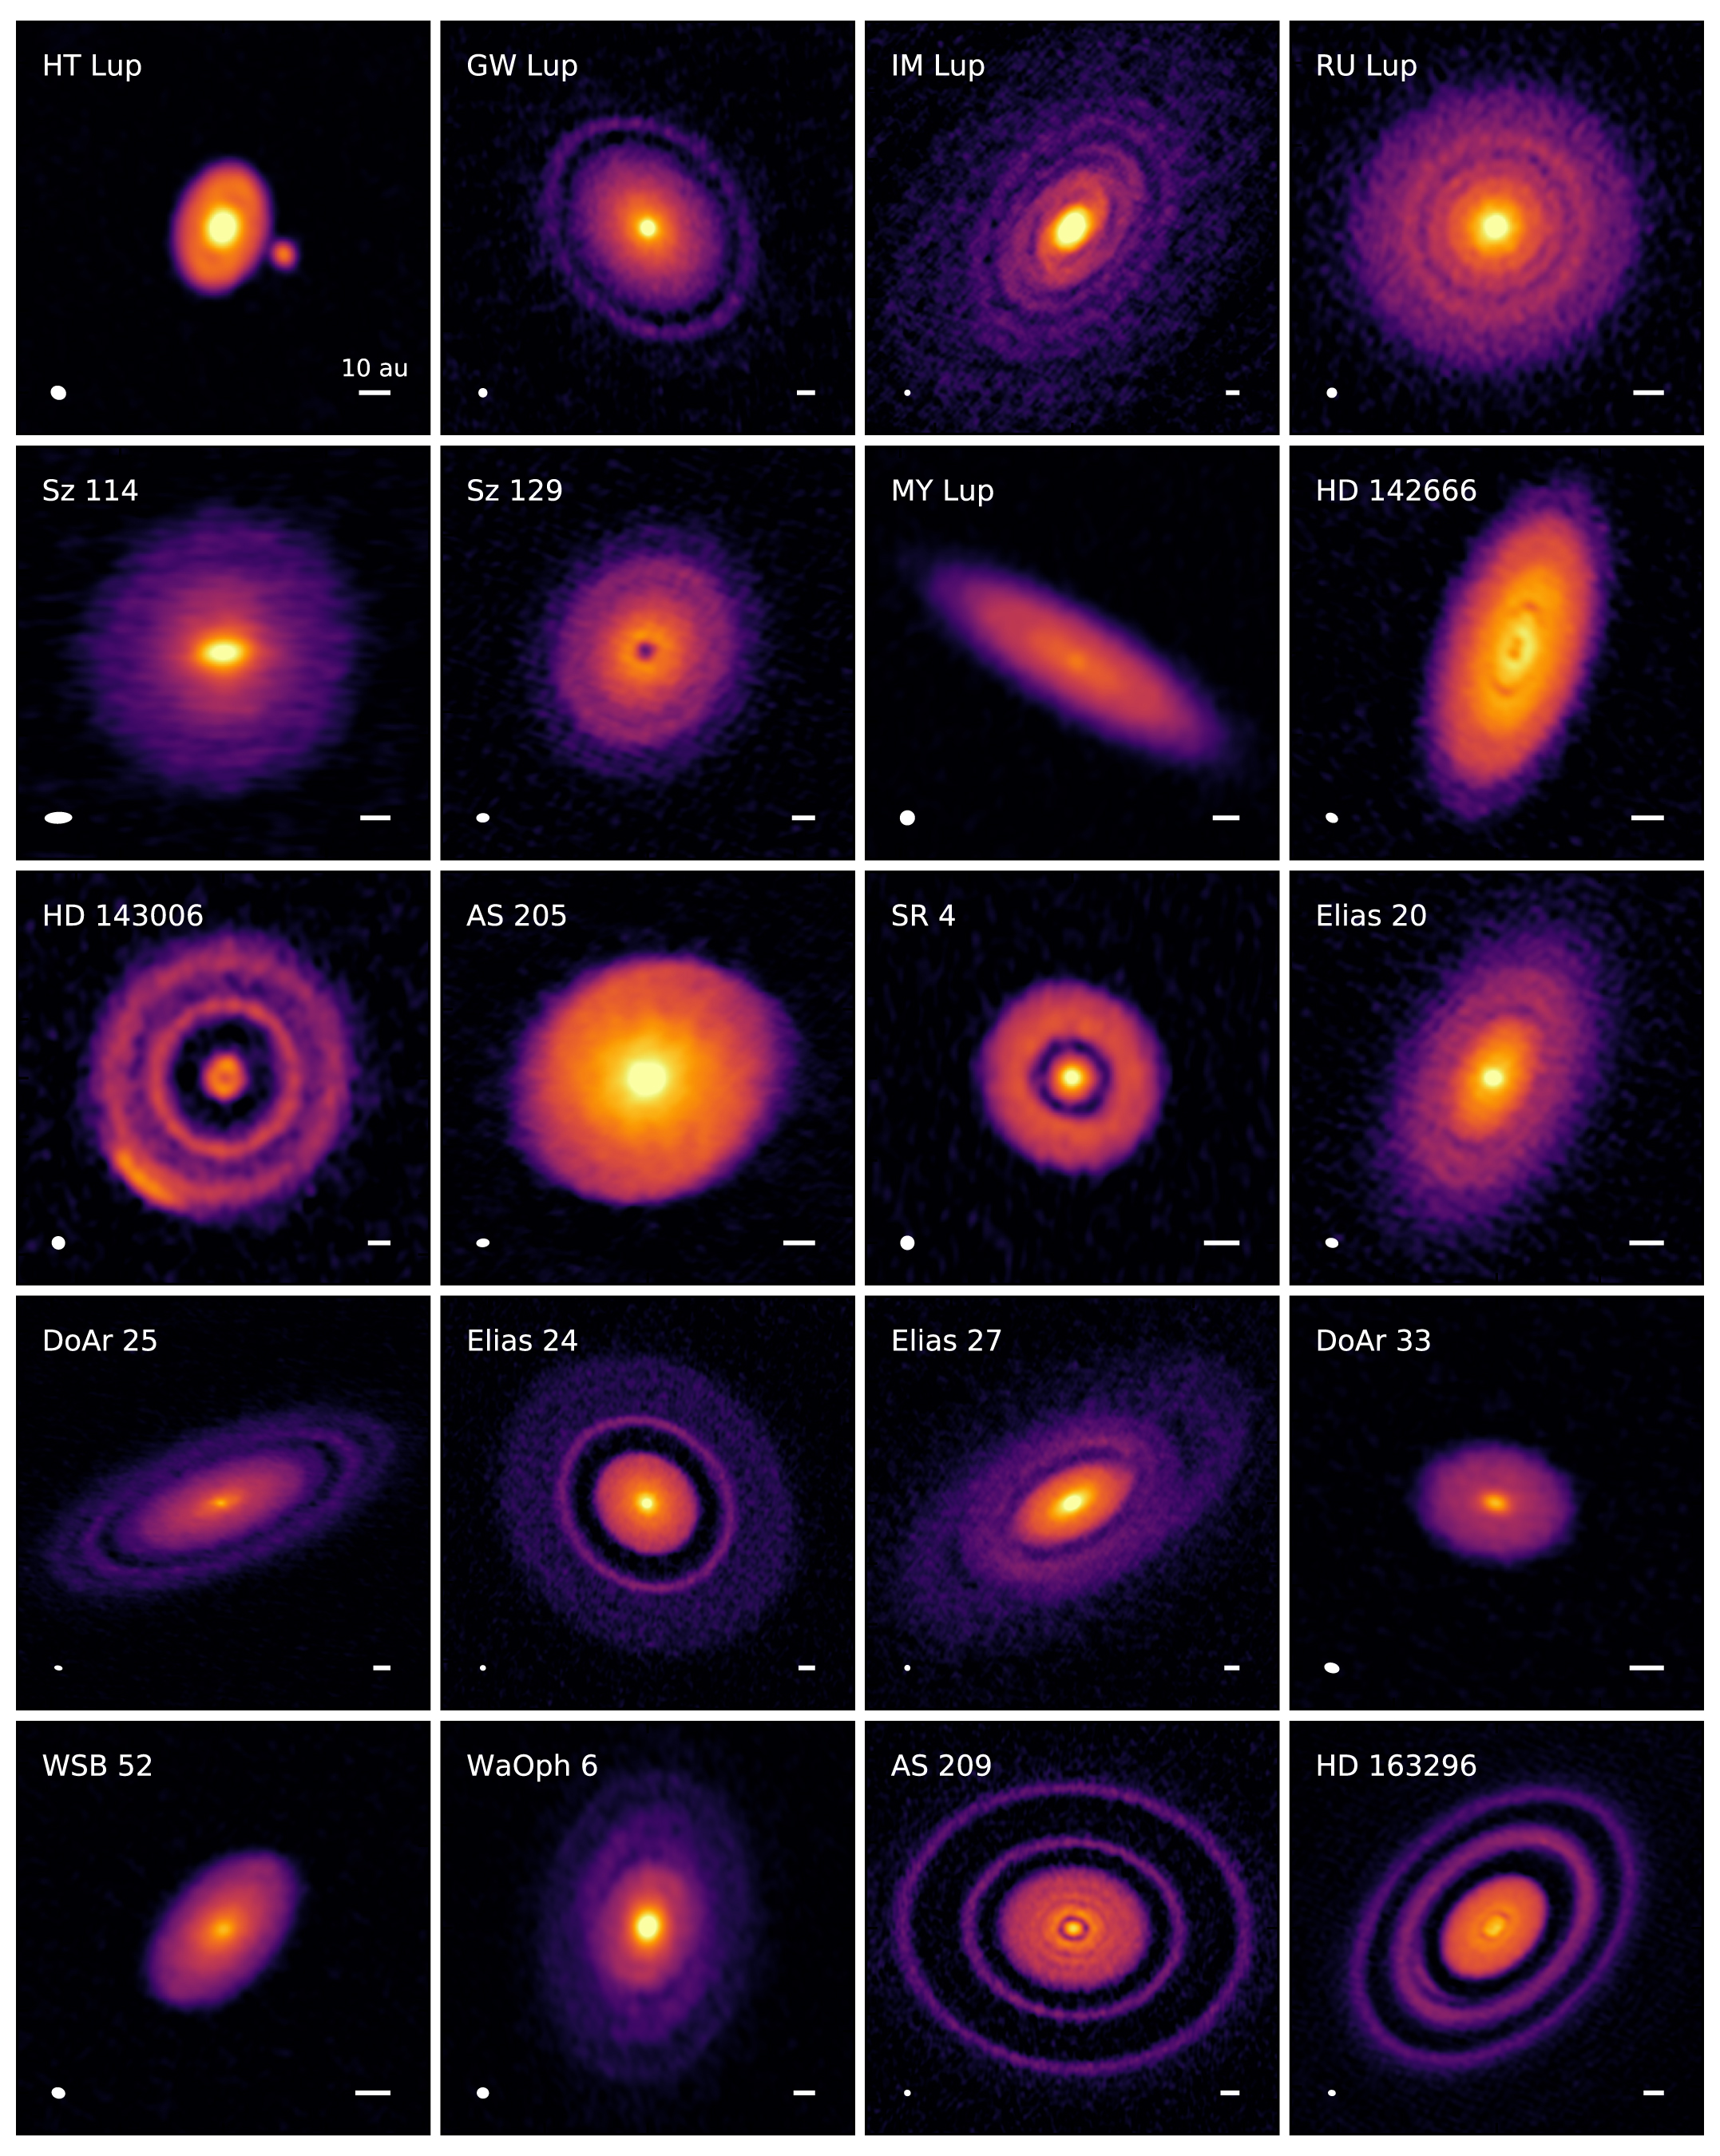
Examples from DSHARP of some of the structure observed in protoplanetary disks. Click to enlarge. [Andrews et al. 2018]
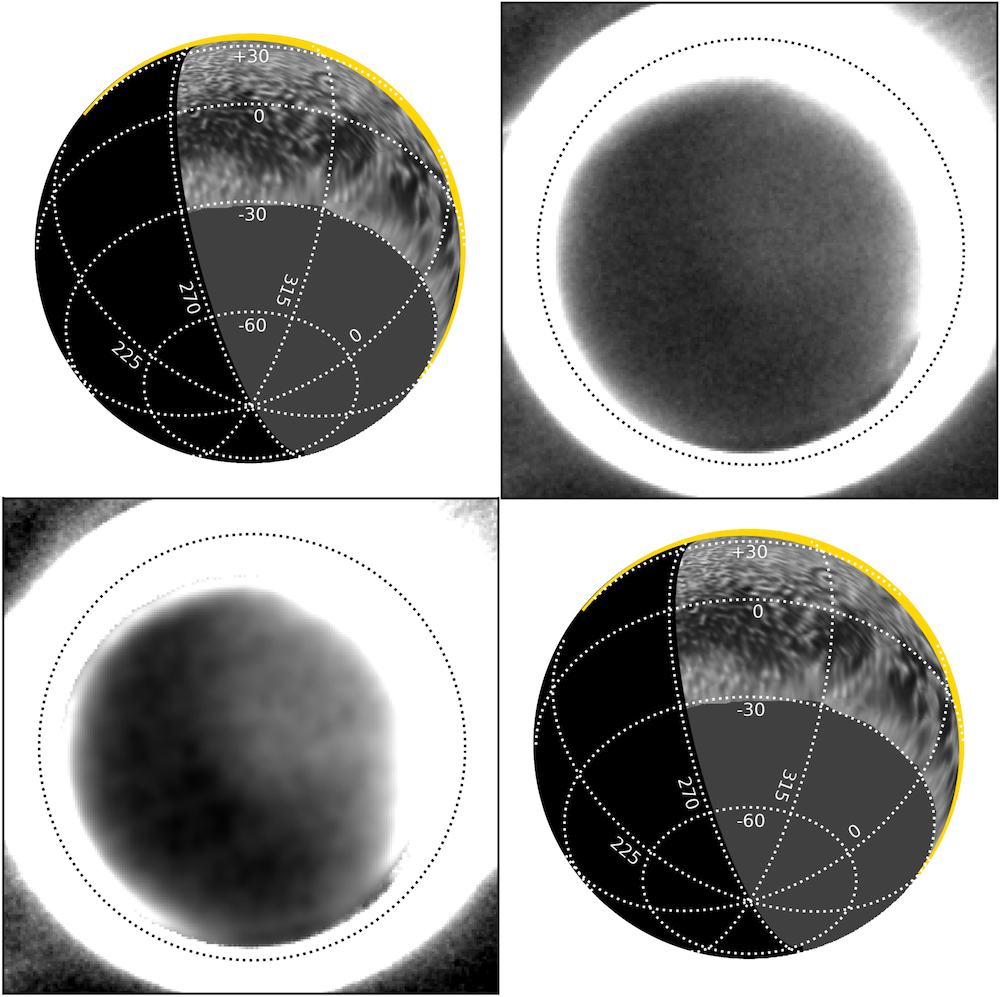
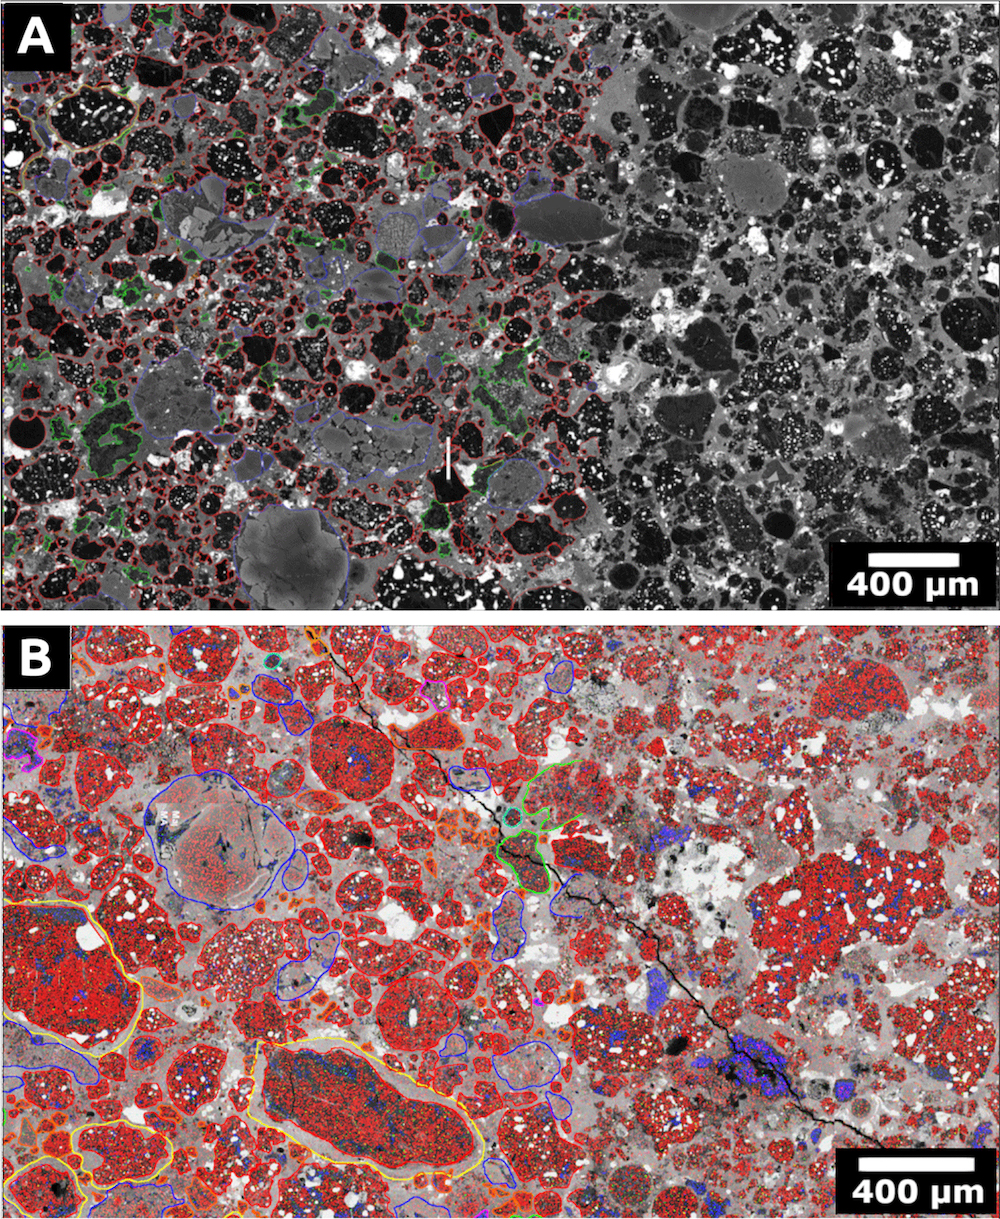
In the simulated cross-section of a protoplanetary disk shown above (see the full figure below), dust swirls around as a consequence of the recent passage of an orbiting planet. This simulation was led by Jiaqing Bi (毕嘉擎; University of Victoria, Canada) to explore what happens to the disk of gas and dust surrounding a young star when a baby planet orbits within it.
Protoplanetary disks often exhibit a dramatic structure of gaps and rings. But in some systems, the edges of gaps are puffy and ill-defined, suggesting agitated dust; in others, the gaps are sharp and well-defined, suggesting the dust there is well-settled. Could the presence of an orbiting planet explain both kinds of structure?
Bi and collaborators use their 3D simulations to model how a planet stirs up the gas and dust at the edges of gaps, and show how the properties of both the planet and the dust affect how quickly the dust settles after the planet’s passage — and thus, how sharp the disk gaps appear. To find out more about the authors’ results, check out the original article below.
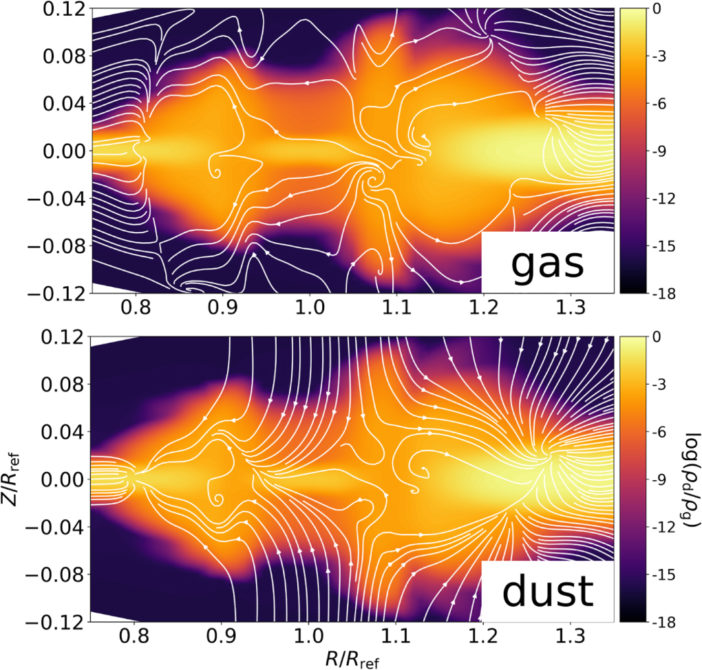
Streamlines showing the gas (top) and dust (bottom) motion in a disk, shown in cross-section, due to a planet orbiting at R/Rref=1. [Bi et al. 2021]
Citation
“Puffed-up Edges of Planet-opened Gaps in Protoplanetary Disks. I. Hydrodynamic Simulations,” Jiaqing Bi et al 2021 ApJ 912 107. doi:10.3847/1538-4357/abef6b