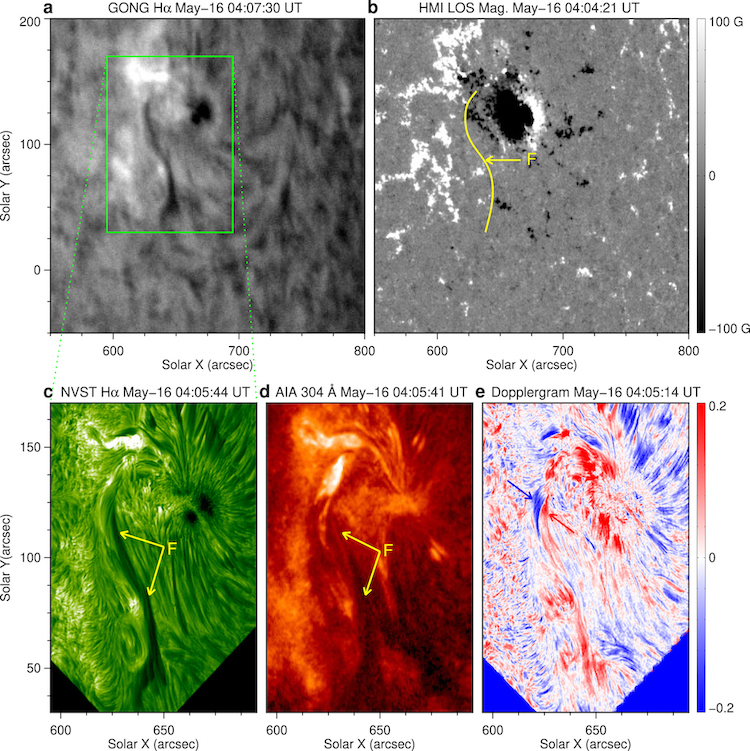
Top row: 656.3-nm emission (left) and magnetic-field strength (right) of a solar filament seen in 2019. Bottom row: detailed 656.3-nm emission (left), 30.4-nm emission (center), and velocity (right), zoomed in on the filament. The filament is indicated by the yellow arrows in the left and center panels. The arrows in the right panel indicate the twisted structure. [Guo et al. 2021]
What causes solar plasma to erupt into interplanetary space? Astronomers use highly detailed images of the solar surface to address this question, which is key for predicting the onset of solar eruptions that might impact Earth. A team led by Yilin Guo (National Astronomical Observatories, Chinese Academy of Sciences) analyzed images and data from the New Vacuum Solar Telescope, the Solar Dynamics Observatory, and the Interface Region Imaging Spectrograph to study a solar filament — an enormous arc of plasma suspended above the Sun’s surface. Solar filaments can linger for days or months before breaking free, but the cause of the eruption isn’t always clear. In Guo and collaborators’ observations of a solar filament that appeared in 2019, there is evidence that magnetic reconnection rearranged the magnetic field structure near the footprint of the filament, forcing the tightly twisted rope of plasma to move. Observations like these can help scientists understand the causes of solar eruptions and bring us one step closer to predicting them. To learn more, see the full article and animation below.
Bonus
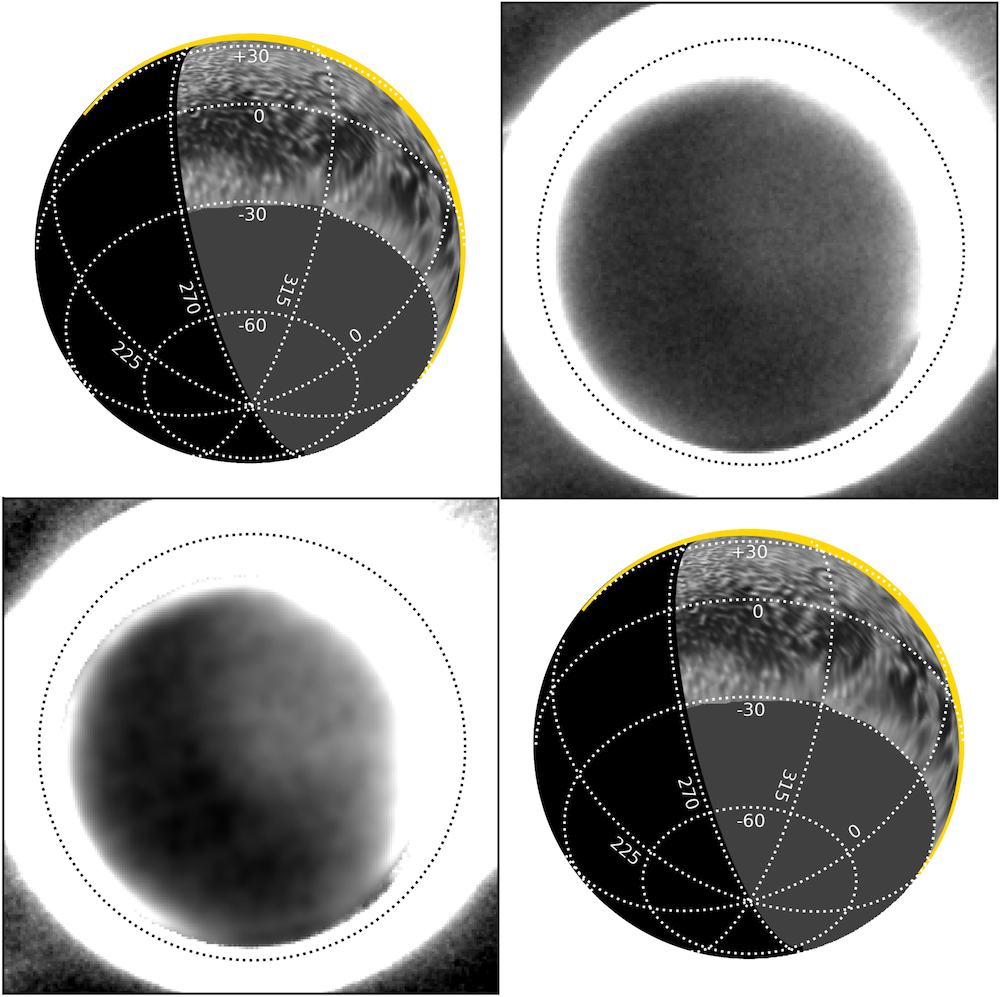
Check out this video from the authors’ article, which shows how the filament evolves over time through a variety of perspectives. Clockwise from top left: H-alpha (optical), velocity map, magnetic field strength, 17.1 nm (extreme ultraviolet), 30.4 nm (extreme ultraviolet), and 170 nm (far ultraviolet).
Citation
“Dynamical Evolution of an Active-region Filament Driven by Magnetic Reconnection,” Yilin Guo et al 2021 ApJ 920 77. doi:10.3847/1538-4357/ac1ac6