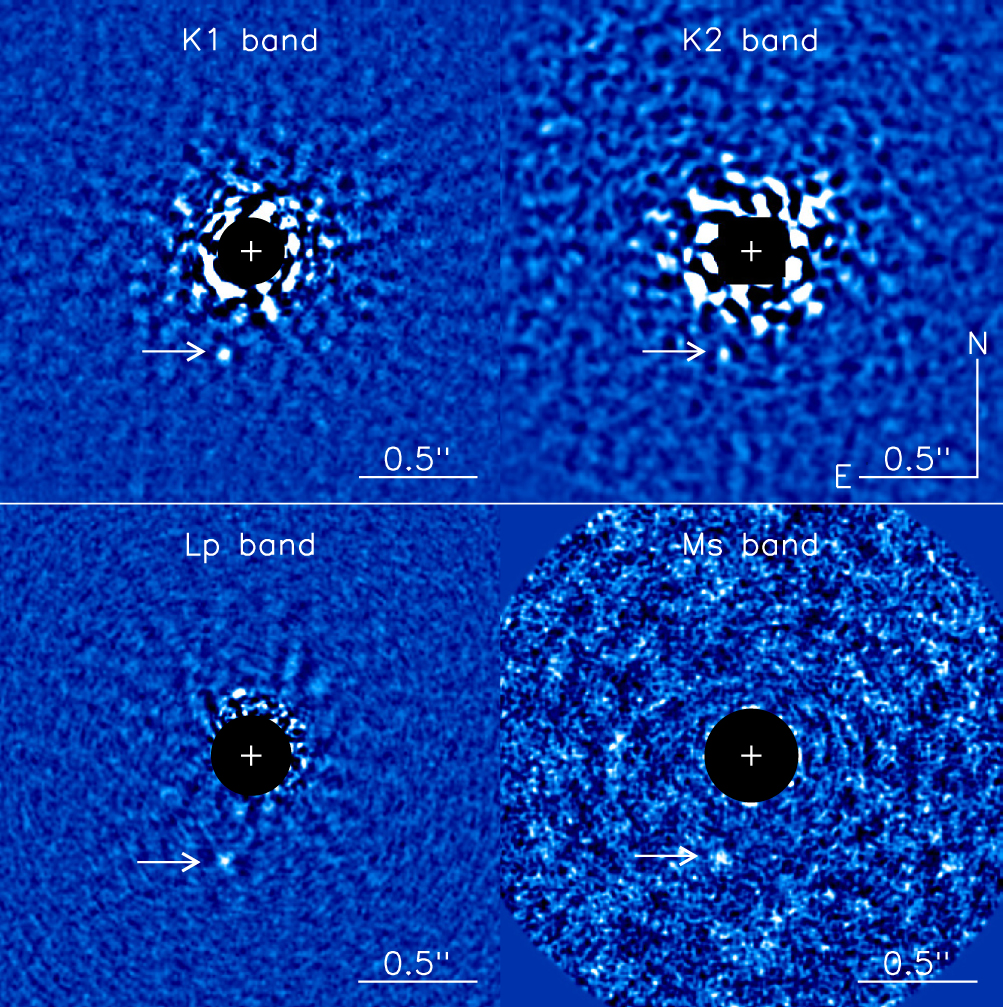
Features RSS

Helix Nebula gas

As if it weren’t enough that quasars — distant and bright nuclei of galaxies — twinkle of their own accord due to internal processes, nature also provides another complication: these distant radio sources can also appear to twinkle because of intervening material between them and us. A new study has identified a possible source for the material getting in the way.

Unexplained Variability

Helix Nebula

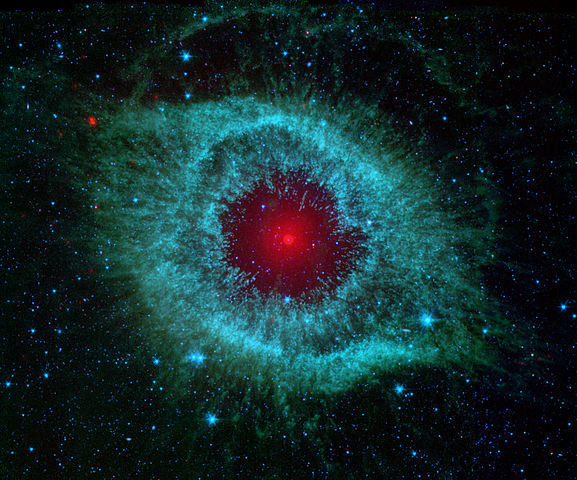
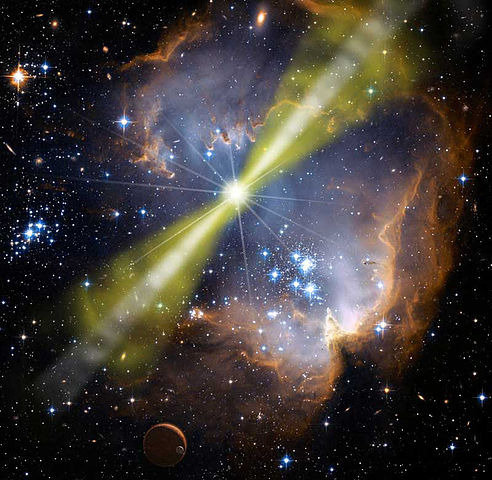
A Spitzer infrared view of the Helix nebula, which contains ionized streamers of gas extending radially outward from the central star. [NASA/JPL-Caltech/Univ. of Ariz.]

Distant quasars occasionally display extreme scintillation, twinkling with variability timescales shorter than a day. This intra-day variability is much greater than we can account for with standard models of the interstellar medium lying between the quasar and us. So what could cause this extreme scattering instead?

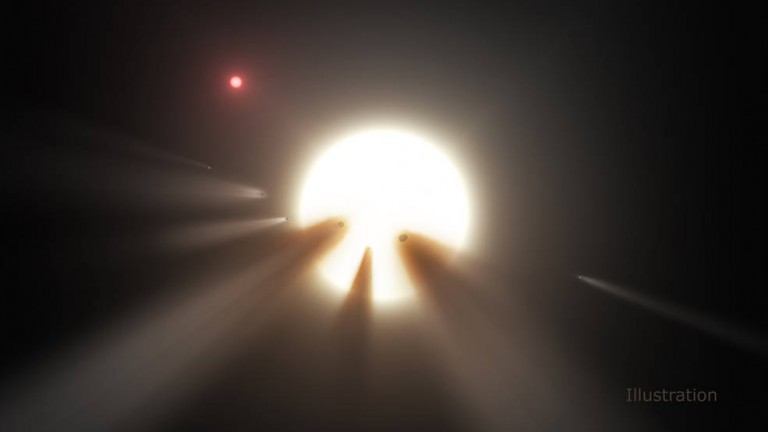
The first clue to this mystery came from the discovery of strong variability in the radio source PKS 1322–110. In setting up follow-up observations of this object, Mark Walker (Manly Astrophysics, Australia) and collaborators noticed that, in the plane of the sky, PKS 1322–110 lies very near the bright star Spica. Could this be coincidence, or might this bright foreground star have something to do with the extreme scattering observed?

Diagram of scintillation

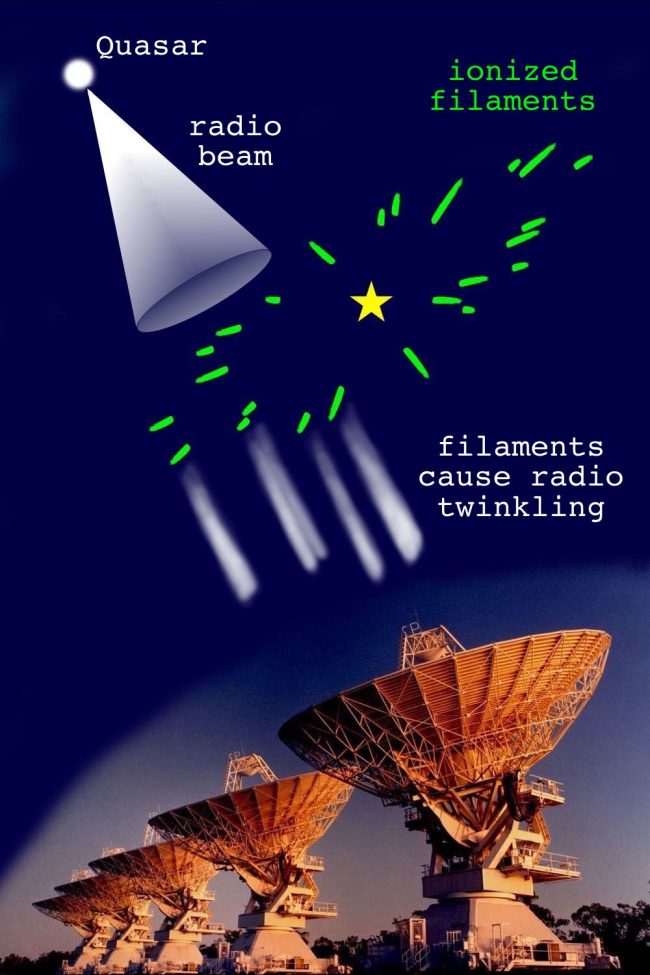
Diagram explaining the source of the intra-day radio source variability as intervening filaments surrounding a hot star. [M. Walker/CSIRO/Manly Astrophysics]

Swarms of Clumps

Walker and collaborators put forward a hypothesis: perhaps the ultraviolet photons of nearby hot stars ionize plasma around them, which in turn causes the extreme scattering of the distant background sources.

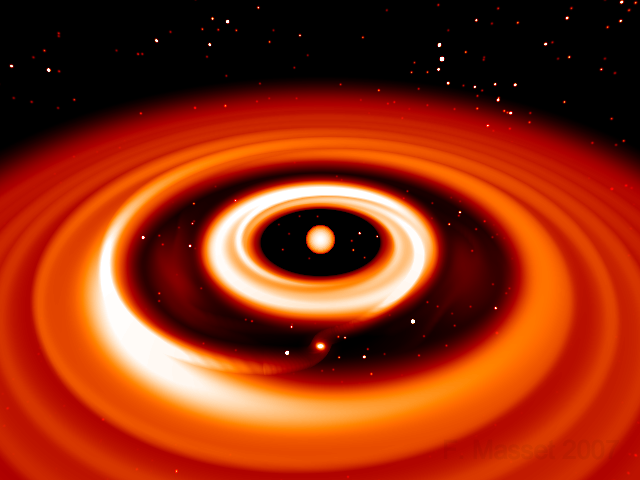
As a model, the authors consider the Helix Nebula, in which a hot, evolved star is surrounded by cool globules of molecular hydrogen gas. The radiation from the star hits these molecular clumps, dragging them into long radial streamers and ionizing their outer skins.

Though the molecular clumps in the Helix Nebula were thought to have formed only as the star evolved late into its lifetime, Walker and collaborators are now suggesting that all stars — regardless of spectral type or evolutionary stage — may be surrounded by swarms of tiny molecular clumps. Around stars that are hot enough, these clumps become the ionized plasma streamers that can cause interference with the light traveling to us from distant sources.

Significant Mass

To test this theory, Walker and collaborators explore observations of two distant radio quasars that have both exhibited intra-day variability over many years of observations. The team identified a hot A-type star near each of these two sources: J1819+3845 has Vega nearby, and PKS 1257–326 has Alhakim.

line-of-sight stars

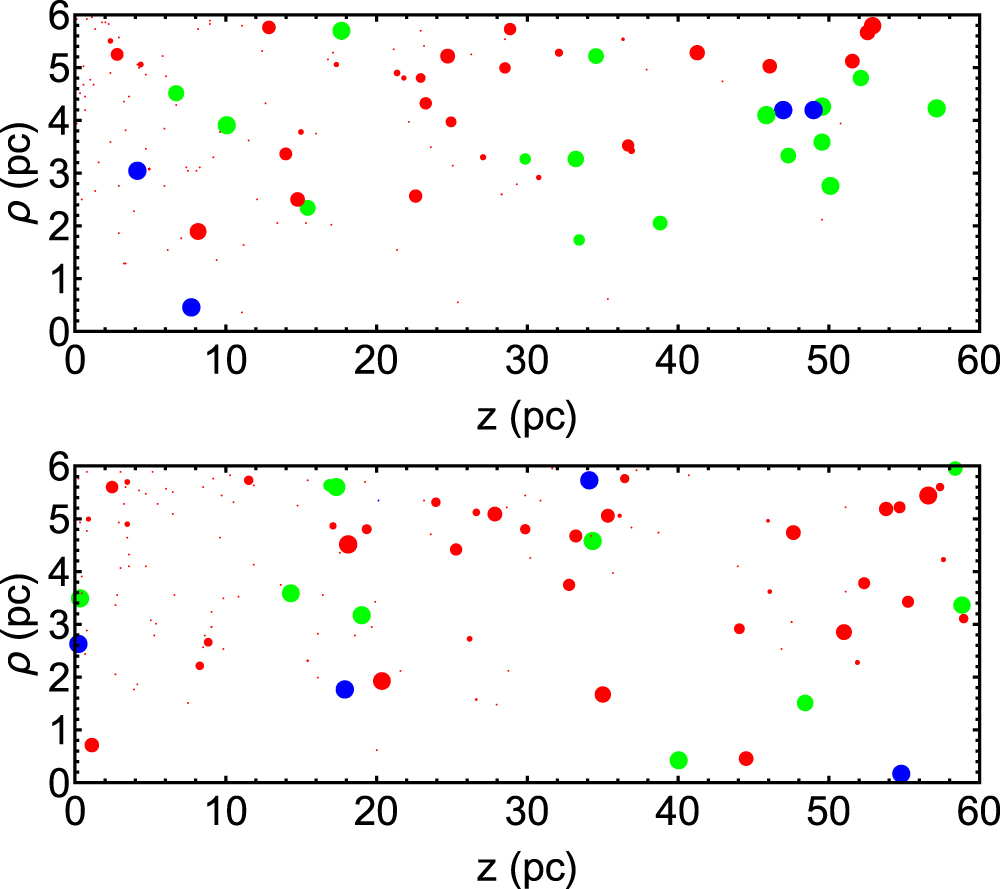
Locations of stars along the line of site to two distant quasars, J1819+3845 (top panel) and PKS 1257–326 (bottom panel). Both have a nearby, hot star (blue markers) radially within 2 pc: Vega (z = 7.7 pc) and Alhakim (z = 18 pc), respectively. [Walker et al. 2017]

By modeling the systems of the sources and stars, the authors show that the size, location, orientation, and numbers of plasma concentrations necessary to explain observations are all consistent with an environment similar to that of the Helix Nebula. Walker and collaborators find that the total mass in the molecular clumps surrounding the two stars would need to be comparable to the mass of the stars themselves.

If this picture is correct, and if all stars are indeed surrounded by molecular clumps like these, then a substantial fraction of the mass of our galaxy could be contained in these clumps. Besides explaining distant quasar scintillation, this idea would therefore have a significant impact on our overall understanding of how mass in galaxies is distributed. More observations of twinkling quasars are the next step toward confirming this picture.

Citation

Mark A. Walker et al 2017 ApJ 843 15. doi:10.3847/1538-4357/aa705c

plunging black hole

Several small, speeding clouds have been discovered at the center of our galaxy. A new study suggests that these unusual objects may reveal the lurking presence of inactive black holes.

Peculiar Clouds

high-velocity compact clouds

a) Velocity-integrated intensity map showing the location of the two high-velocity compact clouds, HCN–0.009–0.044 and HCN–0.085–0.094, in the context of larger molecular clouds. b) and c) Latitude-velocity and longitude-velocity maps for HCN–0.009–0.044 and HCN–0.085–0.094, respectively. d) and e) spectra for the two compacts clouds, respectively. Click for a closer look. [Takekawa et al. 2017]

Sgr A*, the supermassive black hole marking the center of our galaxy, is surrounded by a region roughly 650 light-years across known as the Central Molecular Zone. This area at the heart of our galaxy is filled with large amounts of warm, dense molecular gas that has a complex distribution and turbulent kinematics.

Several peculiar gas clouds have been discovered within the Central Molecular Zone within the past two decades. These clouds, dubbed high-velocity compact clouds, are characterized by their compact sizes and extremely broad velocity widths.

What created this mysterious population of energetic clouds? The recent discovery of two new high-velocity compact clouds, reported on in a paper led by Shunya Takekawa (Keio University, Japan), may help us to answer this question.

Two More to the Count

Using the James Clerk Maxwell Telescope in Hawaii, Takekawa and collaborators detected the small clouds near the circumnuclear disk at the centermost part of our galaxy. These two clouds have velocity spreads of -80 to -20 km/s and -80 to 0 km/s and compact sizes of just over 1 light-year. The clouds’ similar appearances and physical properties suggest that they may both have been formed by the same process.

Takekawa and collaborators explore and discard several possible origins for these clouds, such as outflows from massive protostars (no massive, luminous stars have been detected affiliated with these clouds), interaction with supernova remnants (no supernova remnants have been detected toward the clouds), and cloud–cloud collisions (such collisions leave other signs, like cavities in the parent cloud, which are not detected here).

black hole masses

Masses and velocities of black holes that could create the two high-velocity compact clouds fall above the red and blue lines here. [Takekawa et al. 2017]

Revealed on the Plunge

As an alternative explanation, Takekawa and collaborators propose that these two small, speeding clouds were each created when a massive compact object plunged into a nearby molecular cloud. Since we don’t see any luminous stellar counterparts to the high-velocity compact clouds, this suggests that the responsible objects were invisible black holes. As each black hole tore through a molecular cloud, it dragged some of the cloud’s gas along behind it to form the high-velocity compact cloud.

Does this explanation make sense statistically? The authors point out that the number of black holes predicted to silently lurk in the central ~30 light-years of the Milky Way is around 10,000. This makes it entirely plausible that we could have caught sight of two of them as they revealed their presence while plunging through molecular clouds.

If the authors’ interpretation is correct, then high-velocity compact clouds provide an excellent opportunity: we can search for these speeding bodies to potentially discover inactive black holes that would otherwise go undetected.

Citation

Shunya Takekawa et al 2017 ApJL 843 L11. doi:10.3847/2041-8213/aa79ee

WASP-12b

Jupiter-like planets on orbits close to their hosts are predicted to spiral ever closer to their hosts until they meet their eventual demise — and yet we’ve never observed orbital decay. Could WASP-12b provide the first evidence?

Undetected Predictions

Since the discovery of the first hot Jupiter more than 20 years ago, we’ve studied a number of these peculiar exoplanets. Despite our many observations, two phenomena predicted of hot Jupiters have not yet been detected, due to the long timescales needed to identify them:

  1. Tidal orbital decay
    Tidal forces should cause a hot Jupiter’s orbit to shrink over time, causing the planet to eventually spiral into its host star. This phenomenon would explain a number of statistical properties of observed star-planet systems (for instance, the scarcity of gas giants with periods less than a day).
  2. apsidal precession

    An illustration of apsidal precession. [Mpfiz]

    Apsidal precession
    The orbits of hot Jupiters should be apsidally precessing on timescales of decades, as long as they are at least slightly eccentric. Since the precession rate depends on the planet’s tidally deformed mass distribution, measuring this would allow us to probe the interior of the planet.

A team of scientists led by Kishore Patra (Massachusetts Institute of Technology) think that the hot Jupiter WASP-12b may be our first chance to study one of these two phenomena. The question is, which one?

WASP-12b

WASP-12b has orbital period of 1.09 days — one of the shortest periods observed for a giant planet — and we’ve monitored it for a decade, making it a great target to test for both of these long-term effects.

WASP-12b residuals

Timing residuals for WASP-12b. Squares show the new data points, circles show previous data from the past decade. The data are better fit by the decay model than the precession model, but both are still consistent. [Patra et al. 2017]

Patra and collaborators made transit observations with the 1.2-m telescope at the Fred Lawrence Whipple Observatory in Arizona and occultation observations with the Spitzer Space Telescope. These two new sets of observations, combined with the decade of previous observations, allowed the authors to fit models to WASP-12b’s orbit over time.

The results show that a constant period for WASP-12b is firmly ruled out — this planet’s orbit is definitely changing over time. The observations are best fit by a model in which the planet’s orbit is tidally decaying, but a 14-year apsidal precession cycle can’t be definitively ruled out.

Future Prospects

WASP-12b futures

Possible futures for WASP-12b’s orbit, based on the decay model (red) and the precession model (blue). We should be able to differentiate between these models with a few more years of observations. [Patra et al. 2017]

If the planet’s orbit is decaying, then the authors show that its period will shrink to zero within 3.2 million years, suggesting that we’re currently witnessing the last ~0.2% of the planet’s lifetime. Supporting the orbital-decay hypothesis are independent observations that suggest WASP-12b is approaching a point of tidal disruption — it appears to have an extended and escaping exosphere, for instance.

While we can’t yet state for certain that WASP-12b’s orbit is decaying, the authors argue that we should be able to tell conclusively with a few more years of observations. Either of the two outcomes above — orbital decay or apsidal precession — would have exciting scientific implications, however: if WASP-12b’s orbit is decaying, we can measure the tidal dissipation rate of the star. If its orbit is apsidally precessing, we may be able to measure the tidal deformability of an exoplanet. Future observations of this hot Jupiter should prove interesting!

Citation

Kishore C. Patra et al 2017 AJ 154 4. doi:10.3847/1538-3881/aa6d75

Circumplanetary disk

Giant planets are thought to form in circumstellar disks surrounding young stars, but material may also accrete into a smaller disk around the planet. We’ve never detected one of these circumplanetary disks before — but thanks to new simulations, we now have a better idea of what to look for.

giant planet formation

Image from previous work simulating a Jupiter-mass planet forming inside a circumstellar disk. The planet has its own circumplanetary disk of accreted material. [Frédéric Masset]

Elusive Disks

In the formation of giant planets, we think the final phase consists of accretion onto the planet from a disk that surrounds it. This circumplanetary disk is important to understand, since it both regulates the late gas accretion and forms the birthplace of future satellites of the planet.

We’ve yet to detect a circumplanetary disk thus far, because the resolution needed to spot one has been out of reach. Now, however, we’re entering an era where the disk and its kinematics may be observable with high-powered telescopes (like the Atacama Large Millimeter Array).

To prepare for such observations, we need models that predict the basic characteristics of these disks — like the mass, temperature, and kinematic properties. Now a researcher at the ETH Zürich Institute for Astronomy in Switzerland, Judit Szulágyi, has worked toward this goal.

Simulating Cooling

Szulágyi performs a series of 3D global radiative hydrodynamic simulations of 1, 3, 5, and 10 Jupiter-mass (MJ) giant planets and their surrounding circumplanetary disks, embedded within the larger circumstellar disk around the central star.

disk density, temp, ang mom

Density (left column), temperature (center), and normalized angular momentum (right) for a 1 MJ planet over temperatures cooling from 10,000 K (top) to 1,000 K (bottom). At high temperatures, a spherical circumplanetary envelope surrounds the planet, but as the planet cools, the envelope transitions around 6–4,000 K to a flattened disk. [Szulágyi 2017]

This work explores the effects of different planet temperatures and masses on the properties of the disks. Szulágyi specifically examines a range of planetary temperatures between 10,000 K and 1,000 K for the 1 MJ planet. Since the planet cools as it radiates away its formation heat, the different temperatures represent an evolutionary sequence over time.

Predicted Characteristics

Szulágyi’s work produced a number of intriguing observations, including the following:

  1. For the 1 MJ planet, a spherical circumplanetary envelope forms at high temperatures, flattening into a disk as the planet cools. Higher-mass planets form disks even at high temperatures.
  2. The disk has a steep temperature profile from inside to outside, and the whole disk is too hot for water to remain frozen. This suggests that satellites couldn’t form in the disk earlier than 1 Myr after the planet birth. The outskirts of the disk cool first as the planet cools, indicating that satellites may eventually form in these outer parts and then migrate inward.
  3. The planets open gaps in the circumstellar disk as they orbit. As a planet radiates away its formation heat, the gap it opens becomes deeper and wider (though this is a small effect). For high-mass planets (>5 MJ), the gap eccentricity increases, which creates a hostile environment for satellite formation.

Szulágyi discusses a number of features of these disks that we can plan to search for in the future with our increasing telescope power — including signatures in direct imaging and observations of their kinematics. The results from these simulations will help us both to detect these circumplanetary disks and to understand our observations when we do. These future observations will then allow us to learn about late-stage giant-planet formation as well as the formation of their satellites.

Citation

J. Szulágyi 2017 ApJ 842 103. doi:10.3847/1538-4357/aa7515

starspots

The unusual light curve of the star KIC 8462852, also known as “Tabby’s star” or “Boyajian’s star”, has puzzled us since its discovery last year. A new study now explores whether the star’s missing flux is due to internal blockage rather than something outside of the star.

Mysterious Dips

comets around a star

Most explanations for the flux dips of Boyajian’s star rely on external factors, like this illustrated swarm of comets. [NASA/JPL-Caltech]

Boyajian’s star shows unusual episodes of dimming in its light curve by as much as 20%, each lasting a few to tens of days and separated by periods of typically hundreds of days. In addition, archival observations show that it has gradually faded by roughly 15% over the span of the last hundred years. What could be causing both the sporadic flux dips and the long-term fading of this odd star?

Explanations thus far have varied from mundane to extreme. Alien megastructures, pieces of smashed planets or comets orbiting the star, and intervening interstellar medium have all been proposed as possible explanations — but these require some object external to the star. A new study by researcher Peter Foukal proposes an alternative: what if the source of the flux obstruction is the star itself?

Analogy to the Sun

Decades ago, researchers discovered that our own star’s total flux isn’t as constant as we thought. When magnetic dark spots on the Sun’s surface block the heat transport, the Sun’s luminosity dips slightly. The diverted heat is redistributed in the Sun’s interior, becoming stored as a very small global heating and expansion of the convective envelope. When the blocking starspot is removed, the Sun appears slightly brighter than it did originally. Its luminosity then gradually relaxes, decaying back to its original value.

starspot model

Model of a star’s flux after a 1,000-km starspot is inserted at time t = 0 and removed at time t = ts at a depth of 10,000 km in the convective zone. The star’s luminosity dips, then becomes brighter than originally, and then gradually decays. [Foukal 2017]

Foukal recognized that this phenomenon may also provide an explanation for Boyajian’s star. He modeled how this might occur for Boyajian’s star, demonstrating that if its flux is somehow blocked from reaching the surface and stored in a shallow convective zone, this can account for the 20% dips seen in the star’s light curve.

In addition, these sporadic flux-blocking events would cause Boyajian’s star to constantly be relaxing from the post-blockage enhanced luminosity. This decay — which occurs at rates of 0.1–1% brightness per year for convective-zone depths of tens of thousands of kilometers — would nicely account for the long-term, gradual dimming observed.

What’s blocking the flux? Foukal postulates a few options, including magnetic activity (as with the Sun), differential rotation, sporadic changes in photospheric abundances, and simply random variation in convective efficiency.

Strangely Unique

latest dips

Boyajian’s star’s flux in May and June shows some brand new dips. Note that the team now names them! [Tabetha Boyajian and team]

So why have we only found one star with light curves like Boyajian’s? If these are inherently natural processes in the star, we would expect to have seen more than one such object. This may be selection effect — Boyajian’s star lies at the hot end of the range of stars that Kepler observes — or it may be that the star is reaching the end of its convective lifetime.

Until we discover more cases, the best we can hope for is more data from Boyajian’s star itself. Conveniently, it has continued to keep us on our toes, with new dips in May and June. Perhaps our continued observations will finally reveal the answer to this mystery.

Citation

Peter Foukal 2017 ApJL 842 L3. doi:10.3847/2041-8213/aa740f

Planetary-mass binary

An object previously identified as a free-floating, large Jupiter analog turns out to be two objects — each with the mass of a few Jupiters. This system is the lowest-mass binary we’ve ever discovered.

Tracking Down Ages

TW Hydrae Association

2MASS J11193254–1137466 is thought to be a member of the TW Hydrae Association, a group of roughly two dozen young stars moving together in the solar neighborhood. [University of Western Ontario/Carnegie Institution of Washington DTM/David Rodriguez]

Brown dwarfs represent the bottom end of the stellar mass spectrum, with masses too low to fuse hydrogen (typically below ~75-80 Jupiter masses). Observing these objects provides us a unique opportunity to learn about stellar evolution and atmospheric models — but to properly understand these observations, we need to determine the dwarfs’ masses and ages.

This is surprisingly difficult, however. Brown dwarfs cool continuously as they age, which creates an observational degeneracy: dwarfs of different masses and ages can have the same luminosity, making it difficult to infer their physical properties from observations.

We can solve this problem with an independent measurement of the dwarfs’ masses. One approach is to find brown dwarfs that are members of nearby stellar associations called “moving groups”. The stars within the association share the same approximate age, so a brown dwarf’s age can be estimated based on the easier-to-identify ages of other stars in the group.

An Unusual Binary

Recently, a team of scientists led by William Best (Institute for Astronomy, University of Hawaii) were following up on such an object: the extremely red, low-gravity L7 dwarf 2MASS J11193254–1137466, possibly a member of the TW Hydrae Association. With the help of the powerful adaptive optics on the Keck II telescope in Hawaii, however, the team discovered that this Jupiter-like object was hiding something: it’s actually two objects of equal flux orbiting each other.

Keck binary

Keck images of 2MASS J11193254–1137466 reveal that this object is actually a binary system. A similar image of another dwarf, WISEA J1147-2040, is shown at bottom left for contrast: this one does not show signs of being a binary at this resolution. [Best et al. 2017]

To learn more about this unusual binary, Best and collaborators began by using observed properties like sky position, proper motion, and radial velocity to estimate the likelihood that 2MASS J11193254–1137466AB is, indeed, a member of the TW Hydrae Association of stars. They found roughly an 80% chance that it belongs to this group.

Under this assumption, the authors then used the distance to the group — around 160 light-years — to estimate that the binary’s separation is ~3.9 AU. The assumed membership in the TW Hydrae Association also provides binary’s age: roughly 10 million years. This allowed Best and collaborators to estimate the masses and effective temperatures of the components from luminosities and evolutionary models.

Planetary-Mass Objects

2MASS J1119–1137 among ultracool dwarfs

The positions of 2MASS J11193254–1137466A and B on a color-magnitude diagram for ultracool dwarfs. The binary components lie among the faintest and reddest planetary-mass L dwarfs. [Best et al. 2017]

The team found that each component is a mere ~3.7 Jupiter masses, placing them in the fuzzy region between planets and stars. While the International Astronomical Union considers objects below the minimum mass to fuse deuterium (around 13 Jupiter masses) to be planets, other definitions vary, depending on factors such as composition, temperature, and formation. The authors describe the binary as consisting of two planetary-mass objects.

Regardless of its definition, 2MASS J11193254–1137466AB qualifies as the lowest-mass binary discovered to date. The individual masses of the components also place them among the lowest-mass free-floating brown dwarfs known. This system will therefore be a crucial benchmark for tests of evolutionary and atmospheric models for low-mass stars in the future.

Citation

William M. J. Best et al 2017 ApJL 843 L4. doi:10.3847/2041-8213/aa76df

Mercury

If space rocks are unpleasant to encounter, space dust isn’t much better. Mercury’s cratered surface tells of billions of years of meteoroid impacts — but its thin atmosphere is what reveals its collisional history with smaller impactors. Now new research is providing a better understanding of what we’re seeing.

Micrometeoroids Ho!

The inner solar system is bombarded by micrometeoroids, tiny particles of dust (on the scale of a tenth of a millimeter) emitted by asteroids and comets as they make their closest approach to the Sun. This dust doesn’t penetrate Earth’s layers of atmosphere, but the innermost planet of our solar system, Mercury, doesn’t have this convenient cushioning.

Just as Mercury is affected by the impacts of large meteoroids, it’s also shaped by the many smaller-scale impacts it experiences. These tiny collisions are thought to vaporize atoms and molecules from the planet’s surface, which quickly dissociate. This process adds metals to Mercury’s exosphere, the planet’s extremely tenuous atmosphere.

Modeling Populations

Impactor source distributions

Distribution of the directions from which meteoroids originate before impacting Mercury’s surface, as averaged over its entire orbit. Local time of 12 hr corresponds to the Sun-facing side. A significant asymmetry is seen between the dawn (6 hrs) and dusk (18 hrs) rates. [Pokorný et al. 2017]

The metal distribution in the exosphere provides a way for us to measure the effect of micrometeoroid impacts on Mercury — but this only works if we have accurate models of the process. A team of scientists led by Petr Pokorný (The Catholic University of America and NASA Goddard SFC) has now worked to improve our picture of micrometeoroid impact vaporization on Mercury.

Pokorný and collaborators argue that two meteoroid populations — Jupiter-family comets (short-period) and Halley-type comets (long-period) — contribute the dust for the majority of micrometeoroid impacts on Mercury. The authors model the dynamics and evolution of these two populations, reproducing the distribution of directions from which micrometeoroids strike Mercury during its yearly orbit.

impact geometry

Schematic of Mercury in its orbit around the Sun. The dawn side leads the orbital motion, while the dusk side trails it.

Geometry of an Orbit

Mercury’s orbit is unique in our solar system: it circles the Sun twice for every three rotations on its own axis — so if you were on Mercury, you’d see a single day pass over the span of two years. As with all prograde planets, the edge leading the Mercury’s orbit marks the dawn terminator, while the edge trailing the planet’s orbital motion marks the dusk terminator.

Pokorný and collaborators find a significant asymmetry in the impact vaporization that occurs on Mercury’s dawn side versus its dusk side. This is due to impact geometry (since the dusk side is shielded from impacts in the direction of motion) and seasonal variation of the dust/meteoroid environment around the planet. The authors show that the source of impact vaporization shifts toward the nightside as Mercury approaches aphelion, and toward the dayside when the planet approaches the Sun.

Importance of Long-Period Comets

seasonal variations

Seasonal variations of the relative vaporization rate from the authors’ model (black line) compared to measurements of Mercury’s exospheric abundance of Ca. The contribution of long-period comets is shown by the blue line. [Pokorný et al. 2017]

The dawn/dusk asymmetry and the seasonal variations predicted by the model are all nicely consistent NASA’s MESSENGER spacecraft observations of the metal distribution in Mercury’s exosphere.

What makes Pokorný and collaborators’ model work so well? Their inclusion of the long-period, Halley-type comets is key: the high impact velocity of the micrometeoroids produced by this family play a significant role in shaping the impact vaporization rate of Mercury’s surface.

This work successfully demonstrates that we can use measurements of Mercury’s exosphere as a unique tool to constrain the dust population in the inner solar system.

Citation

Petr Pokorný et al 2017 ApJL 842 L17. doi:10.3847/2041-8213/aa775d

magnetar

The origin of the mysterious fast radio bursts has eluded us for more than a decade. With the help of a particularly cooperative burst, however, scientists may finally be homing in on the answer to this puzzle.

A Burst Repeats

FRB 121102 host

The host of FRB 121102 is placed in context in this Gemini image. [Gemini Observatory/AURA/NSF/NRC]

More than 20 fast radio bursts — rare and highly energetic millisecond-duration radio pulses — have been observed since the first was discovered in 2007. FRB 121102, however, is unique in its behavior: it’s the only one of these bursts to repeat. The many flashes observed from FRB 121102 allowed us for the first time to follow up on the burst and hunt for its location.

Earlier this year, this work led to the announcement that FRB 121102’s host galaxy has been identified: a dwarf galaxy located at a redshift of z = 0.193 (roughly 3 billion light-years away). Now a team of scientists led by Cees Bassa (ASTRON, the Netherlands Institute for Radio Astronomy) has performed additional follow-up to learn more about this host and what might be causing the mysterious flashes.

HST view of FRB 121102 host

Hubble observation of the host galaxy. The object at the bottom right is a reference star. The blue ellipse marks the extended diffuse emission of the galaxy, the red circle marks the centroid of the star-forming knot, and the white cross denotes the location of FRB 121102 ad the associated persistent radio source. [Adapted from Bassa et al. 2017]

Host Observations

Bassa and collaborators used the Hubble Space Telescope, the Spitzer Space Telecsope, and the Gemini North telecsope in Hawaii to obtain optical, near-infrared, and mid-infrared observations of FRB 121102’s host galaxy.

The authors determined that the galaxy is a dim, irregular, low-metallicity dwarf galaxy. It’s resolved, revealing a bright star-forming region roughly 4,000 light-years across in the galaxy’s outskirts. Intriguingly, the persistent radio source associated with FRB 121102 falls directly within that star-forming knot.

Bassa and collaborators also found that the properties of the host galaxy are consistent with those of a type of galaxy known as extreme emission line galaxies. This provides a tantalizing clue, as these galaxies are known to host both hydrogen-poor superluminous supernovae and long-duration gamma-ray bursts.

Linking to the Cause

What can this tell us about the cause of FRB 121102? The fact that this burst repeats already eliminates cataclysmic events as the origin. But the projected location of FRB 121102 within a star-forming region — especially in a host galaxy that’s similar to those typically hosting superluminous supernovae and long gamma-ray bursts — strongly suggests there’s a relation between these events.

gamma-ray burst

Artist’s impression of a gamma-ray burst in a star-forming region. [NASA/Swift/Mary Pat Hrybyk-Keith and John Jones]

The authors propose that this observed coincidence, supported by models of magnetized neutron star birth, indicate an evolutionary link between fast radio bursts and neutron stars. In this picture, neutron stars or magnetars are born as long gamma-ray bursts or hydrogen-poor supernovae, and then evolve into fast-radio-burst-emitting sources.

This picture may finally explain the cause of fast radio bursts — but Bassa and collaborators caution that it’s also possible that this model applies only to FRB 121102. Since FRB 121102 is unique in being the only burst discovered to repeat, its cause may also be unique. The authors suggest that targeted searches of star-forming regions in galaxies similar to FRB 121102’s host may reveal other repeating burst candidates, helping us to unravel the ongoing mystery of fast radio bursts.

Citation

C. G. Bassa et al 2017 ApJL 843 L8. doi:10.3847/2041-8213/aa7a0c

galactic center minispiral

continuum minispiral

An image of the continuum emission from the galactic center minispiral, previously taken by ALMA at 100 GHz. This image labels the structures of the minispiral: a bar and multiple arcing arms, and the black hole Sgr A* near the center. [Tsuboi et al. 2017]

The region around Sgr A*, the 4-million-solar-mass black hole at the heart of our galaxy, is a complex and dynamic place. New Atacama Large Millimeter/submillimeter Array (ALMA) observations of the Milky Way’s center now reveal more about this harsh, inhospitable environment.

A New View

One of the prominent structures at the heart of the Milky Way is a bundle of ionized gas streams located surrounding Sgr A* within the close distance of 6.5 light-years. These streams take the form of a bar and a series of arms that make it look much like a tiny spiral galaxy — earning it the name of “the galactic center minispiral.”

Where did this gas come from? What’s happening to it now? And what can it tell us about the environment about Sgr A*? A team of scientists led by Masato Tsuboi (Japan Aerospace Exploration Agency) has now obtained new ALMA images of the minispiral that are helping us to answer these questions.

electron temperatures and densities

Electron temperature in K (numbers in yellow) and density in cm-3 (numbers in red) from the new ALMA observations of the ionized gas streamers. [Tsuboi et al. 2017]

Clues from Gas

Tsuboi and collaborators imaged the gas within the galactic center minispiral and its surroundings as part of the first ALMA observation cycle. This powerful telescope’s images allowed the team to observe the streamers of ionized gas within the arms of the minispiral and determine their velocities. The authors were then able to use these measurements to identify which gas components are related and the speeds and directions of motion for the different components.

Besides tracking the dynamics of the ionized gas in the minispiral, the team also confirmed that the electron temperatures and densities in the streamers increase with proximity to Sgr A*. We would expect these increases to cause the arms to expand laterally closer to the black hole — but that’s not what’s observed. Instead, the arms remain closely confined.

This discrepancy tells us something about the environment around the minispiral: there must be surrounding, ambient ionized gas that’s pushing on the streamers, providing the external pressure to keep them confined.

An Explanation for Proplyds

proplyds in minispiral

The ALMA observations of ionized gas (top panel) line up nicely with the JVLA detections of candidate proplyds near Sgr A* (bottom panel, with the ionized gas emission from the top panel shown as contours). [Tsuboi et al. 2017]

Lastly, Tsuboi and collaborators compare their ALMA observations of the ionized gas in the minispiral with previous observations of the galactic center made with the Jansky Very Large Array. The JVLA observations revealed the presence of compact half-shell-like structures that may be “proplyds” — protostars being photoevaporated by the hot radiation coming from the central star cluster around Sgr A*.

These candidate proplyds have posed an astronomical puzzle: between Sgr A*’s strong tidal forces and the radiation being emitted from the central star cluster, conditions are extremely inhospitable to star formation. So how did these proplyds get there?

Tsuboi and collaborators’ observations may shed some light on this. Lining up the new ALMA images with the old JVLA ones, it’s clear that the proplyds are all concentrated along the ionized gas streamer of the northeastern arm in the minispiral. This suggests that the protostars may have formed further away from Sgr A*, and they were brought to their present-day location as the streamer fell inwards toward the black hole.

Citation

Masato Tsuboi et al 2017 ApJ 842 94. doi:10.3847/1538-4357/aa74e3

cloudy exoplanet

Direct imaging of exoplanets was once only possible for the brightest of planets orbiting the dimmest of stars — but improving technology is turning this into an increasingly powerful technique. In a new study, direct-imaging observations of the Jupiter-like exoplanet 51 Eridani b provide tantalizing clues about its atmosphere.

Direct Imaging of 51 Eri b

51 Eri b

Images of 51 Eri b from GPI (top) and Keck (bottom). [Rajan et al. 2017]

While transit detections remain the best way to discover large quantities of new exoplanets, direct imaging provides a unique advantage: you can measure the light from the exoplanet itself. With proper constraints on the host star, it therefore becomes possible to measure the spectrum of the planet’s atmosphere.

One target for this technique is 51 Eri b, a Jupiter-like exoplanet located roughly 100 light-years away. This object was the first exoplanet directly imaged by the Gemini Planet Imager Exoplanet Survey, a project that used the Gemini Planet Imager (GPI) instrument in Chile to search for exoplanets around 600 young nearby stars.

A team of scientists led by Abhijith Rajan (Arizona State University) has now made new near-infrared observations of 51 Eri b: spectroscopy in the K band using GPI, and photometry in the Ms band with a camera on the Keck I telescope in Hawaii. Rajan and collaborators combined this new data with past observations and modeling to better characterize the 51 Eri b’s properties.

51 Eri b color

Color–magnitude diagrams for brown dwarfs and imaged exoplanets (click for a closer look). The color of 51 Eri b (marked with red star) places it among late T dwarfs, but it is redder than most comparable-temperature brown dwarfs. The tracks for the L–T transition for two different planet masses are shown. [Rajan et al. 2017]

Cloudy Transition

One intriguing aspect of 51 Eri b is the challenge of determining its spectral type. Though its spectrum is consistent with that of a T dwarf, photometry shows that it’s unusually red for this spectral type. There may be a reason for this, however: clouds.

Rajan and collaborators find that the best fitting models for 51 Eri b’s spectra all have an atmosphere consisting of patchy clouds. This result holds true both for models with the salt and sulfide clouds expected to condense in the atmospheres of mid-to-late T dwarfs, and for models with the iron and silicate clouds common in atmospheres of redder L-dwarfs.

The authors hypothesize that 51 Eri b may be in the process of transitioning from a warmer L-type body to a cooler T-type body. As an L-type planet cools, holes and low-opacity patches appearing in an initially uniform cloud deck could cause the transition of the planet’s spectrum to T-type.

An Unusual Start?

prospects with JWST

The ten best-fitting cloudy (red) and cloudless (blue) atmospheres over the wavelength range of JWST, illustrating that JWST will likely be able to differentiate between atmospheric models for 51 Eri b. [Rajan et al. 2017]

In addition to examining 51 Eri b’s atmosphere, Rajan and collaborators use its luminosity to explore how it may have formed. They demonstrate that 51 Eri b is one of the only directly imaged planets that’s consistent with what’s known as the cold-start scenario, in which planets slowly grow via accretion onto a solid core.

While much remains to be learned about 51 Eri b, these new results provide an excellent step in the right direction. The authors also show that future observations — such as with the James Webb Telescope — will allow us to further differentiate between models describing this planet. 51 Eri b’s intriguing atmosphere makes it a prime target to revisit as our observational capabilities continue to improve.

Citation

Abhijith Rajan et al 2017 AJ 154 10. doi:10.3847/1538-3881/aa74db

1 85 86 87 88 89 111