
Catching Radio Signals from Colliding Objects
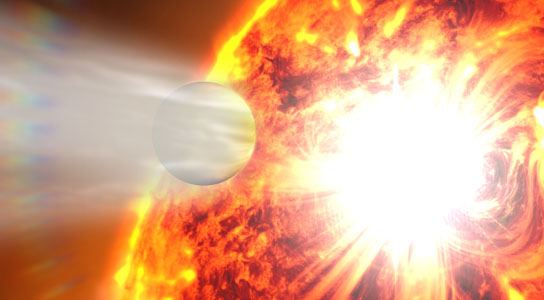
The merger of two compact objects — neutron stars or black holes — could be accompanied by a sudden, immediate flash of radio emission, according to predictions. Can an array of antennas in California help us spot these signals?
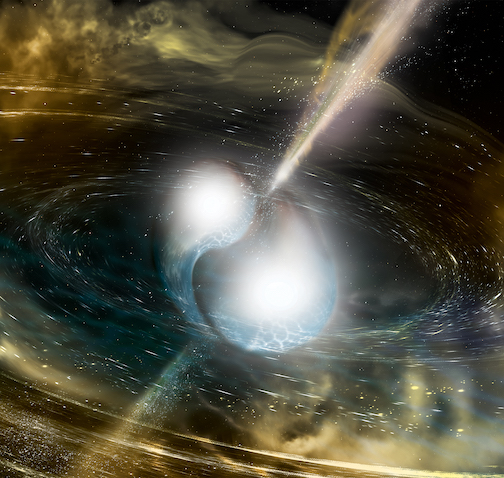
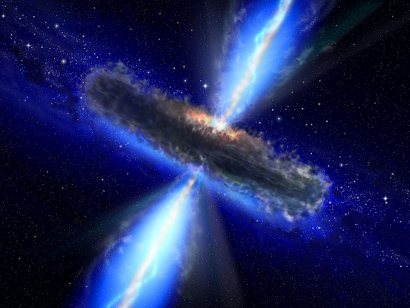
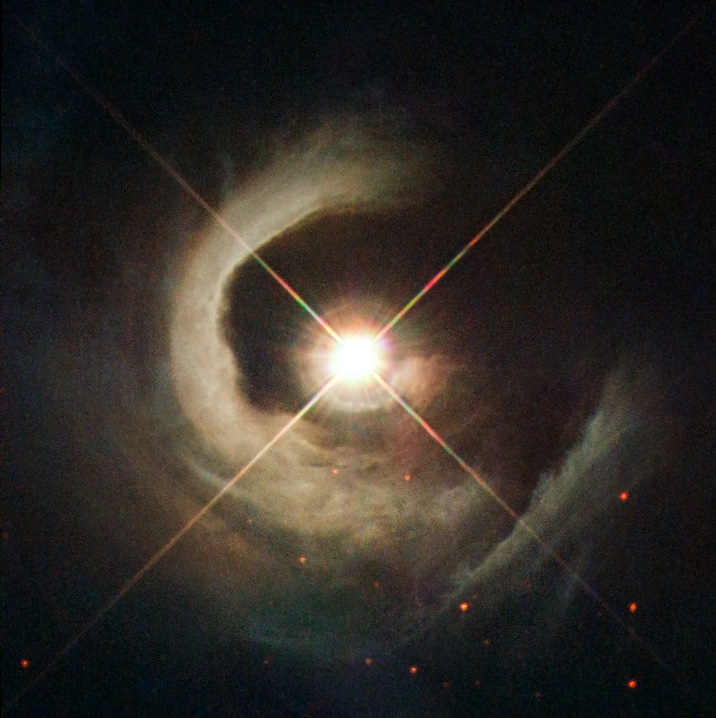
Artist’s impression of two merging neutron stars producing a gamma-ray burst. [National Science Foundation/LIGO/Sonoma State University/A. Simonnet]
Missing Signal
In recent years, the Laser Interferometer Gravitational-Wave Observatory (LIGO) has opened up a new world with the first detections of gravitational waves from compact-object mergers. In 2017, LIGO announced the detection of a pair of neutron stars colliding — GW170817 — and astronomers around the world rushed to watch the fireworks emitted across the electromagnetic spectrum.
In the time that followed, we saw gamma rays from a short-duration burst emitted during the merger itself; an optical/near-infrared kilonova, powered by the radioactive decay of heavy elements formed in the merger; and a long-lived radio, X-ray, and optical afterglow, caused when ejecta from the merger slammed into the surrounding environment and decelerated. One signal was missing, however: prompt radio emission.
A Prompt Challenge
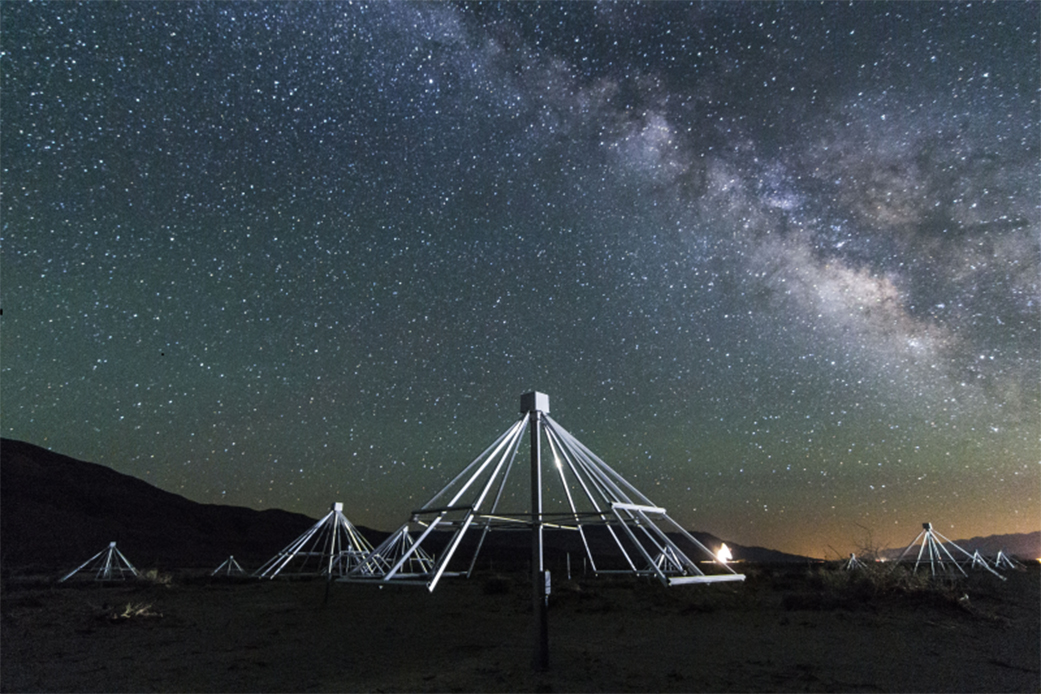
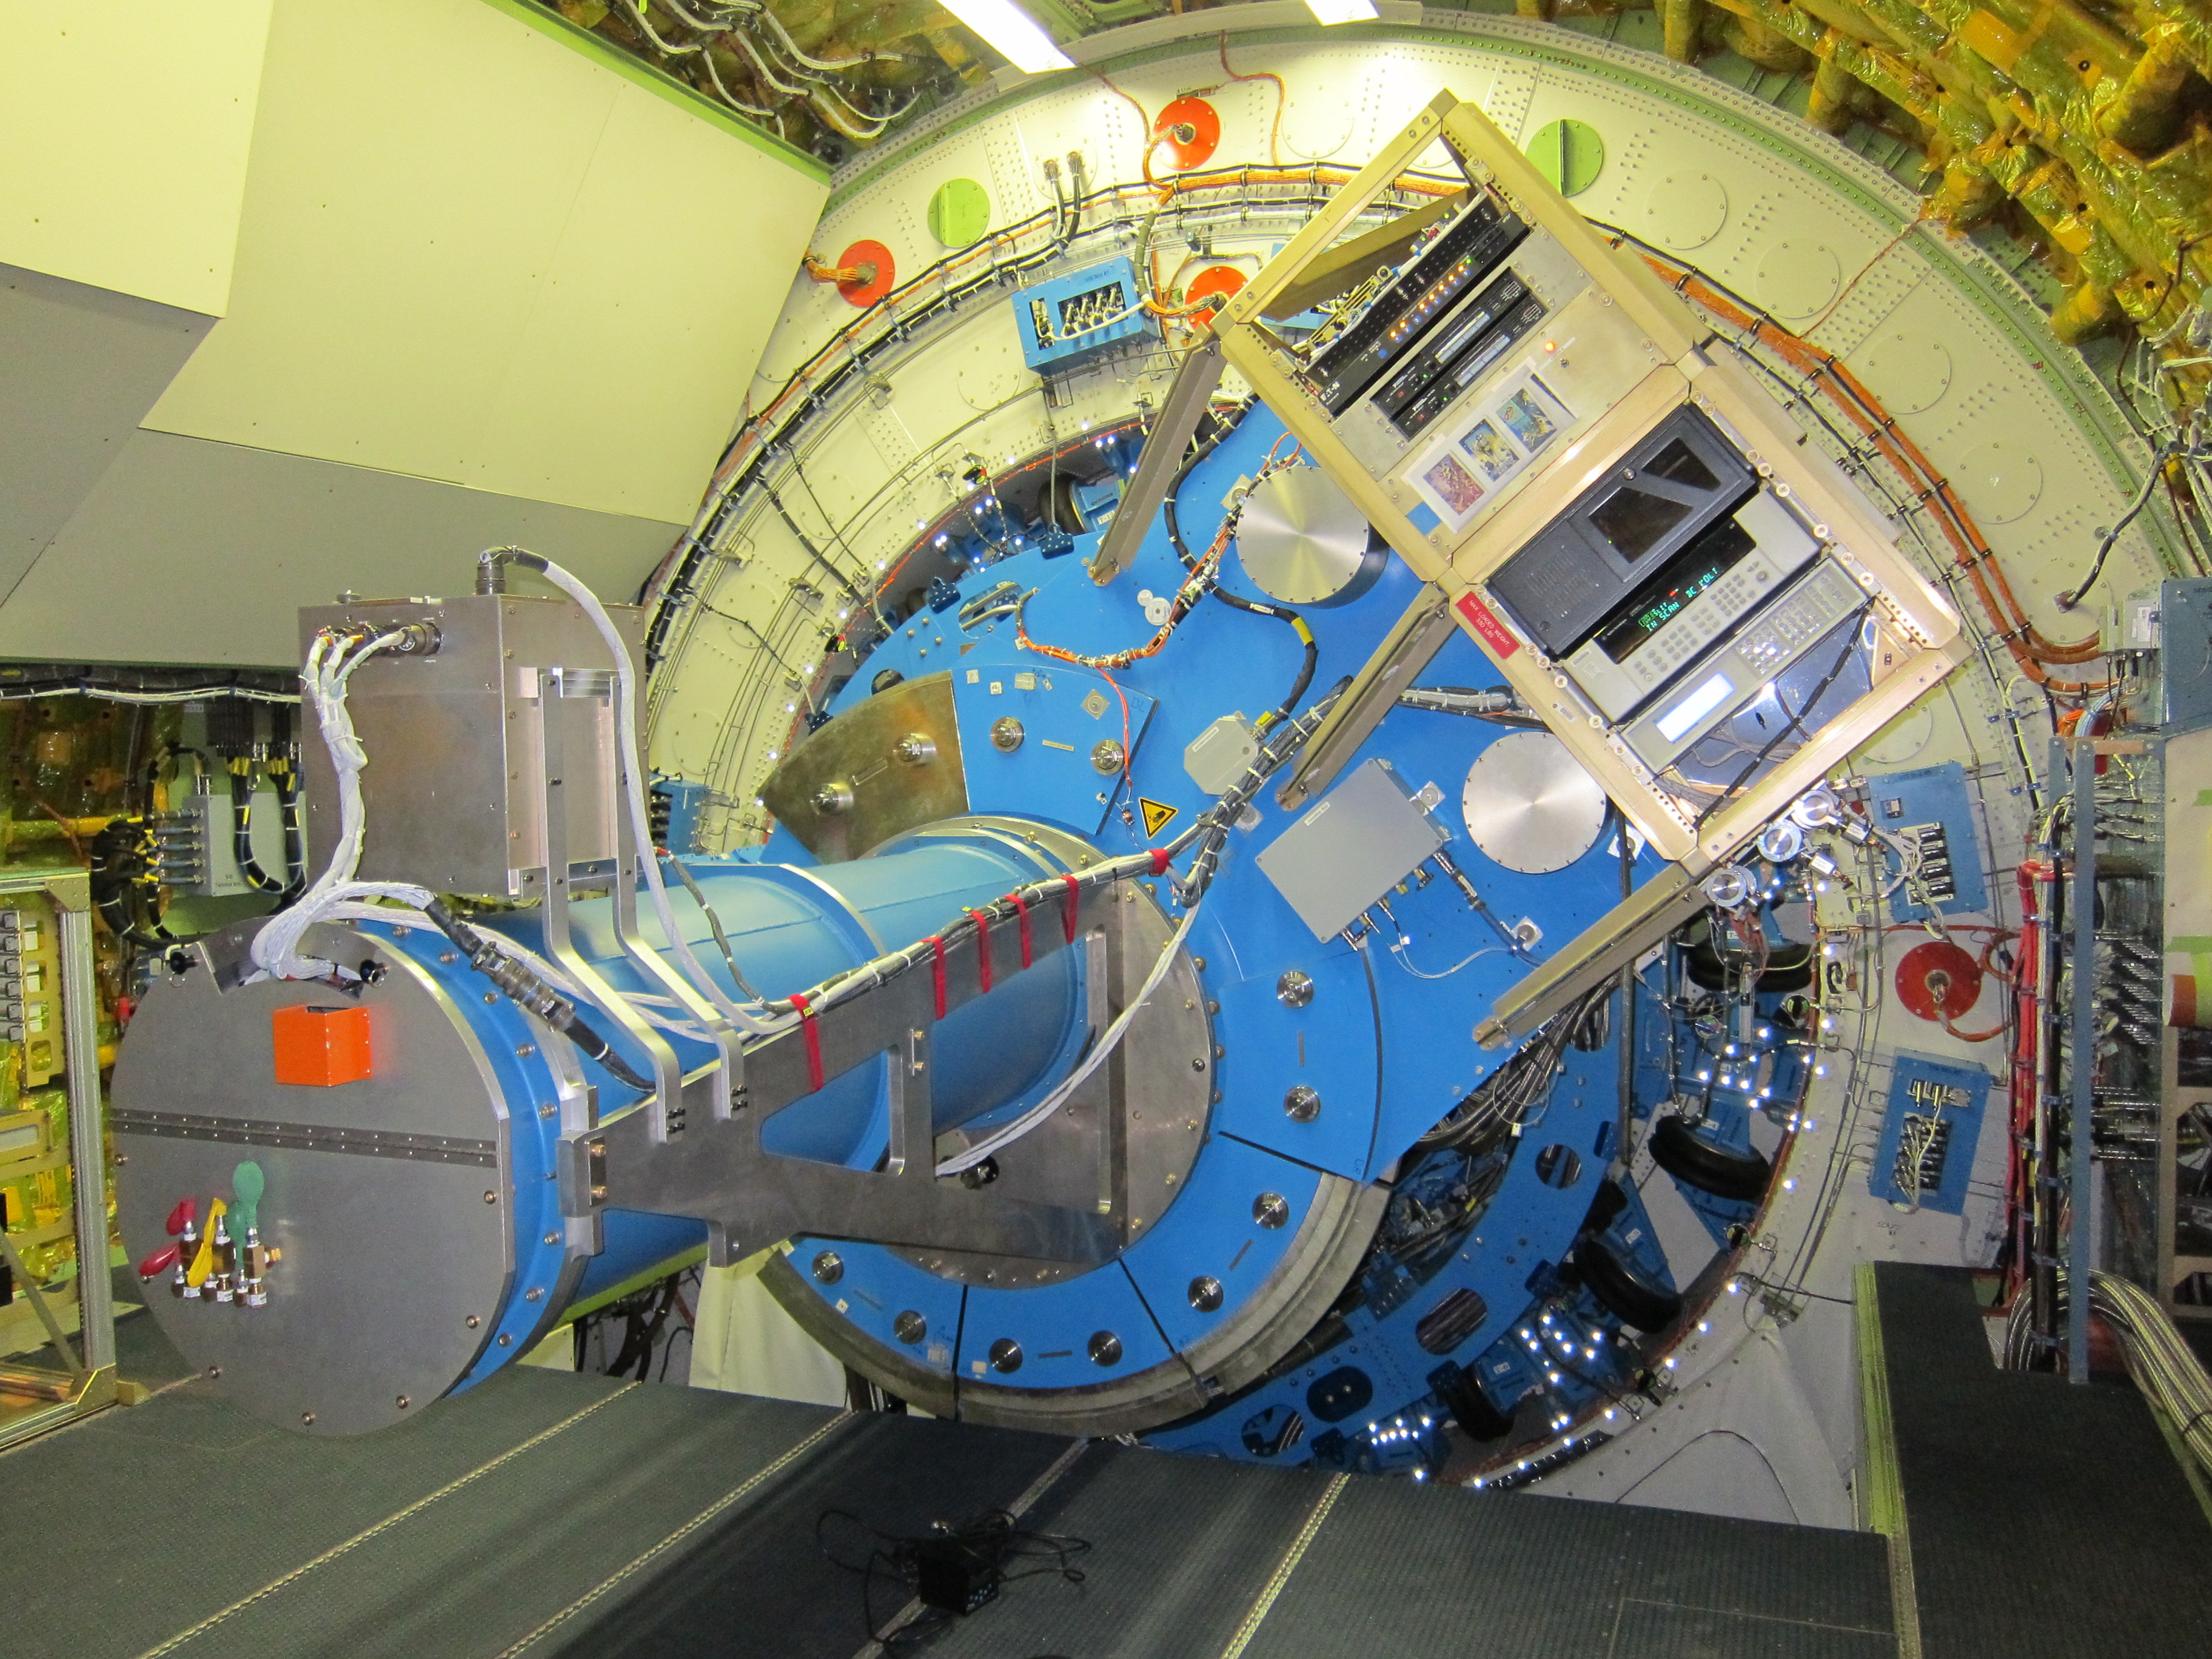
A nighttime photo of some of the antennas in the Owens Valley Radio Observatory Long Wavelength Array. [Gregg Hallinan]
Catching this signal could provide us with information about the magnetic environment immediately around the binary, the properties of the intergalactic medium, and more. But it’s a tricky prospect — there’s very little lead time between the gravitational-wave detection and the radio signal, and the gravitational-wave source is poorly localized. How can we know where to point, quickly enough to capture the prompt radio emission from a merger?
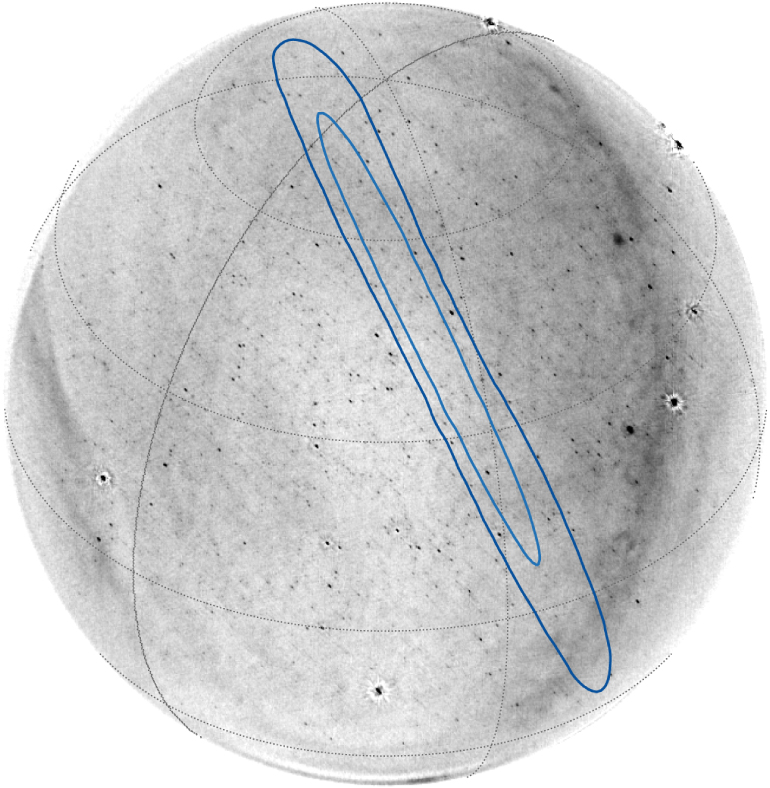
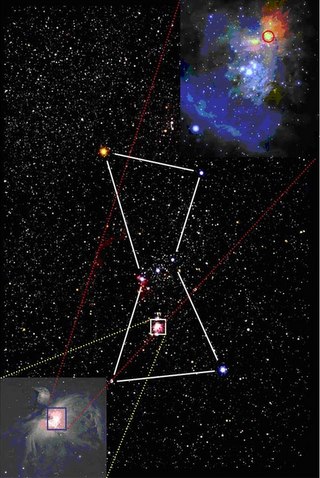
The localization of GW170104 is shown in blue, plotted over the OVRA-LWA’s field of view at the time. The gray area was outside of the array’s field of view. [Callister et al. 2019]
Radio Eyes on the Sky
One approach: all-sky radio monitoring, like that provided by the Owens Valley Radio Observatory Long Wavelength Array (OVRO-LWA). This array of 288 antennas in California continuously scans the sky overhead, taking 13-s integrations that it stores for 24 hours.
This broad coverage and data storage means that even if the alert for a gravitational-wave detection comes hours later, scientists still have access to relevant OVRO-LWA data. We just have to get lucky to have the source in the field of view of the antennas — something that didn’t work out for GW170817, but likely will eventually!
A Successful Nondetection
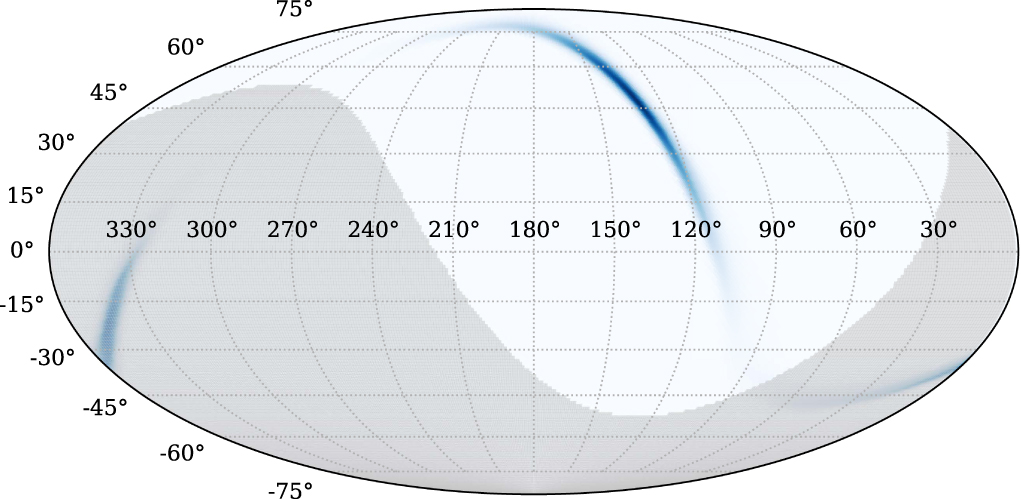
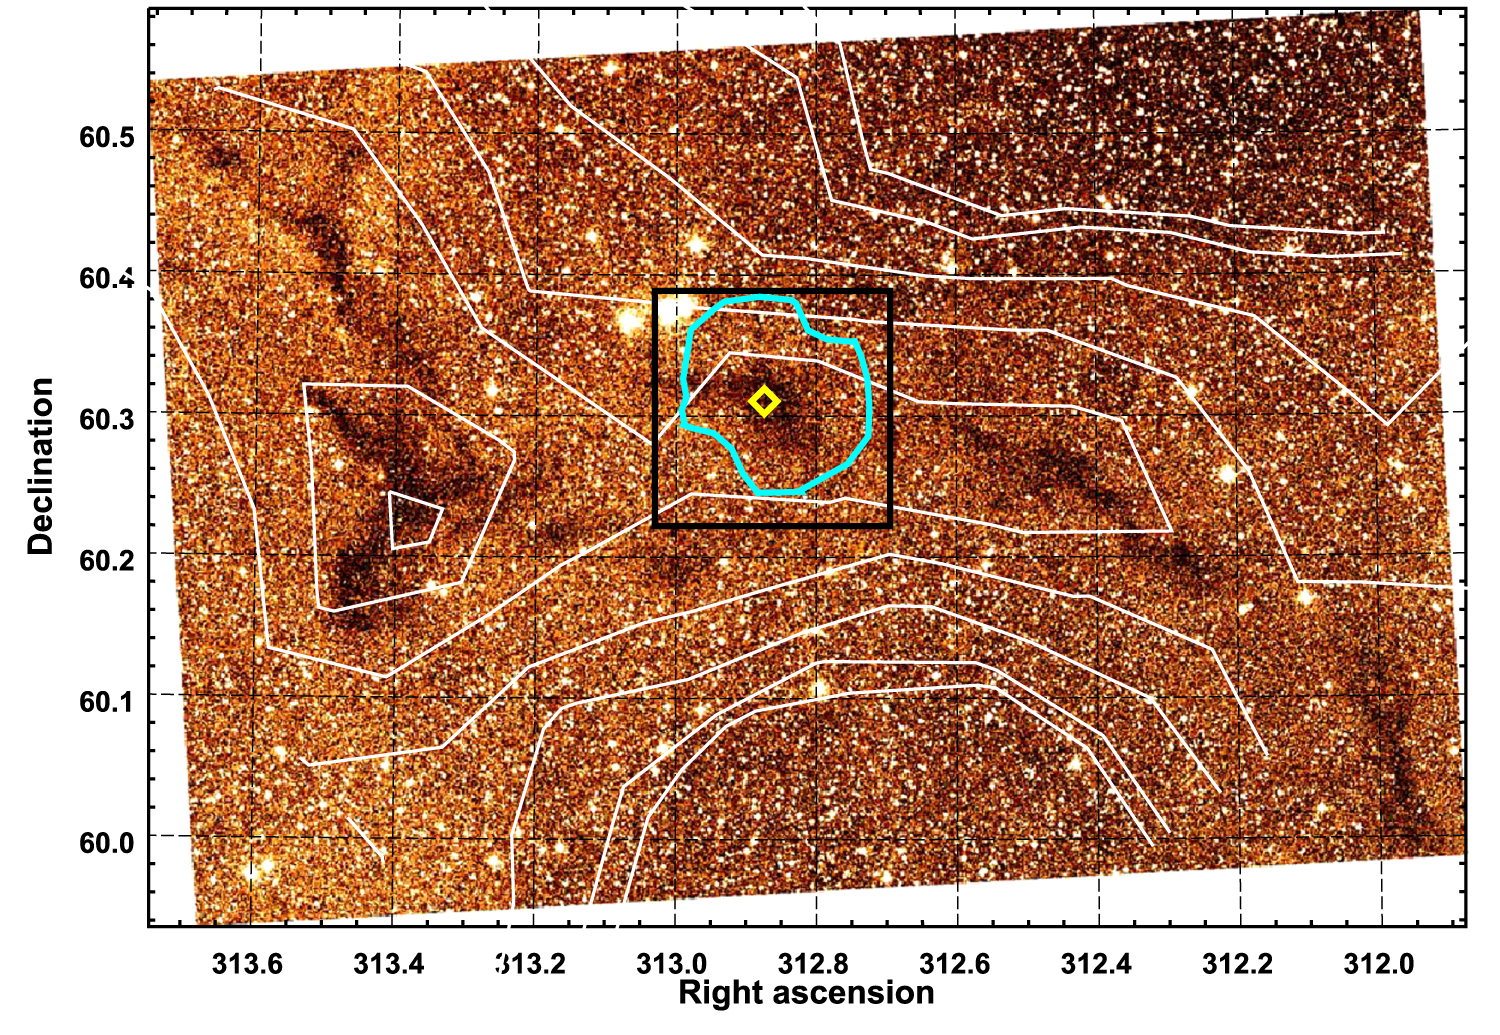
The OVRO-LWA view of the radio sky (from 27 to 84 MHz) at the time of GW170104. The contours show the localization of the gravitational-wave source. [Callister et al. 2019]
Callister and collaborators didn’t spot a signal — but this was expected, since GW170104 was a binary black-hole merger, making it unlikely to produce electromagnetic radiation. The team did find, however, that they were able to place useful constraints on the amount of radio emission the merger could have produced, demonstrating the power of the OVRO-LWA for future observations.
The OVRO-LWA is clearly up to the task of detecting prompt emission from upcoming neutron-star mergers. Now we’ll just have to wait and see if it spots something in the third LIGO observing run, currently underway!
Citation
“A First Search for Prompt Radio Emission from a Gravitational-wave Event,” Thomas A. Callister et al 2019 ApJL 877 L39. doi:10.3847/2041-8213/ab2248


