Features RSS

black hole binary

Do black holes have a preferred size? New research has explored the populations of black holes involved in catastrophic, gravitational-wave-emitting collisions — and an interesting pattern has emerged.

A Question of Mass

The population of so-called stellar-mass black holes in the universe pose an interesting puzzle: What size are they, typically, and why?

Plot showing masses of observed black hole and neutron star binary mergers. Plot includes black holes detected through electromagnetic observations (purple), black holes measured by gravitational-wave observations (blue), neutron stars measured with electromagnetic observations (yellow), and neutron stars detected through gravitational waves (orange).

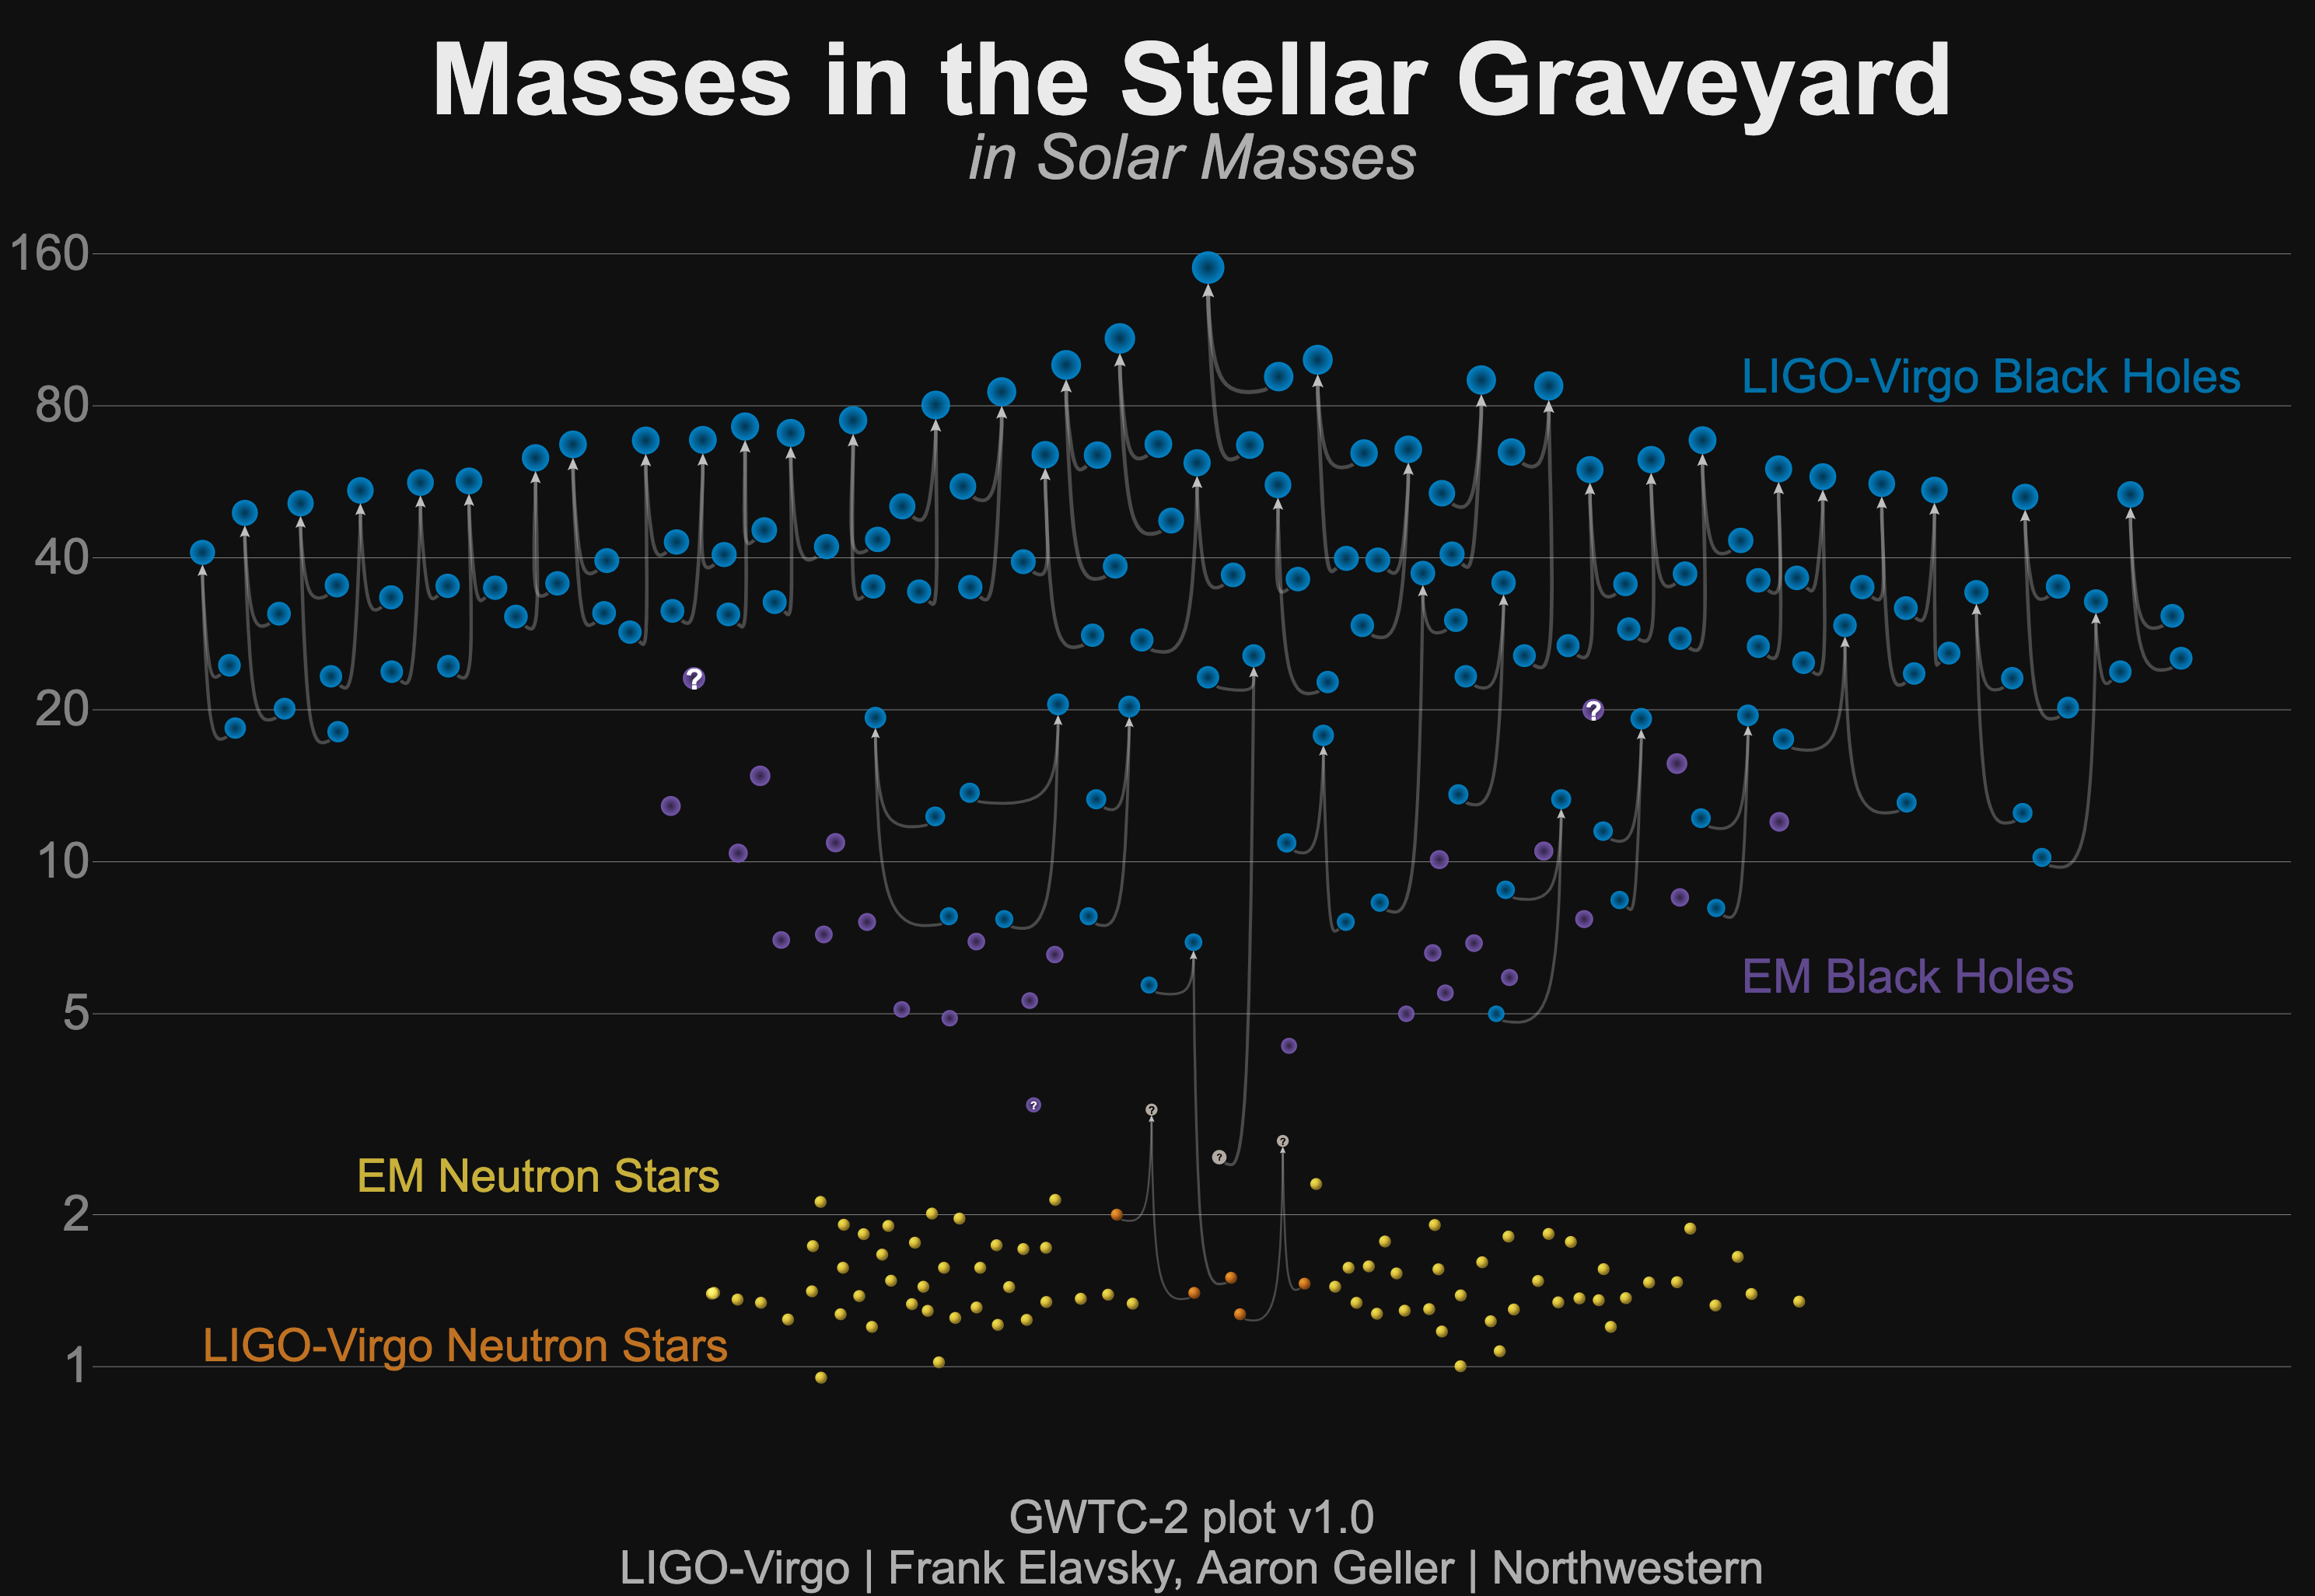
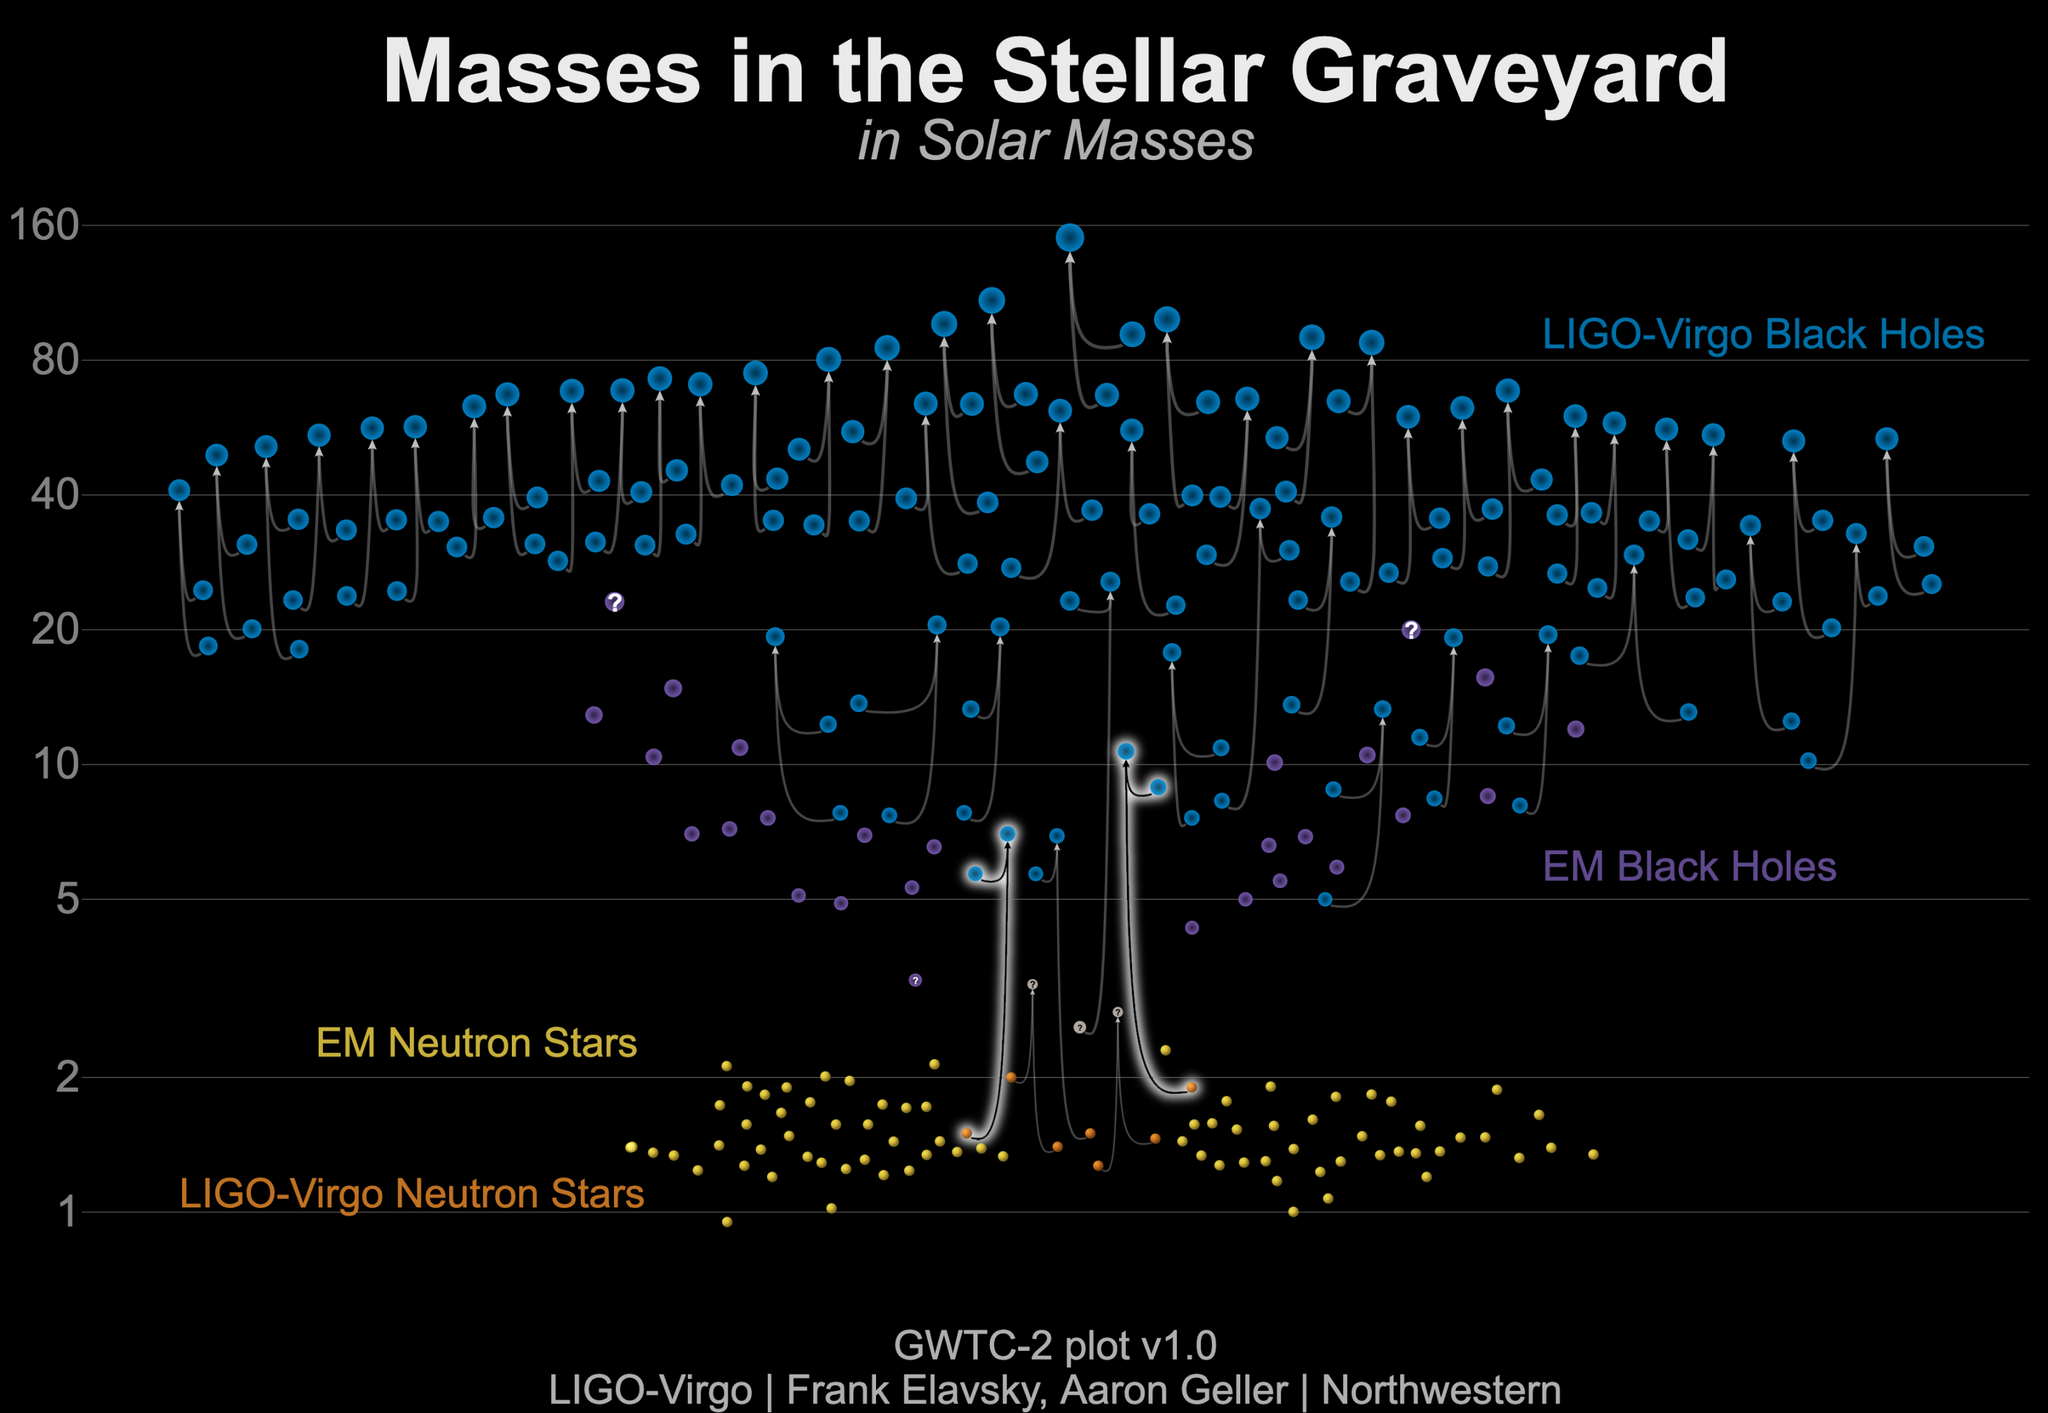
The “stellar graveyard”, a plot that shows the masses of the different components of observed black hole binary mergers included in GWTC–2 (blue). Also shown are the black hole masses we’d previously measured using electromagnetic observations (purple). Click to enlarge. [LIGO-Virgo/Northwestern U./Frank Elavsky & Aaron Geller]

Before 2015, we had measured the masses of a small number of stellar-mass black holes using electromagnetic observations. These black holes reliably weighed in at somewhere between ~5 and ~20 solar masses, providing us — or so we thought — with a fairly consistent picture of these mysterious bodies.

That picture, however, was shattered by LIGO/Virgo’s first detection of gravitational waves from a merging pair of black holes. The signal originated from a pair of black holes of ~30 and ~35 solar masses — both substantially heavier than stellar-mass black holes we’d previously observed. Since then, additional merging black holes spotted by LIGO/Virgo have continued to weigh in above 20 solar masses. Some even weigh more than 80 or 90 times the Sun!

Now that we’ve gathered a number of observations, we can start to ask what the mass distribution looks like for the underlying population of merging stellar-mass black holes. A new study by scientists Vaibhav Tiwari and Stephen Fairhurst (Cardiff University, UK) dives into the LIGO/Virgo detection catalog looking for answers.

Building a Distribution

Tiwari and Fairhurst use GWTC–2, the second LIGO/Virgo catalog of gravitational-wave detections, to analyze a population of 39 strong signals of binary black hole mergers. The authors use a statistical model to then reconstruct the underlying population of merging black holes from these data, and they explore the distributions of spins and masses for this population.

plot of the component mass distribution shows a decaying power law with 4 additional peaks marked, spaced a factor of ~2 apart

The distribution of underlying component masses for the merging black hole population shows four peaks spaced a factor of ~2 apart, rather than just a decaying power law. Click to enlarge. [Tiwari & Fairhurst 2021]

The simplest outcome would be for the black hole masses to track a decaying power law: because black holes evolve from massive stars, and smaller stars are more numerous than larger ones, we’d expect a smoothly decreasing distribution of black hole masses.

Instead, Tiwari and Fairhurst detect structure in the distribution on top of the decaying power law: a set of four peaks that fall at component masses of 9, 16, 30, and 57 solar masses. 

Clues Point to More Collisions

What’s going on? The authors show that this might be a clue as to how these black holes formed.

In a hierarchical merger scenario, where black holes are built up through successive collisions of smaller black holes, we’d expect to see a mass pile-up at the location of the first peak in the mass distribution, followed by subsequent peaks spaced roughly a factor of 2 apart.

Invisible black holes warp the space time around them in the center of a busy, dense cluster of stars.

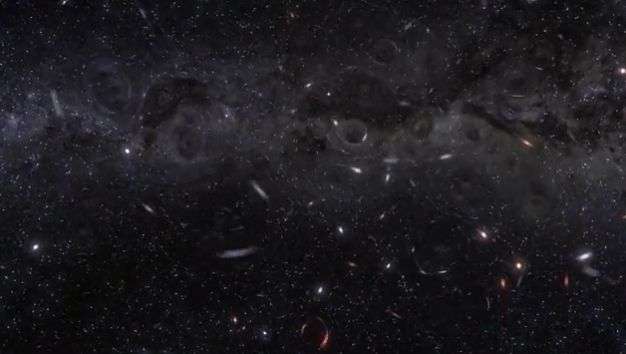
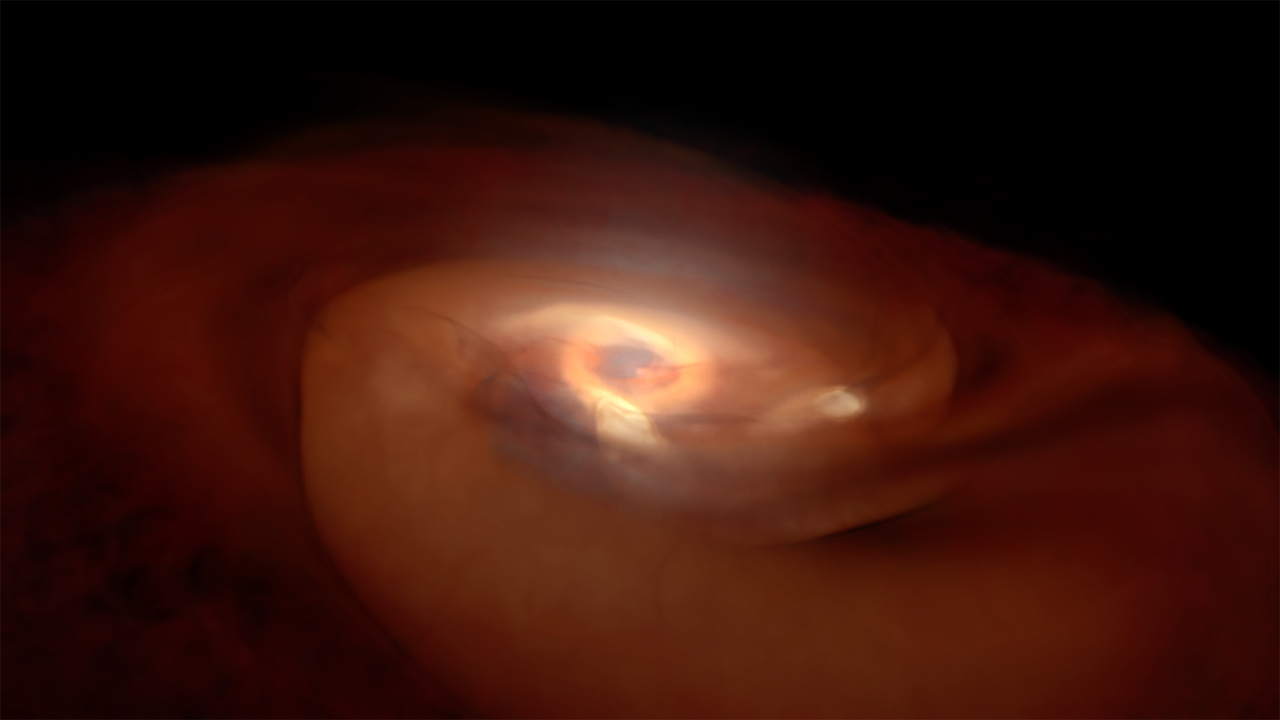
Visualization of black holes colliding at the center of a dense stellar cluster. [Carl Rodriguez/Northwestern Visualization (Justin Muir, Matt McCrory, Michael Lannum)]

Perhaps, then, the authors’ detection of a structured distribution hints that many of the merging stellar-mass black holes in our universe didn’t evolve in isolation, but instead formed through successive collisions in dense stellar environments.

Tiwari and Fairhurst caution that their results are currently based off of a very small number of data points, and we’ll need to wait until we’ve amassed more detections to make any robust claims. But if future observations confirm these trends, this could provide valuable insight into stellar-mass black holes in the universe. 

Citation

“The Emergence of Structure in the Binary Black Hole Mass Distribution,” Vaibhav Tiwari and Stephen Fairhurst 2021 ApJL 913 L19. doi:10.3847/2041-8213/abfbe7

Illustration of a planet orbiting a star in an ellipse that traces above the poles of the star rather than in the equatorial plane.

In some planetary systems, the direction that a star spins and the direction its planets orbit don’t always line up. A new study explores what we can learn from these nonconformists.

Nature Is Trending

Much of science involves searching for patterns and trends in data. Patterns in the universe — preferences for certain shapes, locations, alignments, etc. — can often reveal hidden underlying physics that drives nature to take a non-random course. This means that patterns and trends frequently provide the key to understanding how the universe works.

illustration of dust and gas swirling around a bright, newly forming star.

A protostar lies embedded in a disk of gas and dust in this visualization. Since stars and their planets form from the same cloud, it would make sense for their rotations to be aligned. [NASA’s Goddard SFC]

Exoplanet populations are an especially intriguing place to look for trends. In recent years, our sample of observed exoplanets has grown large enough that we can now start to do useful statistical analysis — and there’s a lot we can hope to learn from this about the formation and evolution of planetary systems.

One particular curiosity among exoplanets: a planet’s orbital direction is not always aligned with its host star’s spin direction. Since a star and its planets all form out of the same rotating cloud of gas and dust, conservation of angular momentum should produce planet orbits and stellar spins that are aligned. But, while we see a large population of well-aligned systems, we also see a smaller population of misaligned systems.

diagram labeling various angles on a sphere relative to the line of sight.

Diagram illustrating the angle between the sky-projected stellar spin and planetary orbit (λ) and the actual 3D angle between the spin and orbit (Ψ). The tilt of the star relative to the observer line of sight is marked by i. [Albrecht et al. 2021]

What causes planets to become misaligned with their stars? A new study led by Simon Albrecht (Aarhus University, Denmark) examines patterns in a population of observed star–planet systems to find out.

A Polar Population

Albrecht and collaborators explored a valuable sample of 57 star–planet systems. For the majority of planetary systems with observed spin/orbital directions, we can only measure the angle between the sky-projected orbital and spin axes. But for the sample that Albrecht and collaborators used, we have independent measurements of the inclination angle of the star relative to our line of sight. Thus, for these 57 systems, the authors were able to identify the actual angle in 3D space between the planets’ orbital axes and the stars’ spin axes.

Two plots showing the two measured angles for the population of 57 planetary systems.

Left: The angle between the sky-projected orbital and spin axes (λ) for the authors’ sample. Right: The actual angle between the axes (Ψ). The actual angles show two clusterings: one near zero (aligned), and one around 90° (perpendicular). Click to enlarge. [Adapted from Albrecht et al. 2021]

The result? Albrecht and collaborators find that the majority of the systems are aligned, as expected. But the 19 misaligned systems do not have misalignments that are distributed randomly through all angles. Instead, almost all of the misalignments cluster around 90° (ranging from 80°–125°) — meaning that the planet orbits the poles of the star, perpendicular to the direction that the star spins.

What could cause this polar pileup? The authors propose several theoretical possibilities that include dynamical interactions between the planet and the star, or between the planet and an additional unseen, distant companion body. But, as we’ve seen, nature has a mind of its own — and there may be multiple mechanisms at work! We don’t yet have enough information to solve this puzzle with certainty, but a continued search for patterns is sure to point us in the right direction eventually.

Citation

“A Preponderance of Perpendicular Planets,” Simon H. Albrecht et al 2021 ApJL 916 L1. doi:10.3847/2041-8213/ac0f03

Illustration of a pulsar and disrupted star in a binary

What’s going on at the largest filled-aperture radio telescope in the world? The Five-hundred-meter Aperture Spherical radio Telescope (FAST) has discovered a new assortment of highly magnetized, pulsating neutron stars located beyond the main disk of the Milky Way.

Globular Cluster Treasure Troves

diagram showing a pulsar with magnetic field lines and beams of emission from its poles.

Diagram of a pulsar, a rotating neutron star with a strong magnetic field. [NASA/Goddard Space Flight Center Conceptual Image Lab]

Pulsars are the compact remnants of evolved stars that spin rapidly, shining a beam of emission across the Earth like a lighthouse with an incredibly precise period. We can use these cosmic clocks to explore the galaxy around us, leveraging their precise timings to learn more about stellar evolution, their environments, the interstellar medium, and more.

But pulsars also exist beyond the relatively nearby disk of the Milky Way! A particularly interesting place to search for them is inside the globular clusters — compact, old clusters of stars that are bound together in spheres — that orbit our galaxy.

Pulsars in globular clusters are often quite exotic. The ones we’ve detected in globular clusters include some of the fastest spinners, eclipsing binaries, triple systems, and pulsars in eccentric orbits with their companions. By identifying more objects in this array of interesting systems, we can learn about the range of outcomes produced by stellar evolution in old star clusters.

FAST radio telescope

The 500-m FAST radio dish, built into a natural basin in southwest China. [Xinhua/Ou Dongqu]

The challenge? These globular cluster pulsars are far away and often faint. We need large and sensitive radio surveys to hunt for these mysterious bodies — and this is where FAST comes in.

A Giant Telescope on the Hunt

FAST, an enormous radio telescope built into the landscape in southwest China, launched its globular cluster pulsar survey in 2018. Since then, this telescope has been searching for signs of faint, pulsating neutron stars within the Milky Way globular clusters that lie in the FAST sky.

In a new study led by Zhichen Pan (NAO, Chinese Academy of Sciences), a team of scientists reports the most recent results of this survey, which include:

Plots showing pulse profiles for 12 new pulsars

Pulse profiles for some of the newly discovered pulsars. Click to enlarge. [Pan et al. 2021]

  • the discovery of 24 new pulsars in 15 globular clusters, roughly doubling the number of globular cluster pulsars known in the FAST sky
  • the first-ever detections of pulsars in globular clusters M2, M10, and M14
  • the discovery of several new black widow and redback pulsars — binary systems in which a very low-mass star orbits close to a millisecond pulsar, as the pulsar gradually consumes its companion
  • additional measurements of previously discovered pulsars

The new discoveries from these globular clusters are primarily pulsars in binaries — possibly due to a low rate of encounters in these clusters, which would allow binaries to survive for longer.

The results presented by Pan and collaborators demonstrate that FAST’s high sensitivity exceeds that of previous surveys and shows great promise for the future. We can expect our sample of globular cluster pulsars to keep growing as FAST continues its hunt alongside other telescopes. Stay tuned!

Citation

“FAST Globular Cluster Pulsar Survey: Twenty-four Pulsars Discovered in 15 Globular Clusters,” Zhichen Pan et al 2021 ApJL 915 L28. doi:10.3847/2041-8213/ac0bbd

Gravitational-wave events have allowed us to measure distances in space in a way that’s independent of previous techniques. By extension, we can also make independent measurements of the universe’s rate of expansion, expressed as the Hubble constant. Current measurements of the Hubble constant from gravitational-wave events still rely on electromagnetic information, but with new observatories on the horizon, it may be possible to make measurements of the Hubble constant with just a single gravitational-wave event.

Images of the galaxy NGC 4993 showing the electromagnetic counterpart to the gravitational wave-event GW170817. The image was taken by the Dark Energy Camera (DECam) on Blanco 4-meter telescope at the Cerro Tololo Inter-American Observatory. [Adapted from M. Soares-Santos et al. 2017]

Ways to Use Gravitational-Wave Events

The gravitational-wave event GW170817 was the first observation of a binary neutron star merger. With concurrent electromagnetic observations, we were able to use information from GW170817 to make an independent measurement of the Hubble constant. This measurement coupled the distance to the event host galaxy (as determined from the gravitational-wave event) with the redshift of the host galaxy, which is derived from electromagnetic information.

While the uncertainty on this measurement of the Hubble constant is relatively large, higher precision measurements will be possible in the near future with more advanced observatories. However, our interpretation of the gravitational-wave signal in this case is very dependent on the inclination of the merging system and the distance to the merger host galaxy as measured by electromagnetic observations — and we’re currently unable to separate the influence of these two quantities.

But what if we could disentangle these influences with a single gravitational-wave event? A recent study led by Juan Calderón Bustillo (Universidade de Santiago de Compostela, Spain) explores how we could use future observations of neutron star mergers like GW170817 to make higher precision measurements of the Hubble constant.

The spectrum of gravitational-wave signals from face-on and edge-on merging systems, with certain signal components highlighted. The black line shows the sensitivity of the planned Neutron star Extreme Matter Observatory (NEMO). [Adapted from Bustillo et al. 2021]

Picking Up Subtle Signals

Like most signals, a gravitational-wave signal can be broken down into multiple simpler signals. In the case of a neutron star merger, the components of a gravitational-wave signal are dependent on properties of the merging system, such as stellar mass and the orientation of the system relative to the observer.

With current observatories, we don’t have the ability to pick up the subtler component signals in a gravitational wave, including those that appear after the merger. But if we did — and we eventually will — Bustillo and collaborators show that we could use those subtle signals to disentangle the influences of system inclination and host galaxy distance. Then, we would also be able to make more precise measurements of the Hubble constant. Most notably, being able to pick up these subtler signals would allow us to make measurements of the Hubble constant with just a single merger event!

Future Prospects

The ability to make measurements of the Hubble constant based on single events enables us to test an interesting hypothesis: what if the universe’s rate of expansion is sensitive to direction? While those particular measurements are still a few decades in the future, Bustillo and collaborators show that their method will eventually be limited by our electromagnetic observing capabilities, rather than our ability to observe gravitational-wave signals!

Citation

“Mapping the Universe Expansion: Enabling Percent-level Measurements of the Hubble Constant with a Single Binary Neutron-star Merger Detection,” Juan Calderón Bustillo et al 2021 ApJL 912 L10. doi:10.3847/2041-8213/abf502

illustration of a bright accretion disk surrounding a black hole in the foreground, siphoning matter from a background, orange star.

Accreting, stellar-mass black holes are anything but predictable. A new study explores what’s happening as these feeding monsters erupt in violent outbursts and then settle down again.

Three panel illustration shows bright streams of gas appearing and then disappearing above a black hole and disk

This illustration shows some of the possible transient behavior of the gas flowing onto and away from a black hole in an X-ray binary. [NASA/JPL-Caltech]

An Unsteady Existence

Black hole X-ray binaries (BHXBs) consist of a stellar-mass black hole that siphons material from an ordinary companion star. As this material flows between the objects, it forms an accretion disk around the black hole. BHXBs shine in X-rays from the hot material of this disk, and from a mysterious corona — ultra-hot gas that exists in some unknown form above the disk.

BHXBs may accrete quietly and steadily much of the time, but on occasion, they undergo sudden outbursts, substantially brightening in X-rays. Unlike supermassive black holes, which evolve on extremely long timescales, stellar-mass black holes can change over just days or weeks — short enough for us to watch!

In a new study led by Jingyi Wang (MIT Kavli Institute), a team of scientists presents observations by NICER — an X-ray telescope installed on the International Space Station — of a BHXB throwing such a temper tantrum.

Reflections of a Transition

During an outburst, a BHXB undergoes state transitions, displaying changes in the X-ray luminosities and energies as either the corona or the disk takes over to dominate the emission. In addition to the X-ray changes, persistent radio emission from a slow and steady jet can be suddenly replaced by a short-lived radio flare that then subsides.

Despite many observations, we lack the details of what’s happening on small scales, close around the black hole. What form does the corona take? Does its size or extent change over time? What drives the state transitions? And how are the different components of this system — disk, corona, and jet — related, if at all?

top plot shows height of corona over time. bottom two schematics show the relative locations and shapes of the corona, disk, and jet.

The top plot (a) shows the inferred corona height (black line) over the span of the outburst. The radio emission, including the flare, can be seen in red. The bottom two diagrams show the authors’ picture of the geometry of the black hole, disk, and corona at two points during the state changes: during the rise from quiescence (b), and at the end of the outburst when the jet base is ejected (c). Click to enlarge. [Adapted from Wang et al. 2021]

Wang and collaborators used NICER data of the BHXB system MAXI J1820+070 during a 2018 outburst to track the lag caused by light travel time between X-rays that arrived directly from the corona and light from the corona that was reflected by the disk before reaching us. By modeling the changes in this reverberation lag as the system underwent state transitions, the team could infer the geometry on the small scales we can’t observe, helping us to understand the tantrum.

A Connected Picture

Wang and collaborators show that the best explanation of NICER’s observations is that the height of the X-ray corona changes during the BHXB’s state transitions. They argue that the corona first contracts, and then rapidly expands during the outburst, preceding a radio flare by ~5 days.

Under the authors’ interpretation, these signs point to a neat picture of BHXB outbursts: a quietly accreting black hole has a disk and a steady jet, and the corona makes up the base of that jet. When the BHXB goes into outburst, it ejects that jet base as a bright knot in its final moments of outburst, before fading back to quiescence.

While this model isn’t yet definitive, this latest evidence points to a clear connection between the disk, jet, and corona of a BHXB. We’re sure to gain more insight ahead!

Citation

“Disk, Corona, Jet Connection in the Intermediate State of MAXI J1820+070 Revealed by NICER Spectral-timing Analysis,” Jingyi Wang et al 2021 ApJL 910 L3. doi:10.3847/2041-8213/abec79

Illustration of a dark, purple, banded planet against the night sky.

It’s human nature to try to categorize the things we observe in the universe. But what happens when something doesn’t fit into the neat categories we’ve established? A new study explores one such object: an especially perplexing brown dwarf.

Illustration of five spheres of different sizes representing the relative sizes of the sun, a low-mass star, a brown dwarf, jupiter, and the earth.

Brown dwarfs are intermediate in size between the largest planets and the smallest stars. [NASA/JPL-Caltech/UCB]

A Hidden Population

Brown dwarfs — substellar objects that aren’t massive enough to fuse hydrogen in their cores — are an intriguing population. Not quite stars and not quite planets, these objects occupy an uneasy in-between space that’s worth studying further.

But the coldest brown dwarfs — which fall into spectral category Y and have effective temperatures below ~450 K — are a challenging population to study! These chilly objects don’t emit much light, and what little they do radiate is concentrated in the infrared near 5 µm. These objects are therefore difficult to observe from the ground, so we rely on space-based missions to discover the faint light from these objects.

An Accidental Find

Thus far, we’ve managed to detect around 50 of these cold Y dwarfs. To better categorize them, we plot them on color–color and color–magnitude plots to compare their brightnesses at different wavelengths. A recent discovery, however, isn’t behaving as expected.

WISE 1534–1043, nicknamed “The Accident” when it was found serendipitously in a field imaged by the Wide-field Infrared Survey Explorer, is a lone brown dwarf speeding across the sky. An article led by J. Davy Kirkpatrick (Caltech) now presents new, follow-up observations of this puzzling object collected with the Hubble Space Telescope and with the Keck Observatory in Hawaii.

Defying Categorization

Two plots showing comparison of two different colors and J-band magnitude vs color for known brown dwarfs.

Color–color (top) and color–magnitude (bottom) plots exploring WISE 1534–1043’s  photometric properties (red data points, plotted using two different models) show that its behavior is unique among known, nearby, cold brown dwarfs. [Adapted from Kirkpatrick et al. 2021]

These new observations pinpoint WISE 1534–1043’s location — just ~50 light-years away — and confirm its bizarre observational properties. Looking at the color–color and color–magnitude plots to the right, it’s clear that WISE 1534–1043 lies in a quadrant entirely on its own.

Measurements of The Accident’s absolute brightness at different wavelengths are all in line with the coldest known Y dwarfs. But its relative colors (as shown by the W1 – W2, ch1 – ch2, and J – ch2 measurements in the plots) and magnitudes fall entirely outside of the range of known brown dwarfs.

Identity Options

What could be the explanation for these enigmatic properties? Kirkpatrick and collaborators use their observations to consider four possible identities for The Accident:

  1. An extremely low-metallicity, old, cold brown dwarf
  2. An extremely low-mass, low-gravity, young brown dwarf
  3. An ejected exoplanet
  4. An ultracold stellar remnant (like a white dwarf or an exotic ablated stellar core)

Of these options, the authors determine that the first is the most likely. If WISE 1534–1043 is old and remarkably low-metallicity, then the outer layers of its atmosphere would have decreased opacity, allowing us to see deeper into it and potentially explaining the unusual photometric properties. This could mean that The Accident represents the first known Y-type subdwarf — a brand new category of star.

“Verification, refutation, or further befuddlement” should be possible in the future with observations from the upcoming James Webb Space Telescope, suggest the authors. In the meantime, the refusal of objects like The Accident to fit neatly into boxes continues to keep us on our toes!

Citation

“The Enigmatic Brown Dwarf WISEA J153429.75-104303.3 (a.k.a. “The Accident”),” J. Davy Kirkpatrick et al 2021 ApJL 915 L6. doi:10.3847/2041-8213/ac0437

Still from a simulation showing a tidal stream of neutron-star matter accreting onto a black hole.

In the past six years, we’ve observed black holes merging with black holes and neutron stars colliding with neutron stars. Now, the universe is mixing things up: we’ve finally made the first definitive detection of a black hole merging with a neutron star.

What We’d Previously Seen

Plot showing masses of observed black hole and neutron star binary mergers. Plot includes black holes detected through electromagnetic observations (purple), black holes measured by gravitational-wave observations (blue), neutron stars measured with electromagnetic observations (yellow), and neutron stars detected through gravitational waves (orange).

The rapidly expanding “stellar graveyard”, a plot that shows the masses of compact objects observed via gravitational waves and other means. GW200105 and GW200115 are highlighted toward the center of the collection. Click to enlarge. [LIGO-Virgo/Frank Elavsky, Aaron Geller/Northwestern]

Gravitational-wave detectors like LIGO, Virgo, and KAGRA are designed to detect space-time ripples from compact objects in inspiraling binary pairs. In LIGO/Virgo’s first two and a half observing runs (O1, O2, and O3a), the detectors identified 48 instances of black hole–black hole mergers and 2 neutron star–neutron star mergers. But theory predicts that black hole–neutron star mergers should occur too!

Now, the LIGO/Virgo collaboration is releasing some of the first results from the second half of its third observing run (O3b) — and these results include two detections of a black-hole-mass object colliding with a neutron-star-mass object.

What Was Found

Using the LIGO detectors in Livingston and Hanford and the Virgo detector in Europe, the collaboration spotted two separate events spaced 10 days apart:

  • GW200105 was detected by LIGO Livingston and Virgo (LIGO Hanford was temporarily offline at the time), and the signal is consistent with a black hole of 9 solar masses colliding with a neutron star of 1.9 solar masses.
  • GW200115 was detected by all three LIGO/Virgo detectors, and the signal is consistent with a black hole of 6 solar masses colliding with a neutron star of 1.5 solar masses.
Five plots show the time–frequency data in the different detectors for the two merger signals.

The gravitational-wave signals in each detector for GW200105 and GW200115. Click to enlarge. [Abbott et al. 2021]

Thus far, no electromagnetic signatures have been detected in association with either event — but if the neutron stars were swallowed whole by the black holes instead of first being torn apart, no such signatures are expected.

Without electromagnetic evidence to prove that the secondaries of these two events were neutron stars, we instead rely on our measurements of the masses from the gravitational-wave signals. Comparing these measurements to the masses of known neutron stars in our galaxy, it’s clear that the secondaries both fall comfortably in the expected range of masses for neutron stars.

What We Can Learn from This

While scientists are excited to have finally completed “the family picture” of compact object mergers, GW200105 and GW200115 are more than a milestone — they also carry valuable information.

First, the combination of these two signals has allowed scientists to start estimating the rate of black hole–neutron star mergers. Assuming GW200105 and GW200115 are representative of the broader population, the authors infer that ~12–120 of these mergers occur per Gpc3 per year (that’s roughly one per month within a distance of a billion light-years).

black holes in a globular cluster

Still from a simulation showing how black holes might interact in the chaotic cores of globular clusters. Black holes are expected to dominate these dense cores, so black hole–neutron star collisions are rarer via this formation channel. [Carl Rodriguez/Northwestern Visualization]

In turn, this rate provides clues as to how these binary systems may have formed. Different formation channels predict different merger rates; right now, the estimated rate is most consistent with that predicted from binaries formed in isolation or in young star clusters. In contrast, dynamical formation of binaries in dense nuclear star clusters and globular clusters predicts a lower merger rate.

It’s too early to draw strong conclusions, however, and we’ll be able to better understand the relative contributions of these different channels as we make more detections of black hole–neutron star binaries in the future! With KAGRA recently online and LIGO/Virgo soon returning with additional upgrades, we can hope for many more such discoveries ahead as we continue to expand our view of the gravitational-wave universe.

Citation

“Observation of Gravitational Waves from Two Neutron Star–Black Hole Coalescences,” Abbott et al. 2021, ApJL, 915, L5. doi:10.3847/2041-8213/ac082e

An open telescope dome is seen at the left of the image, with a pipe leaving it on the right. The pipe stretches across the entire image, moving into the foreground. The rising sun is roughly in the center of the image. The background is moderately populated with trees.

Starspots are regions on the surface of a star that are cooler than their surroundings. Temperature affects brightness, so starspots can significantly alter the overall appearance of a star even when individual starspots can’t be distinguished. But if we characterize starspots in detail, we should be able to account for their effects.

The constellation Andromeda from Uranographia by Johannes Hevelius. λ Andromedae is just to the left of Andromeda’s thumb on her outstretched arm. [Torsten Bronger]

Old and New Ways of Finding Starspots

Starspots are thought to be caused by stellar magnetic activity, so as much as they can obscure true stellar properties, they can also help us learn about the interiors of stars. We’ve also noticed that our Sun’s starspots behave very differently than starspots on other stars, adding another motivation to examine these phenomena on other stars.  

Until recently, starspots have been studied through indirect methods like light curve modeling and Doppler imaging, which measures changes in stellar spectra caused by magnetic fields. These techniques have broadened our understanding of starspots, but they are also hamstrung by requiring certain assumptions about the stars being observed.

Direct imaging of starspots has been made possible through a relatively new technique called long-baseline optical/near-infrared interferometry (LBI). A recent study led by James Parks (Georgia State University) uses this technique to observe starspots on λ Andromedae, a giant star in a binary with a less massive companion.

Stellar surface images based on observations taken in 2010. The top row is the starspot model images, the middle row is the observations, and the bottom row is the simulated images. The white dot is the resolution of the CHARA array, which was used to take the observations. The starspot models were constructed independently of the simulated images and vice-versa. [Parks et al. 2021]

Telescopes in Tandem

Interferometry is an imaging technique that combines the input of multiple telescopes as though they were a single, much larger telescope. LBI refers to interferometry conducted with telescopes that are spread out across a fairly large distance. For instance, the Event Horizon Telescope image of M87’s central black hole was taken by eight radio telescopes spread out across an entire hemisphere! 

To image the starspots on λ Andromedae, Parks and collaborators used observations taken by the Center for High Angular Resolution Astronomy (CHARA) array, which consists of six 1-meter optical telescopes arranged in a Y-shape. The highest resolution allowed by these observations was 0.4 milliarcseconds (for context, the Moon spans roughly 0.5 degrees, or nearly 2 million milliarcseconds). Data was also taken on the 0.4-meter telescope at Fairborn Observatory to obtain light curves of λ Andromedae that were roughly concurrent to the LBI observations. 

Close-up of a possible starspot in one of the image reconstructions. The larger circle indicates the region that was used to determine starspot properties, and the smaller circle indicates the region that was used to study the calmer surroundings of the spot. [Parks et al. 2021]

Two Different Ways to Model Starspots

Parks and collaborators used the CHARA observations to model λ Andromedae’s starspots in two different ways. The first method was to model the star’s surface while allowing for starspots, where the resulting models were informed by the CHARA observations. The second way was image reconstruction, which uses the observing conditions during which images were taken to determine the underlying astrophysical components. The advantage of using image reconstruction over surface modeling is that image reconstruction requires fewer assumptions about the object in question. However, false artifacts can be generated during the reconstruction process.

Both methods found between one and four starspots on λ Andromedae at any given time. The starspots also pointed to a rotation period that matched the period determined from the concurrent light curves. Overall, the study was a successful demonstration of using LBI to image starspots on λ Andromedae and, excitingly, more detailed studies are to follow!

Citation

“Interferometric Imaging of λ Andromedae: Evidence of Starspots and Rotation,” J. R. Parks et al 2021 ApJ 913 54. doi:10.3847/1538-4357/abb670

For decades, scientists have used networks of pulsars to search for a faint, background gravitational-wave signal that should pervade our universe. What have they found so far, and what can we expect in the future? A new publication details the possibilities.

Humming in the Background

Mrk 739

Mrk 739 is an example of a galaxy merger where the two nuclei at the center of the newly-formed galaxy are still in the process of merging. [SDSS]

In recent years, the LIGO and Virgo gravitational-wave detectors have clocked dozens of observations of stellar-mass black hole binary mergers. But what about larger black holes?

When galaxies collide, the supermassive black holes at their centers should also form binaries, inspiral, and merge. The combination of all inspiraling supermassive black hole binaries across the universe should produce a deep background hum of gravitational waves — a signal that we could detect, with the right tool. Enter: pulsar timing arrays (PTAs).

Cosmic Clocks

PTAs rely on the remarkably consistent timing of flashes of light from a network of spinning neutron stars — pulsars — to measure the stretching of the spacetime in which these pulsars are embedded.

pulsar timing array

An artist’s illustration showing how a network of pulsars could be used to search for the ripples in space-time. [David Champion/NASA/JPL]

As gravitational waves pass through spacetime, signals from the various pulsars in the network have to travel longer or shorter distances to reach us. PTAs measure those timing differences to search for a stochastic background gravitational-wave signal.

A Hint of a Signal

How are PTAs doing so far? The North American Nanohertz Observatory for Gravitational Waves (NANOGrav) has been searching for the gravitational-wave background for more than a decade — until now, without success. But the longer we observe the timings of a set of pulsars, the more subtle a signal we can detect. 

The 12.5-year dataset released this year offers a first glimpse of hope: this most sensitive dataset yet shows signs of a signal consistent with the predicted gravitational-wave background. Definitive evidence of the background will require longer observations with NANOGrav to beat down the noise and reveal an expected set of correlations between pairs of pulsars.

Plot of the spectrum for gravitational wave astronomy shows where nanograv fits in relative to LIGO and LISA.

The gravitational wave spectrum and detectors. Here, frequency of the gravitational waves is plotted against strain (the fractional change in the separation between objects caused by the passage of the gravitational wave). Click to enlarge. [NANOGrav]

So when can we hope to robustly detect this signal, and what will it tell us? In a new publication led by Nihan Pol (Vanderbilt University, West Virginia University), a team of scientists emulates and extends the NANOGrav dataset into the future and tries to recover injected gravitational-wave-background signals to learn what we can expect.

Milestones Ahead

Pol and collaborators identify three key milestones that we should soon achieve.

  1. Robust evidence of the gravitational-wave background should be possible with 15–17 years of data — only another 2–5 years beyond the 12.5-year dataset already published.
  2. The signal detected at this time will already contain enough information to identify whether the gravitational-wave background is caused by supermassive black hole binaries, as anticipated, or if it instead has more exotic origins, like primordial black holes or cosmic strings.
  3. If the signal is caused by supermassive black holes, the initial detection will also be sufficient to distinguish between different population models for supermassive black hole binaries.

This work illustrates that NANOGrav has the potential to provide us with a wealth of information in the next few years! What’s more, those results will come even faster with the addition of new pulsars to NANOGrav’s network, or the combination of data from multiple PTAs. Gravitational-wave astronomy is truly only just getting started!

Five plots: a single one at the top, three in the middle, and one at the bottom. Description in the text.

Top: Evolution of the signal-to-noise ratio as a function of time observing the pulsars. Middle: The predicted correlation signal between pulsars after 12 years, 15 years, and 20 years, compared to the model (dashed red line) showing the presence of a gravitational-wave background. Bottom: The signal-to-noise ratio of the correlation signal as a function of observing time. [Pol et al. 2021]

Citation

“Astrophysics Milestones for Pulsar Timing Array Gravitational-wave Detection,” Nihan S. Pol et al 2021 ApJL 911 L34. doi:10.3847/2041-8213/abf2c9

illustration of an active galactic nucleus with dusty disk and polar winds.

What’s going on deep in the centers of active galaxies, close around the supermassive black holes feeding off of their surroundings? A new study uses infrared observations to explore this inner region in one active galaxy.

A Unified Picture?

Illustrative schematic showing a torus surrounding clumps of gas around a central black hole. Different viewing angles are labeled.

The geometric dependence of AGN types in the unified AGN model. Type 1 AGN are viewed from an angle where the central engine is visible. In Type 2 AGN, a dusty torus obscures the central engine from view. [Urry & Padovani, 1995]

We know that active galactic nuclei (AGN) consist of a supermassive black hole accreting surrounding material and shining brightly across the electromagnetic spectrum. But the structure of the gas and dust close around the black hole, and the causes of the different emission we see, have remained a topic of debate.

Decades ago, scientists proposed that Type 1 and Type 2 AGN — two different categories of active galaxies with different observational properties — might be the same objects viewed from different angles. This unification scheme relies on the presence of a dusty torus — a puffed-up, donut-like dust structure close to the black hole. In this model, the torus obscures the inner, emission-line-producing gas from some viewing angles, changing the appearance of the AGN based on its orientation.

But recent infrared observations have challenged this view. With powerful mid-infrared telescopes, we’ve taken a closer look at the inner few hundred light-years of nearby active galaxies — and instead of revealing an obscuring torus of dust, these observations have shown polar dust structures.

Aerial photograph of a complex of telescopes on a mountainside over the ocean.

The Very Large Telescope Interferometer (VLTI) in Chile. [ESO/G. Hüdepohl]

A Search for Distant Dust

How can we explain these observations? Theorists have a solution: in the disk–wind model, the dust close to the black hole is arranged in a hot, equatorial disk rather than a torus. Radiation pressure then blows some of this dust off into a cooler wind from the poles, producing the polar structures we’ve seen in mid-infrared observations. Obscuration comes from the disk and the launch region of the wind.

The equatorial disk in this model should lie on scales too small to have been previously observed in mid-infrared — but there’s a new tool on the scene! GRAVITY, an interferometric instrument on the Very Large Telescope Interferometer in Chile, operates in the near-infrared. This makes it the perfect instrument to search for the very hot dust that would lie in a disk at the heart of an AGN.

Plot of the fitted near-infrared data shows an elongated ellipse perpendicular to a designated polar region.

The Gaussian fits to the near-infrared emission show an elongated structure (center) oriented along the AGN’s equator. This is in contrast to the polar-aligned mid-infrared emission (orange region) that may represent a disk wind. [Adapted from Leftley et al. 2021]

In a new study led by James Leftley (University of Southampton, UK; Côte d’Azur University, France; ESO, Chile), a team of scientists has now used GRAVITY to obtain near-infrared observations of the center of ESO 323-G77, a local active galactic nucleus.

Getting to the Heart of the Matter

Through careful analysis and modeling, Leftley and collaborators interpret their observations on scales of less than a light-year (for an object that’s hundreds of millions of light-years away!). The result? The near-infrared observations are consistent with an extended, equatorially aligned hot dust disk. The scale of this disk neatly matches the size predicted in disk–wind models.

Though the data are still too sparse and noisy to rule out the torus model in favor of the disk–wind model, these observations represent an important step in understanding how dust may be distributed in the heart of active galaxies.

Citation

“Resolving the Hot Dust Disk of ESO323-G77,” James H. Leftley et al 2021 ApJ 912 96 6. doi:10.3847/1538-4357/abee80

1 44 45 46 47 48 111