Features RSS

Illustration of a dusty accretion disk surrounding the supermassive black hole at the center of a galaxy

Do models of turbulent, magnetized gas in accretion disks around black holes “remember” the conditions they started with, or is that information washed away as the model evolves?

Magnetic Fields and Accretion Disks

If you’re an astronomer, you may already know this joke: an astronomer is speaking with a therapist, discussing a recent bout of sleeplessness. The therapist asks, “What do you think it is that’s keeping you up at night?” Staring wide-eyed at the ceiling, the astronomer whispers, “Magnetic fields…”

Today’s article presents one example of why astronomers might lose sleep over magnetic fields. Magnetic fields are a key component of accretion disks, which feed material to growing stars, black holes, and other objects. Researchers have had great success in modeling magnetized accretion disks, but the huge computational cost of increasingly complex models has prompted the use of time-saving shortcuts with the potential for unintended side effects.

Testing a Model’s Memory

One way to speed up simulations is to start out with the model’s magnetic fields close to the desired end state. Recently, Payton Rodman (University of Cambridge) and Christopher Reynolds (University of Cambridge and University of Maryland) tackled the question of whether it matters what kind of magnetic fields a model starts with when simulating accretion disks around supermassive black holes.

illustration of poloidal and toroidal directions

Illustration of the poloidal (red arrow) and toroidal (blue arrow) directions. [Wikipedia user DaveBurke; CC BY 2.5]

Our best observations of supermassive black holes suggest that the magnetic fields close to the black hole are strong and poloidal, meaning that the fields are vertical close to the black hole and arc up over the disk. These strong poloidal fields are thought to be responsible for launching powerful black hole jets.

To save time, many models start out with a strong poloidal magnetic field. However, real accretion disks might instead start out with weak toroidal magnetic fields, which circle the black hole horizontally. If all magnetic fields, regardless of initial strength of configuration, “forget” their initial state and eventually evolve into the strong poloidal fields that researchers observe, that means that modelers can choose any reasonable starting parameters. If the magnetic fields retain a memory of their initial state, modelers will need to carefully examine their starting conditions and how the fields evolve.

A Clear Imprint

Rodman and Reynolds compared the evolution of weak and strong toroidal magnetic field models to test the “memory” of their accretion disk model. They found that the weak and strong magnetic field simulations diverged quickly and didn’t reach the same end point — the final outcome retained an imprint of the initial field strength.

plot of magnetic field streamlines from the simulation results

Magnetic field streamlines for simulations with a weak initial magnetic field (left) and a strong initial magnetic field (right). Click to enlarge. [Rodman & Reynolds 2024]

Ultimately, the weak and strong toroidal magnetic fields both produced poloidal fields, but how strong the fields were and how widely they were distributed depended on the initial field strength. Critically, neither simulation generated poloidal fields strong and widespread enough to reach the magnetically arrested disk regime, which is thought to govern how supermassive black holes at the centers of galaxies accrete matter and produce jets.

The results of this study make it clear that initial magnetic field conditions must be chosen carefully, as accretion models appear to have long memories. Future work should delve into this issue further, hopefully helping astronomers everywhere to rest easier.

Citation

“Evolution of the Magnetic Field in High- and Low-β Disks with Initially Toroidal Fields,” Payton E. Rodman and Christopher S. Reynolds 2024 ApJ 960 97. doi:10.3847/1538-4357/ad0384

Illustration of a blue supergiant star

New research shows that the properties of some blue supergiant stars can be explained by the merger of a massive star with a smaller companion. This suggests that many of the brightest and hottest stars in our galaxy are not born, but made.

One Star or Two?

JWST image of SN 1987A

JWST image of SN 1987A. Some research suggests that the intricate ejecta pattern could not be possible without the supernova progenitor star undergoing a merger. [NASA, ESA, CSA, Mikako Matsuura (Cardiff University), Richard Arendt (NASA-GSFC, UMBC), Claes Fransson (Stockholm University), Josefin Larsson (KTH)]

The blue supergiant stage is a brief phase in the lives of hot, massive stars. Though the phase is short-lived, there seem to be a lot of blue supergiants, and despite the fact that massive stars tend to live in pairs or trios, there seem to be a lot of supergiants without a stellar partner. These curious findings could be explained by a scenario in which some blue supergiants form when a massive star swallows its companion.

Researchers have applied this line of thinking to several famous massive stars like Eta Carinae and the progenitor of the supernova SN 1987A, showing that the merger model explains these stars’ unusual properties. Now, a research team led by Athira Menon (Institute of Astrophysics of the Canary Islands and University of La Laguna) has taken the investigation a step further, using this model to explain the varied properties of a population of blue supergiant stars in a neighboring galaxy.

evolutionary track of a stellar merger product

Evolutionary track for the merger product of a 31.6-solar-mass star and a 3.2-solar-mass star. [Menon et al. 2024]

A Star Is Made

Menon’s team used the Modules for Experiments in Stellar Astrophysics (MESA) to model the evolution of post-merger stars and to compare the properties of blue supergiants coming from single stars to those coming from stellar mergers.

In the stellar merger scenario, blue supergiants result from the collision of a massive post-main-sequence star and its main-sequence binary companion. As the massive star expands, it donates some of its mass to its companion, which eventually becomes entangled in the extensive outer atmosphere of the larger star. Doomed by friction and tidal forces, the smaller star “dissolves” within the larger star, setting the resulting star on a new evolutionary path.

Clues from Chemical Abundances

The team found that blue supergiants formed through mergers have different surface abundances of elements like carbon and oxygen compared to supergiants arising from single stars. To compare these results to the properties of actual blue supergiants, the team amassed a sample of 59 blue supergiant stars in the Large Magellanic Cloud and divided them into three groups based on the ratios of their carbon, nitrogen, and oxygen abundances.

chemical abundances of modeled and observed blue supergiants

Chemical abundance ratios for modeled stars (star icons) and observed blue supergiants (BSGs; triangles). Click to enlarge. [Menon et al. 2024]

The first group, which had relatively little nitrogen compared to carbon and oxygen, matched the outcomes of the single-star models — these stars are likely “true” blue supergiants that evolved from single stars. The second group, with moderate N/C and N/O ratios, could be explained by either single stars or stellar mergers. The final group, which made up about 40% of the sample, had larger abundance ratios that the single-star model couldn’t reproduce.

Taking into account other factors, such as systematic offsets, Menon’s team concluded that more than half of the 59 stars in their sample came from stellar mergers. This suggests that many blue supergiant stars owe their status to a stellar merger, and the merger model is a valuable tool to understand blue supergiant populations throughout the universe.

Citation

“Evidence for Evolved Stellar Binary Mergers in Observed B-type Blue Supergiants,” Athira Menon et al 2024 ApJL 963 L42. doi:10.3847/2041-8213/ad2074

Pulsars are the universe’s natural lighthouses, and we can learn much about them by modeling their periodic flashes. But, fitting these models is a tricky task that often requires manual decision-making. A new algorithm, however, promises to offload that work to the computers.

Listening to the Sky

A photograph of a 100m radio dish in an otherwise empty field.

The Green Bank Telescope, a workhorse among pulsar timing observatories. [NRAO/AUI/NSF, CC BY 3.0]

Pulsars, or neutron stars formed from the collapse of a massive star that can rotate hundreds of times each second, make excellent cosmic metronomes. As they spin, they slash Earth with beams of radiation that swing around once per revolution, and for decades now astronomers have used radio telescopes to record the arrival times of these periodic pulses. After collecting data over a few years, observers can try to fit them with models of the pulsar’s spin and a handful of other relevant properties.

At first glance, carrying out these fits might seem like a straightforward task since pulsar system can be described by only a handful of parameters including the spin frequency and its drift rate over time. So, naively one would think that if you’re just looking for the best-fitting parameters, you could code up a model, then fiddle around with its inputs until the fit looks correct. Unfortunately, radio astronomers are not so lucky.

Counting (Pulsar Rotations) Can Be Hard

A residual vs. time plot where the residuals are nearly uniformly distributed in phase from -0.5 to 0.5, indicating a poor fit to the data.

The residuals to the initial fit for one example pulsar. Since the model’s spin frequency is slightly incorrect, the scatter in the residuals is far larger than expected given the tiny error bars. [Taylor et al. 2024]

To illustrate why this simple task is actually quite finicky, consider just the variable describing the pulsar’s period and two measurements separated by a year. If we tweak the period by only a billionth of a second, that would imply that the pulsar has completed tens of thousands of more or fewer rotations in that time. It’s unlikely that the model’s predicted times precisely line up with the data for both observations, and once you also add the rate that the period changes, it suddenly becomes difficult to find the uniquely best combination of parameters that describe the data.

So, astronomers typically proceed cautiously. Instead of rushing in and immediately trying to fit all of the data with all of the parameters at once, they instead fit subsets of the data with simpler models, then iteratively add complications until they’re left with the full, final model. Historically, this was a manual process that involved a lot of choices about what to include and reject at each step, and scientists would often spend hours on each pulsar to get it right.

New Automation

A tree diagram with about 100 branches terminating around level 10, while one continues down to level 30.

An illustration of how the new algorithm tries different paths towards the final model fit. [Taylor et al. 2024]

In the past few years, however, the community has begun to develop more automated and efficient codes to offload more of the manual work to computers. The latest and most complex of these was just released by Jackson Taylor of West Virginia University. Called “Algorithmic Pulsar Timer for Binaries,” this open-source, Python-based script uses a tree-like structure to decide which of the model components to add or remove at each iteration, and it can automatically search hundreds of different decision paths without requiring expert intervention.

Taylor and collaborators designed their algorithm to handle not just isolated pulsars, but also more complicated systems where the pulsar has a nearby companion that affects its motion. To test their code, they let their new algorithm loose on two newly discovered pulsars that would have been very challenging to fit “by hand” due to the limited number of observations. Happily, they found that their procedure succeeded where a human would struggle: after exploring many different decision trees, it landed on a satisfactory solution in both cases.

Though it still requires several hours to arrive at the global best fit, being able to check so many paths in such a uniform way is an enormous benefit to previously bogged-down astronomers. As we continue to discover more and more pulsars, tools like this will likely see increased use over the next several years.

Citation

“Algorithmic Pulsar Timer for Binaries,” Jackson Taylor et al 2024 ApJ 964 128. doi:10.3847/1538-4357/ad1ce9

the Milky Way's central black hole in polarized light

In 2022, the Event Horizon Telescope Collaboration released the first image of the supermassive black hole at the center of the Milky Way. Now, the team has taken a closer look at our hometown black hole to understand the nature of its magnetic fields, the spin of its accretion disk, and more.

A First Look at the Milky Way’s Supermassive Black Hole

Event Horizon Telescope image of the Milky Way's central supermassive black hole

The first EHT image of Sgr A*. [EHT Collaboration; CC BY 4.0]

Nearly seven years ago, a global network of radio dishes named the Event Horizon Telescope (EHT) turned toward the center of our galaxy. These telescopes peered through 27,000 light-years of gas, dust, and stars to study the massive object that is nestled there: Sagittarius A*, or Sgr A* (pronounced “sadge-ay-star”) for short, is a compact object four million times more massive than the Sun.

These observations revealed a bright ring of emission from the superheated accretion disk surrounding Sgr A* and confirmed that it is indeed a supermassive black hole with an event horizon — a surface beyond which nothing, including light, can escape the black hole’s immense gravitational pull.

polarization of Sagittarius A*

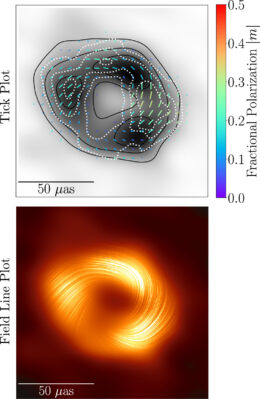
Top: Average polarization fraction for Sgr A*. Bottom: Polarization “field lines” showing the spiral pattern of the polarization angles. [EHT Collaboration et al. 2024]

From Brightness to Polarization

But the EHT did more than just measure the brightness of the glowing gas surrounding Sgr A* — it also measured the light’s polarization. As light waves wiggle through space, they can be oriented in any direction. If the light is oriented every which way, that light is unpolarized. If instead the waves are oriented along a particular plane, the light is polarized.

Hot, magnetized plasma emits linearly polarized light because the magnetic field influences the direction in which light waves oscillate. If this polarized light travels through magnetized material, the direction of polarization might rotate or become random. By analyzing the polarization of an object’s emitted light, researchers can study the strength and structure of the object’s magnetic fields and determine whether or not there is magnetized material between the source and our telescopes.

The EHT data show that the light from the hot, gaseous accretion disk surrounding Sgr A* is strongly polarized, with certain parts of the glowing disk being up to 40% linearly polarized. Some of the light — 5–10% — is circularly polarized, which means that the orientation of the waves rotates as the light travels. The polarization direction follows a distinct pattern, forming a spiral that curls around the black hole.

Measurements, Modeling, and Magnetic Fields

The amount of polarized light and the direction of polarization can help researchers disentangle the structure of the magnetic field lines close to the black hole and determine the properties of its accretion disk. The EHT collaboration used simple analytic models and rigorous numerical general relativistic magnetohydrodynamics models to study these properties.

simulated images of polarized emission from Sgr A*

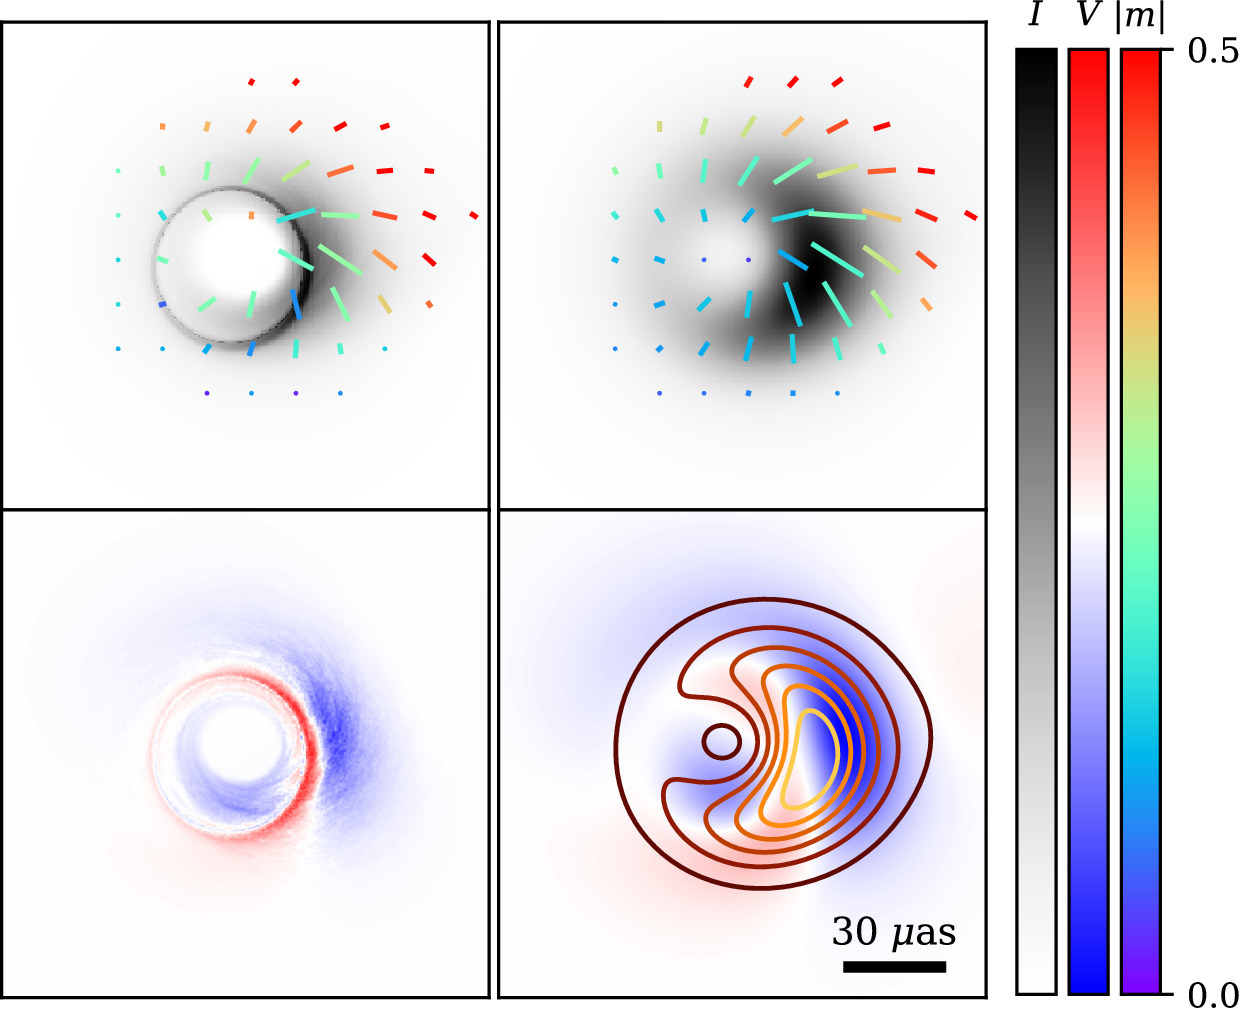
The best-fit model of Sgr A* showing simulated images that are unblurred (left column) and blurred to the approximate resolution of the EHT (right column). The top row shows the total intensity, strength, and direction of the linearly polarized light. The bottom row shows the circularly polarized light. Click to enlarge. [Adapted from EHT Collaboration et al. 2024]

One significant challenge in modeling Sgr A* is its large rotation measure, or the change in the angle of polarization with wavelength. This rotation can come from magnetized material within or outside of the region emitting the polarized light, and it’s not yet clear which is the case for Sgr A*.

If the material is inside the emitting region, this suggests that the black hole’s accretion disk rotates in the opposite direction from what researchers have inferred from previous observations. Additionally, none of the models that place the material inside the emitting region can meet all of the observational constraints. If the material is instead outside this region, this would mean that the disk rotates in the expected direction, and the team finds one model that can meet all of the observational constraints. In this model, Sgr A* is surrounded by strong magnetic fields and the black hole rotates in the same direction as the material swirling around it.

hubble space telescope image of the galaxy M87 and its particle jet

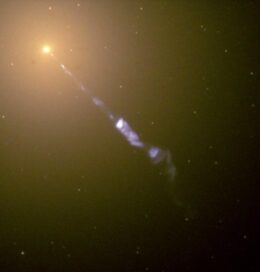
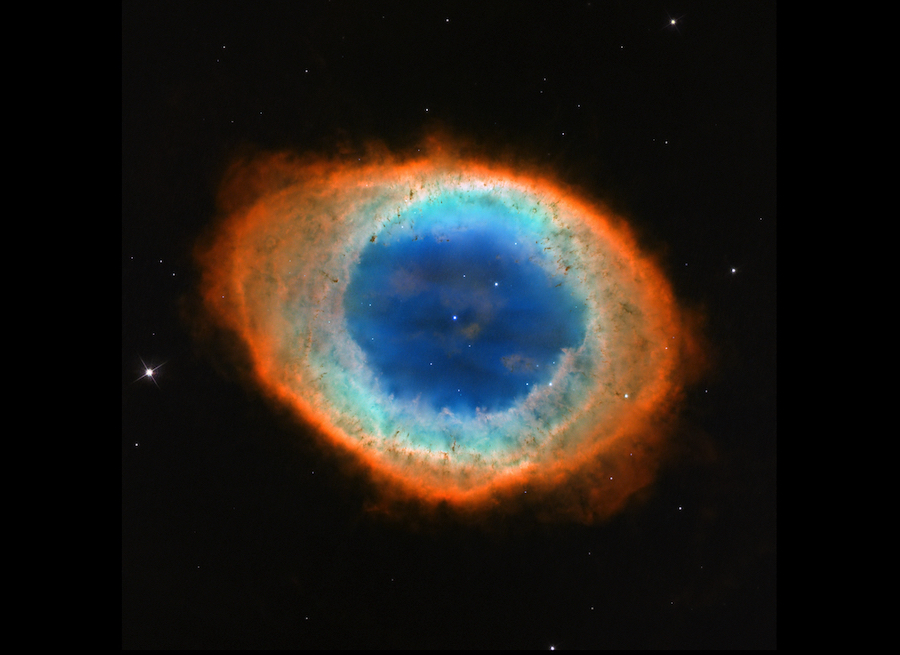
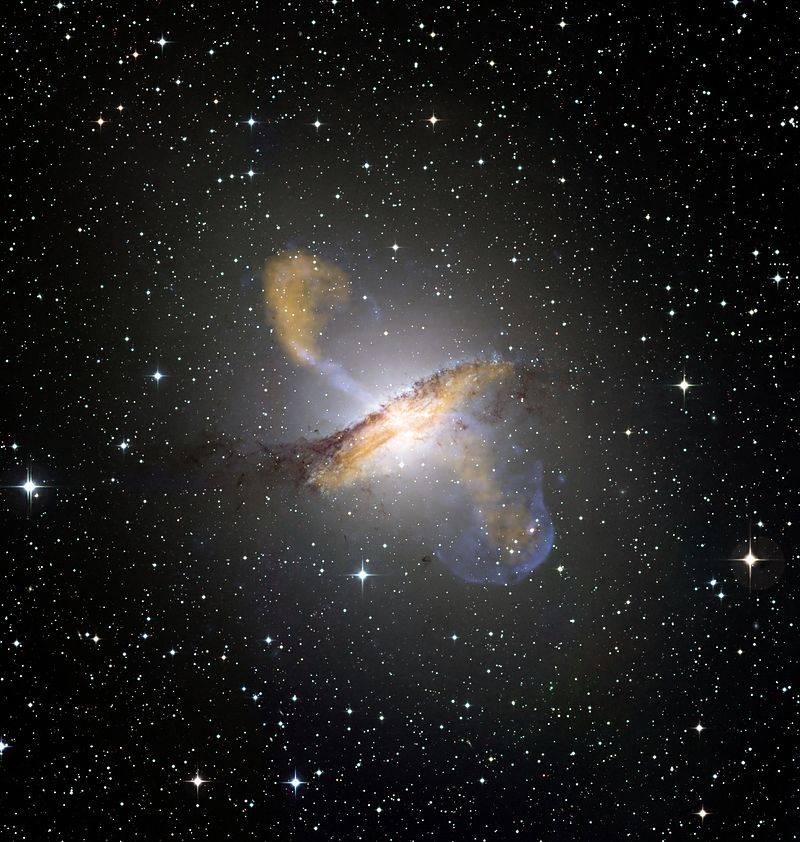
This visible-light image from the Hubble Space Telescope shows the massive elliptical galaxy Messier 87. The Milky Way’s central black hole is much less massive than Messier 87’s, and Messier 87’s larger black hole powers a jet of electrons and other particles, seen here. [NASA and The Hubble Heritage Team (STScI/AURA)]

How Does Sgr A* Stack Up?

In addition to Sgr A*, the EHT has observed M87*, the supermassive black hole at the center of the massive elliptical galaxy Messier 87. M87* is about 1,500 times more massive than the Milky Way’s black hole, and it’s far more active, too — a jet of particles powered by the black hole stretches 5,000 light-years beyond the galaxy, whereas Sgr A* appears to have no jet at all.

Compared to Sgr A*, M87*’s light is much less strongly polarized, with the polarization fraction topping out around 15%. This means that hot, magnetized plasma close to the black hole is scrambling the polarization of the emitted light.

Despite these differences, both M87* and Sgr A* favor magnetically arrested disk models, in which magnetic fields pile up at the inner edge of the accretion disk and moderate the rate at which gas from the disk falls onto the black hole. Because magnetic fields are thought to play a critical role in the creation of supermassive black hole jets, the similarities in the magnetic fields of M87* and Sgr A* could mean that our galaxy’s black hole has a jet that’s yet to be discovered.

Looking Ahead

The EHT Collaboration’s results show that the closest supermassive black hole isn’t necessarily the easiest one to study; Sgr A* varies rapidly, changing noticeably even over the course of a single day’s observations, making the challenging feat of extracting information from the new polarized images even more complicated. The articles published today represent just the beginning of the investigation into Sgr A*’s polarized light, and future advances could come from new observations as well as improvements in modeling.

Models that have different starting conditions, include electrons with different energies, or fuel the black hole with helium gas instead of hydrogen gas, may provide a path forward. Future observations by the EHT will probe Sgr A* at a higher frequency, potentially allowing researchers to discern whether the material that is rotating the polarized light from the disk lies within the emitting region or outside of it.

While you wait for new measurements and modeling breakthroughs, be sure to check out all the Sgr A* research from the EHT team in the Focus Issue on First Sgr A* Results from the Event Horizon Telescope.

Citation

“First Sagittarius A* Event Horizon Telescope Results. VII. Polarization of the Ring,” EHT Collaboration et al 2024 ApJL 964 L25. doi:10.3847/2041-8213/ad2df0

“First Sagittarius A* Event Horizon Telescope Results. VIII. Physical Interpretation of the Polarized Ring,” EHT Collaboration et al 2024 ApJL 964 L26. doi:10.3847/2041-8213/ad2df1

photograph of a white dwarf

Most stars in the Milky Way will evolve into white dwarfs: ultra-hot, crystallized stellar cores, some of which have magnetic fields millions of times stronger than Earth’s. Could the crystallization of white dwarf interiors explain why some of these stars have such strong magnetic fields?

Magnetic Mystery

Hubble image of the Ring Nebula

When a super-hot white dwarf illuminates the diffuse shells of gas that surround it, we see a glowing planetary nebula. The central white dwarf is visible in this image of the Ring Nebula. [NASA, ESA and the Hubble Heritage (STScI/AURA)-ESA/Hubble Collaboration]

Roughly 5–6 billion years from now, the Sun will cease all nuclear fusion in its core and cast off the outer layers of its atmosphere. Left behind will be a blazingly hot, Earth-sized core of carbon and oxygen wreathed in a colorful and ephemeral planetary nebula. This carbon–oxygen core — a white dwarf — will slowly cool over trillions of years and fade from view. Such is the fate of more than 95% of the stars in our galaxy.

Some white dwarfs have extremely strong magnetic fields, and the origin of these fields isn’t yet clear. Though the magnetic fields in question are a million times stronger than Earth’s, they might form in similar ways, as new research from José Rafael Fuentes (University of Colorado Boulder) and collaborators shows.

Creating Crystal Interiors

Many magnetic fields in the universe, including Earth’s, form in liquids that have three properties: they’re electrically conductive, they rotate, and they convect — rising and falling like the globs of wax in a lava lamp. As white dwarfs begin to cool, a process begins by which their liquid interiors may achieve all three criteria necessary to generate a magnetic field.

plot of composition flux as a function of time

The composition flux, τ, as a function of time for a 0.9-solar-mass white dwarf. Convection of the white dwarf’s liquid layer is only efficient while the composition flux is large. [Fuentes et al. 2024]

When first formed, white dwarfs are filled with a hot quantum liquid of carbon and oxygen. As they cool, their centers crystallize into a solid, with a layer of quantum liquid surrounding the crystal core. Crystallization changes the composition of the interior, as oxygen tends to be pulled into the crystal core and carbon tends to remain in the liquid. The difference in chemical makeup causes the electrically conductive, rotating fluid to convect — setting the stage for magnetic-field creation.

To probe whether crystallization could help create the million-Gauss magnetic fields seen in some white dwarfs, Fuentes and collaborators modeled the interiors of white dwarfs as they crystallize. The team used the Modules for Experiments in Stellar Astrophysics (MESA) stellar evolution model to show that during a brief, 10-million-year period, strong convection could generate magnetic fields of 1–100 million Gauss.

Plot of modeled and observed magnetic fields strengths of white dwarfs

Comparison of the magnetic field strengths obtained though modeling (blue line) with the observed magnetic fields of white dwarfs (symbols). The filled symbols show white dwarfs that are expected to be crystallizing, given their ages, while the open symbols show white dwarfs that are likely not yet crystallizing. Click to enlarge. [Adapted from Fuentes et al. 2024]

Short Phase, Lasting Consequences

While the period of strong convection that creates magnetic fields is short lived, the magnetic field is likely to be long lasting; it takes a long time for magnetic fields to dissipate in a white dwarf, especially once it crystallizes completely.

The models used by Fuentes and coauthors reproduce some observed properties of white-dwarf magnetic fields, such as the lack of a dependence of the field strength on the rotation rate. However, the models also predict that magnetic fields should be stronger for more massive white dwarfs, which observations don’t support. Extending the modeling forward in time may reveal how the magnetic fields evolve and diffuse as the star cools, helping to make sense of these magnetic crystalline stars.

Citation

“A Short Intense Dynamo at the Onset of Crystallization in White Dwarfs,” J. R. Fuentes et al 2024 ApJL 964 L15. doi:10.3847/2041-8213/ad3100

active galaxy Centaurus A

A new modeling method allows black holes and the gas that surrounds them to “talk” back and forth, painting a more realistic picture of how black holes collect material and churn out energy.

A Problem of Scale

Centaurus A

Composite image of Centaurus A, a galaxy whose appearance is dominated by the large-scale jets powered by the supermassive black hole at its center. [ESO/WFI (Optical); MPIfR/ESO/APEX/A.Weiss et al. (Submillimetre); NASA/CXC/CfA/R.Kraft et al. (X-ray); CC BY 4.0]

Black holes at the centers of galaxies across the universe consume gas, dust, and even stars from their surroundings. In exchange for this feast, accreting black holes emit powerful jets and radiation that disrupt and heat nearby gas. This process, known as feedback, cements the link between a black hole and its home galaxy.

Supermassive black holes, though enormous, are tiny compared to their host galaxies — the Milky Way’s central black hole’s event horizon stretches roughly 15 million miles, just a minuscule fraction of our galaxy’s half-quintillion-mile diameter. Despite this size mismatch, supermassive black holes are so powerful that they can influence entire galaxies, leaving researchers with the enormous challenge of modeling the complex processes of accretion and feedback across a wide range of spatial scales.

Building a Two-Way Radio

Typically, models of hungry black holes handle the spatial scale issue by nesting simulations spanning different scales within each other and running them in sequence, starting far from the black hole and spiraling in toward it. This strategy helps the model communicate to the black hole what’s going on around it — how much gas there is to snack on, for example — but it needs to let the black hole talk back, too. That’s where a new technique from a team led by Hyerin Cho (조혜린), Center for Astrophysics | Harvard & Smithsonian and the Black Hole Initiative, comes in.

This new technique uses general relativistic magnetohydrodynamics to model black hole accretion and feedback across seven orders of magnitude in spatial scale. The key advance is that the model spirals from large scales down to small scales — and back — hundreds of times, allowing the black hole to chat freely with its surroundings.

Focusing on Feedback

To demonstrate the new method’s capabilities, Cho and collaborators first showed that they could reproduce the standard analytical solution for a black hole accreting unmagnetized gas. Then, they moved on to a more realistic system that includes magnetic fields. Unlike the unmagnetized case, where gas swirls toward the black hole in a smooth and orderly way, the magnetized case is chaotic: random, turbulent movements as the gas is pulled toward the black hole make the accretion rate vary wildly.

simulation results showing the plasma beta and the plasma density across eight orders of magnitude of spatial scale

Maps of plasma beta (β; the ratio of thermal pressure to magnetic pressure within a plasma) and plasma density (ρ) across eight orders of magnitude in spatial scale. Click to enlarge. [Adapted from Cho et al. 2023]

Where does the turbulence come from? Cho’s team found that magnetic field lines close to the black hole are constantly rearranging, relaxing into new configurations that convert pent-up magnetic energy into kinetic energy. In other words, the reconfiguring of the magnetic field heats and accelerates the surrounding gas, prompting large-scale motions that transport energy away from the black hole — and this outward transport of energy signals that black hole feedback is actually taking place!

Importantly, Cho’s team’s results mesh with what researchers have seen for the black holes they’ve observed closely, especially the central supermassive black holes of the Milky Way and the massive elliptical galaxy Messier 87. While this two-way communication represents a huge advance in the modeling of black hole accretion and feedback, there’s more work to be done; future investigations will tackle spinning black holes surrounded by rotating gas.

Citation

“Bridging Scales in Black Hole Accretion and Feedback: Magnetized Bondi Accretion in 3D GRMHD,” Hyerin Cho et al 2023 ApJL 959 L22. doi:10.3847/2041-8213/ad1048

A star at bottom-right and a bright jet leading from it towards top-right.

Though astronomers already knew that strange things can happen in the final moments of a massive star’s life, a recent model may have just taken the top prize as the most bizarre possible ending. In their last gasps, some stars might be cut clean down the middle by a “relativistic blade.”

Raging, Raving Stars

A bright central circle with a narrow jet shooting off the screen towards upper right.

An artist’s illustration of a jet escaping from a collapsing star. [NASA, ESA and M. Kornmesser]

Massive stars are not typically inclined to go gentle into the good night. Instead, as they exhaust the last remains of their nuclear fuel, they opt to mark the ends of their short lives with complex, cataclysmic explosions. Previous work has postulated that these eruptions do not expand outwards in all directions, and that instead, the fireballs take the form of narrow jets that shoot outwards from the star’s core in opposite directions. These high-energy fountains fly outwards at relativistic speeds and burrow deep into the star’s surrounding neighborhood, sweeping up matter as they go.

Though that scenario sounds plenty dramatic, new work by Marcus DuPont and Andrew MacFadyen, New York University, suggests a potentially even more striking scene. Under the right conditions, they surmise that instead of narrow, polar jets, a blast wave could instead expand straight outward along the star’s equator, break through the surface, and cleave the dying star clean in two.

Views of two relativistic blade simulations, one for a narrow blade (top) and one for a wider blade (bottom). In both, the upper hemisphere illustrates density, while the southern illustrates pressure. [DuPont and MacFadyen 2023]

Carving a Star

DuPont and MacFadyen introduce their model of a “relativistic blade” in a playful yet highly technical publication that includes mentions of “pizza slices of uneven length” right alongside topics like “relativistic magnetohydrodynamics” and no fewer than 21 equations in the first five pages. In their telling, as a massive star begins its final collapse, its core can transform into an ultra-dense, ultra-magentized, and rapidly rotating neutron star known as a millisecond magnetar. This rotten heart would seal the star’s doomed fate: the intense winds and magnetic field surrounding the magnetar would deposit enormous quantities of energy into the area around the core that must escape to the surface. Thanks to the magenetar’s spin, that energy would be concentrated into narrow “lamina,” or blades, of outflowing matter that would propagate outwards in just a few seconds.

Moving beyond mathematical musings and into numerical simulations, the pair used software developed earlier by DuPont to illustrate a few caveats of their model. For one, the blades would have to be initially more collimated than their jet counterparts, and for another, the width of the blades has a strong impact on their efficiency and breakout time. But, under a reasonable set of conditions, the simulations show that the blades would “affec[t] a clean slice through the progenitor.”

Consequences of Slashed Stars

Though everyone loves a good star-killing relativistic blade for its own sake, DuPont and MacFadyen did have practical considerations in mind when concocting such a sci-fi sounding model. It’s not currently clear where mysterious flashes of high-energy radiation known as gamma-ray bursts actually come from. Astronomers have developed several models to explain their observations of these bursts, and one of the leading ideas is the earlier-mentioned jets, which would crackle with gamma rays on their journey from their stars’ cores. These blades, too, would unleash gamma rays as they cut through their stars, and thus could also be a source of the observed flashes.

DuPont and MacFadyen suggest that how these bursts fade over time would differ between stars pierced by jets and those cut by blades, meaning that detailed observations may be able to tell the two mechanisms apart some day. They also suggest that more complex models are needed to dial what these blades would look like and how likely they are to arise. That’s great news both for serious astronomers hoping to better understand gamma-ray bursts and space-opera fans alike, who can both look forward to more work on this dramatic hypothesis.

Citation

“Stars Bisected by Relativistic Blades,” Marcus DuPont and Andrew MacFadyen 2023 ApJL 959 L23. doi:10.3847/2041-8213/ad132c

radio image of the star Betelgeuse

artist's impression of a dust cloud blocking the light from Betelgeuse

An artist’s impression of a cloud of dust partially blocking Betelgeuse from view during the Great Dimming. [ESO, ESA/Hubble, M. Kornmesser; CC BY 4.0]

Betelgeuse is a highly recognizable red supergiant star that sits at the shoulder of the constellation Orion. In 2019–2020, Betelgeuse faded to a third of its usual brightness, raising speculation that it was vying for the title of “Most Likely to Go Supernova,” but the star is likely still tens of thousands of years from its explosive end. Instead, the leading theory among astronomers is that Betelgeuse underwent a surface mass ejection, propelling some of its surface gas into space. When this surface material cooled enough to condense into dust, it blocked some of Betelgeuse’s light, causing the dramatic, months-long dimming episode.

Today, we’re introducing three recent articles that examine Betelgeuse’s intriguing behavior and uncertain past.

How Did the Great Dimming Affect Betelgeuse?

Betelgeuse's brightness and radial velocity from 2012 to 2023

Betelgeuse’s brightness (top) and radial velocity (bottom) over time. The Great Dimming, marked by the vertical purple line, appears to have brought about a new periodicity in these quantities. Click to enlarge. [MacLeod et al. 2023]

Up until the “Great Dimming,” Betelgeuse’s brightness varied somewhat regularly, with a period of about 400 days discernible from the wiggles in its light curve. Coupled with the observed movement of the star’s surface, these changes reveal that Betelgeuse is pulsating as the entire star expands and contracts together. When examining the star’s behavior post-dimming, a team led by Morgan MacLeod (Center for Astrophysics | Harvard & Smithsonian) discovered that a new strong periodicity had emerged with a cadence of 200 days.

MacLeod’s team used hydrodynamics simulations to connect the change in variability to changes in the star’s interior. The gaseous outer envelope of Betelgeuse’s atmosphere is constantly churning with large-scale convective motions, similar to the movement of boiling water, that transport heat throughout the star. MacLeod’s team modeled an unusually hot plume of gas that broke free from the star’s surface, powering the surface mass ejection that caused the dimming. When this hot gas plume rose, it could have interrupted Betelgeuse’s typical pulsations, energizing a new pulsation mode that cycles twice as quickly.

If this process is responsible for the change in Betelgeuse’s behavior, the new pulsation mode will eventually lose energy and fade away: MacLeod and collaborators predict that the star should return to its previous 400-day pulsation period within 5–10 years.

Was Betelgeuse Once Two Stars?

Most massive stars grow up with a nearby binary companion, and at some point in their lives these stars may transfer mass back and forth. A recent research article takes this concept of mass transfer to the extreme, exploring whether Betelgeuse engulfed its binary companion, fundamentally altering the course of its evolution.

plot of simulation output showing the evolution of the surface velocity and abundance of carbon, oxygen, and nitrogen

Results of stellar evolution simulations showing how the surface velocity and nitrogen, oxygen, and carbon abundances change with time. The black boxes indicate the values of these quantities when the modeled stars have similar temperatures and luminosities to present-day Betelgeuse. Click to enlarge. [Shiber et al. 2024]

Sagiv Shiber (Louisiana State University) and collaborators used three-dimensional hydrodynamics simulations to study the outcome of a merger between a 16-solar-mass star nearing the end of its hydrogen-burning lifetime and a 4-solar-mass main-sequence companion. The merger of stars with very different masses is thought to produce a red supergiant, like Betelgeuse, rather than a blue supergiant, which the merger of stars with similar masses might create. The models follow the smaller star as it’s swallowed by the larger star, spirals inward, and merges with the larger star’s core, ejecting roughly 0.6 solar mass of material in the process.

After allowing the merger product to evolve until its temperature and luminosity were similar to Betelgeuse’s, Shiber’s team calculated the surface composition and rotation rate of the resulting star, since these quantities are potentially measurable. Post-merger stars appear to have more nitrogen at their surface than stars that have evolved normally, and they may rotate more rapidly than typical stars, as well. Observations suggest that Betelgeuse is both rapidly rotating and rich in nitrogen, supporting the hypothesis that it was once two stars.

Is Betelgeuse Actually Rotating Rapidly?

If Betelgeuse is a mashup of two stars, simulations suggest that it should be rotating rapidly. Several years ago, researchers studied Betelgeuse with the Atacama Large Millimeter/submillimeter Array (ALMA) and interpreted the observations to mean that the star was rotating at a rate of 5 kilometers per second — twice the pace expected for a single star. A team led by Jing-Ze Ma (马竟泽) from the Max Planck Institute for Astrophysics investigated this critical piece of evidence by testing whether large-scale convection — the roiling motion that causes material to rise and sink within a star, helping to transport heat from the star’s interior to its surface — could be mistaken for rapid stellar rotation.

intensity and radial velocity for a simulated star, simulated ALMA observations, and actual ALMA observations

The intensity (top row) and radial velocity (bottom row) for a simulated star, simulated ALMA observations, and actual ALMA observations. Click to enlarge. [Ma et al. 2024]

The team performed three-dimensional simulations of red supergiant stars that are not rotating, and processed the output to mimic what ALMA would see if looking at these stars. Ultimately, Ma and coauthors found that ALMA data can be misleading, with a 90% chance of large-scale convective motions being misinterpreted as stellar rotation at a rate of 2 kilometers per second or faster.

As always, researchers need more data to investigate this issue further. One or more ALMA observations could clarify whether Betelgeuse is truly rotating rapidly, supporting the hypothesis that it’s the result of a stellar merger, or if the star’s massive convective motions have been misleading.

Citation

“Left Ringing: Betelgeuse Illuminates the Connection Between Convective Outbursts, Mode Switching, and Mass Ejection in Red Supergiants,” Morgan MacLeod et al 2023 ApJ 956 27. doi:10.3847/1538-4357/aced4b

“Betelgeuse as a Merger of a Massive Star with a Companion,” Sagiv Shiber et al 2024 ApJ 962 168. doi:10.3847/1538-4357/ad0e0a

“Is Betelgeuse Really Rotating? Synthetic ALMA Observations of Large-Scale Convection in 3D Simulations of Red Supergiants,” Jing-Ze Ma et al 2024 ApJL 962 L36. doi:10.3847/2041-8213/ad24fd

cartoon showing different types of exoplanets

Exoplanet K2-18b made headlines when researchers reported that JWST observations of the planet were consistent with a habitable ocean world. Now, another team has published a different interpretation of the data, suggesting that the purported water world is instead a gas-rich planet with no habitable surface.

Everybody Wants to Rule the Find a Habitable World

An artist's impression of K2-18b as an ocean world

An artist’s impression of K2-18b as an ocean world. [NASA, ESA, CSA, Joseph Olmsted (STScI)]

The small, cool star K2-18 is home to two planets, one of which has garnered plenty of attention in the decade since its discovery. Recently, JWST data of K2-18b, an 8.6-Earth-mass planet, revealed the presence of atmospheric carbon dioxide and methane. Some researchers have interpreted these data, coupled with the non-detection of ammonia, water, and carbon monoxide, to mean that K2-18b is a Hycean world: a rocky planet covered in oceans.

To make matters more interesting, the same research team reported weak evidence for dimethyl sulfide, a compound that on Earth forms almost exclusively due to life. This led many onlookers to the eyebrow-raising conclusion that K2-18b is not just habitable but inhabited.

These intriguing interpretations, however, are far from settled. Is K2-18b truly a habitable ocean world, or could alternative explanations fit the JWST data equally well?

simulation of the atmosphere of K2-18b as a gas-rich planet without a habitable surface

Example simulation output for K2-18b as a gas-rich planet without a habitable surface. Click to enlarge. [Wogan et al. 2024]

Water World or Gas Planet?

A team led by Nicholas Wogan (NASA Ames Research Center and University of Washington) tackled this question by applying two sets of models to the JWST data. The first set describes rocky planets with surface oceans, with and without life, and the second set describes gaseous planets without a surface and without life. The models predict the planet’s photochemistry — chemical reactions in the atmosphere driven by photons from the host star — and climate.

Wogan’s team found that K2-18b is unlikely to be a lifeless water world, since this type of planet wouldn’t contain enough methane in its atmosphere to produce the signal seen in the JWST observations. Intriguingly, a water world with microbial life is more promising: acetotrophic methanotrophs — a tongue-twisting name for simple methane-producing organisms — may be able to produce the supply of methane seen in the planet’s atmosphere.

Not So Fast…

simulated spectra of K2-18b as an ocean world with and without life and as a gas-rich planet

JWST transmission spectra (black and gray points with error bars) and modeled spectra for K2-18b as a lifeless ocean world (top left), an ocean world with life (bottom left), and a lifeless gas-rich planet (bottom right). Click to enlarge. [Wogan et al. 2024]

As exciting as this sounds, Wogan and collaborators found that the uninhabitable gas-rich exoplanet model fits the JWST data equally well, and this model may pose fewer problems. Not only does the ocean-world model require life to explain its atmospheric composition, it’s also hard to reconcile the necessary cool surface temperature with the high likelihood of the planet experiencing a runaway greenhouse effect.

This isn’t the last word on K2-18b — there are features in the planet’s spectrum that aren’t well fit by a lively ocean world or a lifeless gas-rich planet, and both models have their challenges. Future data from JWST might dredge up a detection of ammonia, which would point to a gaseous planet, or dimethyl sulfide, which would tilt the scales considerably toward an inhabited water world. In the meantime, the hunt for habitable planets goes on.

Citation

“JWST Observations of K2-18b Can Be Explained by a Gas-Rich Mini-Neptune with No Habitable Surface,” Nicholas F. Wogan et al 2024 ApJL 963 L7. doi:10.3847/2041-8213/ad2616

Hubble Space Telescope image of a dwarf starburst galaxy

Researchers have spotted an unusual pair of interacting dwarf galaxies: one with many bright young stars, the other with none. New research examines how two seemingly similar galaxies can have such different outcomes, shedding light on why quiescent dwarf galaxies are so rare.

A Clash of Small Galaxies

photograph of the dwarf galaxies UGS 5205 and PGC 027864

A visible-light and infrared view of UGC 5205 (left) and PGC 027864 (right). [Adapted from Kado-Fong et al. 2024]

Dwarf galaxies contain anywhere from a thousand to a billion stars, making them far smaller than galaxies like the Milky Way. Despite their small size, dwarf galaxies are the sites of abundant star formation: aside from the unlucky galaxies that have had their star-forming gas stripped away by a larger galaxy, 99% of dwarf galaxies in the field are actively forming new stars. Researchers suspect that this statistic has something to do with collisions, which quench star formation in massive galaxies but appear to trigger it in dwarf galaxies.

Enter UGC 5205 and PGC 027864, a pair of dwarf galaxies that have responded in remarkably different ways to their interaction. PGC 027864 is a typical dwarf starburst galaxy ablaze with new stars, but UGC 5205 is eerily quiet. Previous observations show that the two nearly equal-mass galaxies each contain abundant star-forming gas, making UGC 5205’s lack of new stars a real mystery. Now, new data have solved the mystery of the missing star formation.

optical and radio observations of quiescent dwarf galaxy UGC 5205 and its starbursting companion, PGC 027864

Contours from the new Very Large Array data showing the location of neutral hydrogen gas (green) overlaid on a grayscale optical image. [Kado-Fong et al. 2024]

A Close Look at Cold Gas

Erin Kado-Fong (Yale University) and collaborators collected new observations of the interacting galaxy pair with the radio dishes of the Very Large Array. These new high-resolution observations show that while UGC 5205 contains an adequate amount of star-forming fuel, most of it has been expelled from the main body of the galaxy into three tidal structures. PGC 027864’s gas, on the other hand, looks mostly normal, with just a small tidal tail. While the reason for the different behavior isn’t clear — perhaps PGC 027864’s gas was more concentrated — this shows that UGC 5205’s star-formation shutdown is due to a lack of neutral hydrogen gas.

How long ago did this rare quiescent dwarf galaxy’s star formation shut down? Optical and ultraviolet images of the galaxy pair show that though UGC 5205 shines brightly in the ultraviolet, indicating abundant star formation on the order of 100 million years ago, it’s invisible at optical wavelengths that trace star formation in the past 10 million years. By modeling the light emitted by different populations of stars, Kado-Fong’s team found that UGC 5205 likely underwent a quenching event 100–300 million years ago.

Quiescent for Now

plot of the star formation rate and mass of this study's quiescent dwarf galaxy and starbursting dwarf galaxy compared to galaxies on the star-forming main sequence

The star formation rates and masses of the two galaxies in this study compared to low-mass galaxies on the star-forming main sequence. The two galaxies have similar rates measured from ultraviolet (UV) light, which traces star formation on the order of 100 million years ago, but dramatically different rates measured from Hα, which traces star formation in the last 10 million years. [Kado-Fong et al. 2024]

This work shows that interactions between dwarf galaxies can cause quiescence as well as star formation. But if starbursting dwarf galaxies are created through collisions, and it’s possible to make quiescent dwarf galaxies this way, why are quiescent dwarfs so rare? Kado-Fong and collaborators explained that this type of quenching is probably only temporary: UGC 5205’s expelled star-forming gas is likely still gravitationally bound to the galaxy, and it will eventually fall back toward the galaxy and trigger star formation. The team estimates that UGC 5205 will spend no more than 560 million years in a quenched state before returning to a normal star-forming state.

Citation

“Dwarf–Dwarf Interactions Can Both Trigger and Quench Star Formation,” Erin Kado-Fong et al 2024 ApJ 963 37. doi:10.3847/1538-4357/ad18cb

1 23 24 25 26 27 119