For those of us in the Northern Hemisphere, the winter solstice is rapidly approaching — so today, let’s make up for the lack of sunshine by basking in the warmth of some solar physics research! This instance of the Monthly Roundup gives a quick overview of four recent research articles that share new findings from our home star.
Tracing Threads in a Solar Prominence
Prominences are massive arcs of cool, dense plasma that appear high above the solar surface along the edge of the Sun’s disk. (These same features, when seen on the Sun’s disk rather than silhouetted against space, are called filaments.) Occasionally, prominences erupt in massive explosions that eject solar plasma into the solar system. Other times, they gently dissipate after weeks or months.
The advent of high-resolution solar imaging has revealed new features in solar prominences, including threads that are 3,500–28,000 kilometers long and just 210 kilometers wide. These threads are thought to form when magnetic flux tubes become filled with cool and dense plasma. Recently, Yuxiang Song (Chinese Academy of Sciences; University of Science and Technology of China) and collaborators used the New Vacuum Solar Telescope to examine the behavior of 35 threads in a solar prominence.
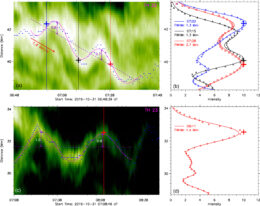
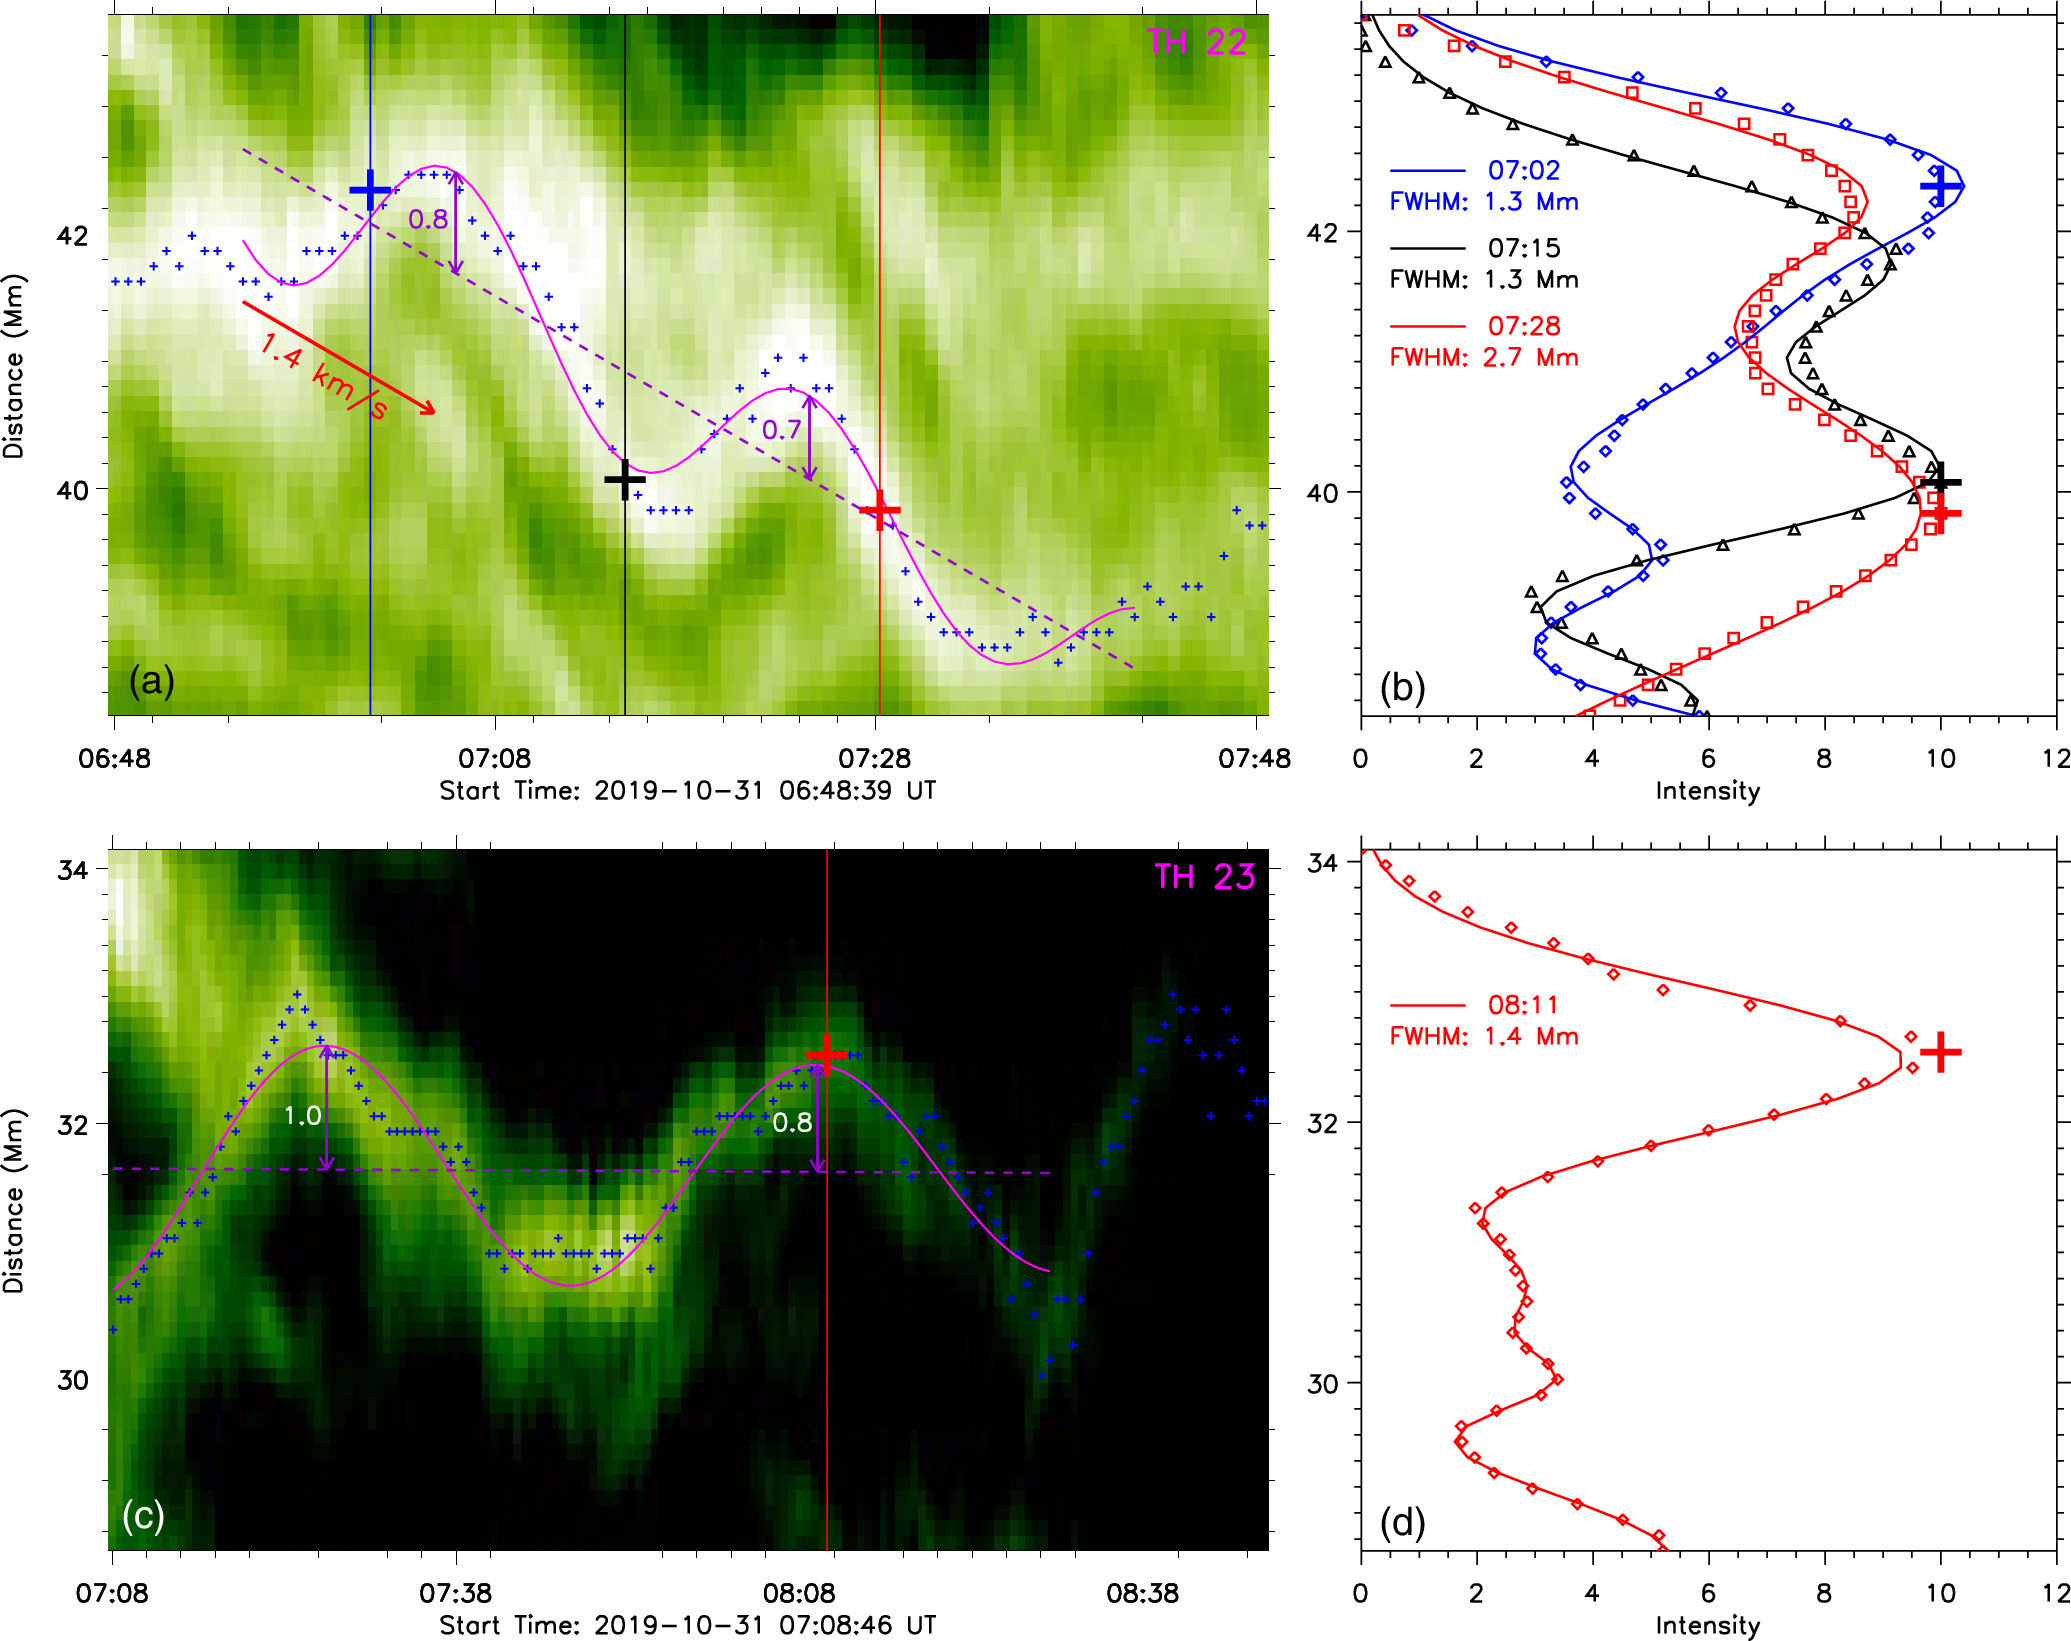
Example of a displacement oscillation (top row) and an intensity oscillation (bottom row) in a solar prominence thread. Click to enlarge. [Song et al. 2024]
They found that 29 of the 35 threads exhibited displacement oscillations, meaning that the threads wiggled around in a sinusoidal way. The average period of these spatial oscillations was 26 minutes. Eight of the 35 threads showed intensity oscillations; their brightness varied with a typical period of 7.7 minutes. Seven of the threads showed both displacement and intensity oscillations. These values are consistent with observations of threads in other solar prominences.
What causes the displacement and intensity oscillations in the threads? The thread oscillations appear to originate with oscillations deeper in the Sun’s atmosphere, which propagate outward and excite waves in the solar magnetic field. The waves, in turn, generate the oscillations in the threads. However, the authors raised the possibility that the two types of oscillations examined in this work have different causes. Future work is needed to disentangle the question of solar threads.
Studying the Sun from the Moon
Gone are the days when astronomers could observe the Sun only from Earth’s surface. Now, a spacecraft fleet scrutinizes the Sun from almost every angle. Among the spacecraft with an eye on the Sun is Chang’E-2: a lunar orbiter that carries an instrument called the Solar X-ray Monitor
A team led by Man-Hei Ng and Chi-Long Tang (Macau University of Science and Technology and China National Space Administration) used data from the Solar X-ray Monitor to study conditions in solar flares emerging from two active regions on the Sun. Solar flares are brief, brilliant flashes of light that are powered by the rearrangement of solar magnetic fields. Ng and Tang’s team aimed to determine which elements and ions were present in these solar flares. These data give clues as to how matter and energy are transported from the lower, denser regions of the Sun’s atmosphere to the superheated solar corona and beyond.
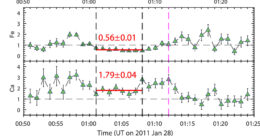
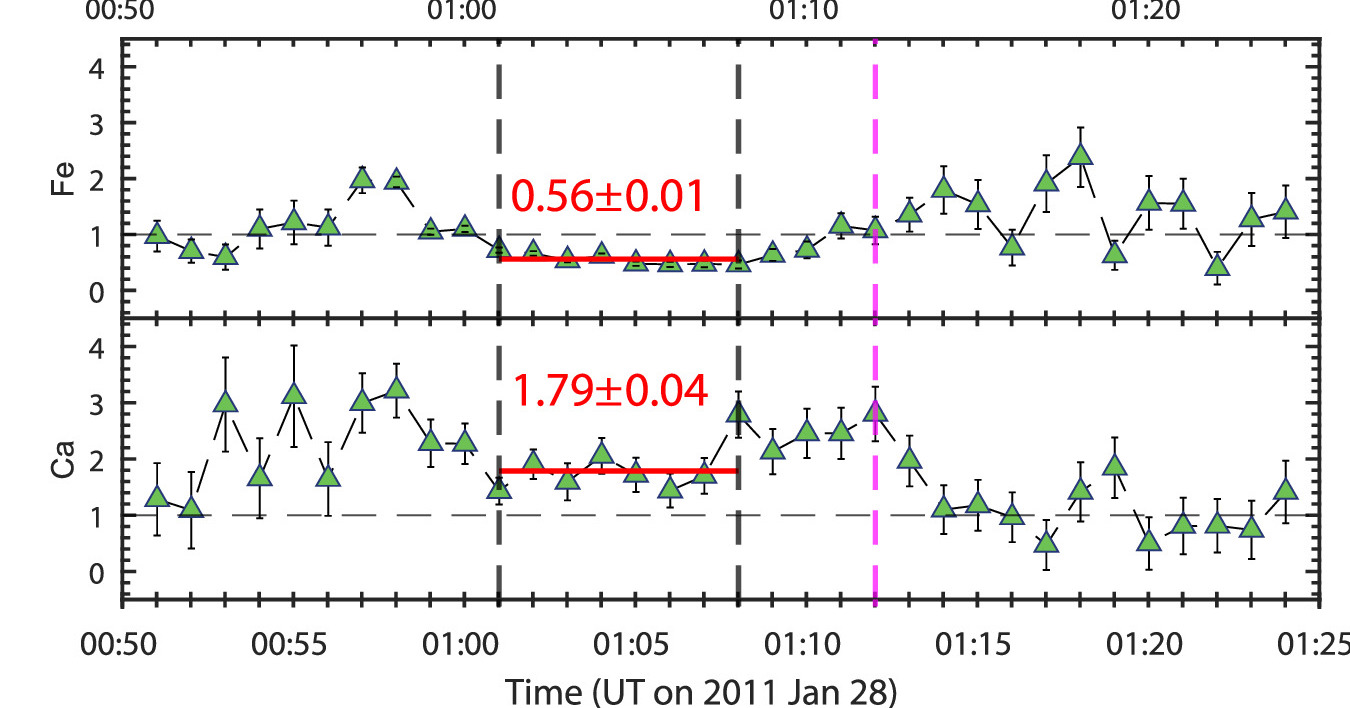
Examples of elements experiencing the inverse first ionization potential effect (iron; top) and the first ionization potential effect (calcium; bottom). The plots show the ratio of the measured elemental abundance with respect to the abundance of that element within the solar photosphere. Click to enlarge. [Adapted from Ng et al. 2024]
Previous research has shown that elements that require relatively little energy (<10 electronvolts) to ionize and elements that require a relatively large amount of energy to ionize behave differently. Generally, easily ionized elements are more prevalent in flaring regions than at the denser, cooler solar surface. This effect is called the
first ionization potential effect. This behavior sometimes flips in regions where the solar magnetic field is especially complicated; the reversed behavior is called the
inverse first ionization potential effect.
In this study, Ng and Tang’s team observed the inverse first ionization potential effect in iron for the first time, and they confirmed the existence of this effect for silicon. They also noted another curious effect for the first time: heavy elements like iron took longer to return to their pre-flare levels than lighter elements did, showing that inertia plays an important role. Intriguingly, one of the solar flares showed yet another rare effect: a post-flare change in the elemental abundances from values typical of the solar corona to those more similar to deeper layers of the Sun’s atmosphere, suggesting that this plasma was sourced from below, in the chromosphere or photosphere.
High-Resolution Imaging of a Solar Current Sheet
Many of the explosive events that take place in the Sun’s atmosphere owe their existence to magnetic reconnection: the process of rearranging magnetic fields in a way that releases pent-up magnetic energy, providing a way to accelerate particles to high speeds. Pankaj Kumar (American University; NASA Goddard Space Flight Center) and coauthors recently reported on high-resolution solar images that reveal this process in great detail.
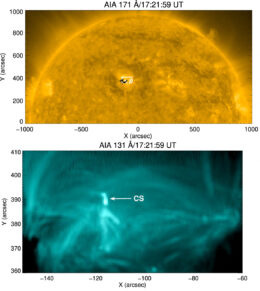
Top: A broad view of the Sun, including the active region studied in this work, indicated in white. Bottom: A zoomed-in view of the active region, showing the location of the current sheet (CS). [Adapted from Kumar et al. 2024]
The images, which come from the Solar Dynamics Observatory spacecraft and the 1.6-meter Goode Solar Telescope, have an incredible resolution of just 50 kilometers. They show a current sheet — a surface that separates regions of oppositely directed magnetic fields, such as those found in active regions on the Sun. (Active regions are areas on the Sun’s surface where the magnetic field is particularly strong and complex; these regions are the sites of solar activity like solar flares.) While short-lived current sheets have been seen before, this study marks the first time a current sheet has been directly imaged over such a long duration; the current sheet in this study persisted for about 20 hours and covered an area of roughly 2 arcseconds by 6 arcseconds.
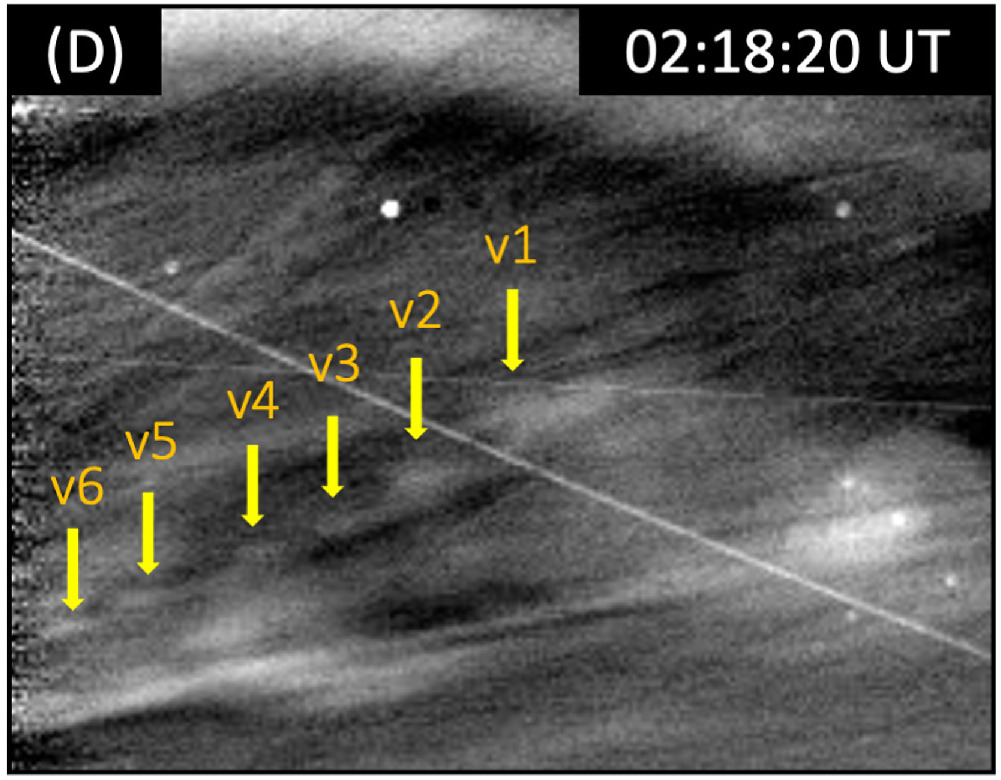
Kumar’s team observed plasma flowing out from and in toward the current sheet at semi-regular intervals. These quasi-periodic flows provide evidence of particle acceleration via magnetic reconnection and show that reconnection helps to heat the active region plasma. Overall, the observations presented in this work provide evidence for the magnetic breakout model, a widely used model of solar eruptive events like flares and coronal mass ejections. The breakout model describes how magnetic field lines enclosing the dense plasma of a solar filament/prominence reconfigure and release the filament into space.
In addition to providing support for the breakout model, the new observations can serve as a jumping-off point for modeling and laboratory studies of magnetic reconnection. The results of this study even have implications for stars other than the Sun, helping to explain the quasi-periodic pulsations seen at X-ray wavelengths on other stars.
The Sun as a Particle Accelerator
Solar flares and coronal mass ejections — immense eruptions of solar plasma and magnetic fields — are the sites of particle acceleration and X-ray production. Understanding how much of the energy produced in the events goes toward accelerating electrons to breakneck speeds is critical to understanding the Sun’s role as a particle accelerator.
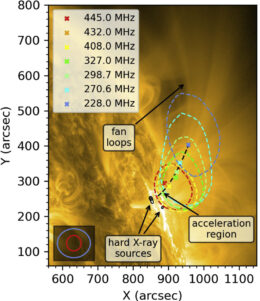
A 17.1-nanometer image of the Sun from the Solar Dynamics Observatory. The annotations indicate the locations of the acceleration region, the hard (i.e., high-energy) X-ray sources, and the radio emission at various frequencies. Click to enlarge. [Adapted from James & Reid 2024]
Working toward this goal,
Alexander James and
Hamish Reid (University College London) analyzed data from a solar radio burst that took place in 2013. Solar radio bursts are brief periods of intense radio emission that are caused by fast-moving electrons and often accompany coronal mass ejections or solar flares. This particular burst was associated with a solar flare and a coronal mass ejection.
Using multi-wavelength observations of the flare, coronal mass ejection, and solar radio burst, James and Reid estimated the speeds of the electron beams they observed escaping from the acceleration site. This analysis showed extremely high speeds for electrons in the beams, ranging from 44% to 59% of the speed of light. The team then used simulations to learn about the properties of the region in which these beams were accelerated, finding that the acceleration occurred in a region that stretched some 15,000–100,000 kilometers in the direction tangent to the Sun’s surface, but just 1,000 kilometers vertically.
This work marks the first time researchers have estimated the properties of escaping electron beams from remote-sensing observations. A comparison of the results from remote-sensing data and those from the Solar Orbiter spacecraft, which ventures close to the Sun every 6 months, will provide further insight into the particle-accelerating abilities of our home star.
Citation
“Thread Displacement and Intensity Oscillations in a Quiescent Prominence,” Yuxiang Song et al 2024 ApJ 975 280. doi:10.3847/1538-4357/ad813c
“Unveiling Mass Transfer in Solar Flares: Insights from Elemental Abundance Evolutions Observed by Chang’E-2 Solar X-Ray Monitor,” Man-Hei Ng et al 2024 ApJ 972 123. doi:10.3847/1538-4357/ad5da3
“Direct Imaging of a Prolonged Plasma/Current Sheet and Quasiperiodic Magnetic Reconnection on the Sun,” Pankaj Kumar et al 2024 ApJ 973 74. doi:10.3847/1538-4357/ad63a2
“Estimating the Total Energy Content in Escaping Accelerated Solar Electron Beams,” Alexander W. James and Hamish A. S. Reid 2024 ApJ 976 128. doi:10.3847/1538-4357/ad7b38


 a Mini-Moon")