Features RSS

Spiral arms

Young, forming planets can generate immense spiral structures within their protoplanetary disks. A recent study has shown that observations of these spiral structures may allow astronomers to measure the mass of the planets that create them.

Spirals From Waves

disk simulations

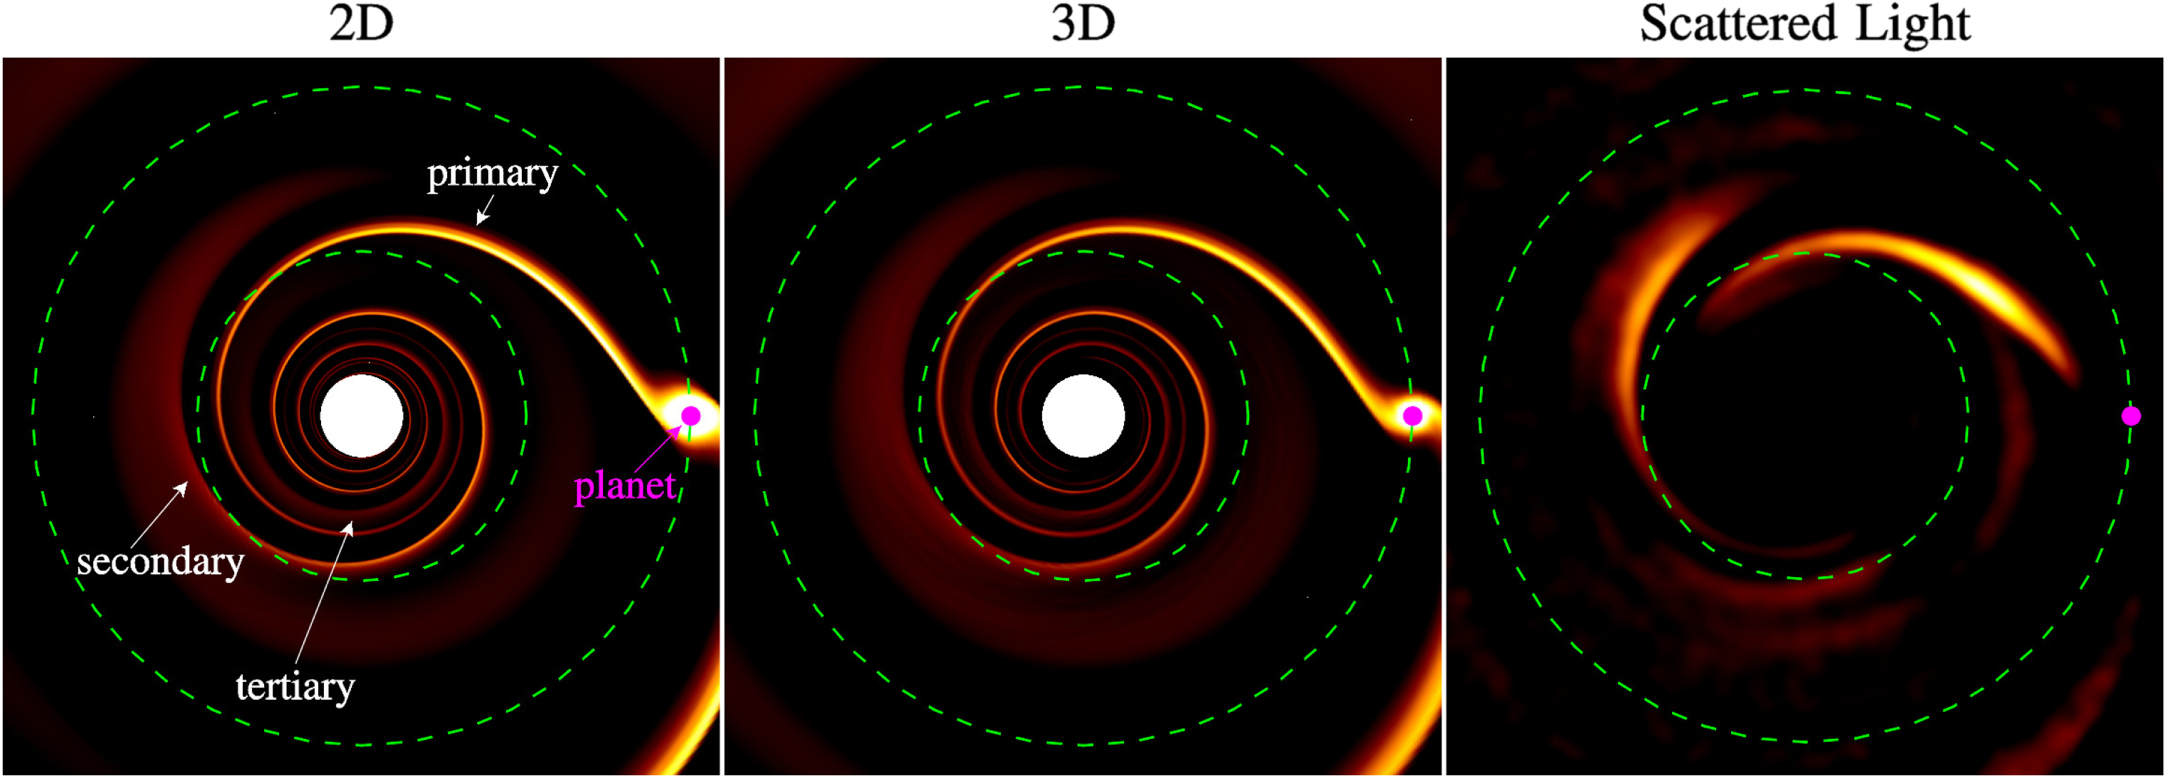
Snapshots of the surface density of a protoplanetary disk in a 2D simulation, 3D simulation, and synthesized scattered-light image. Click for a closer look! [Fung & Dong, 2015]

Recent studies have shown that a single planet, if it is massive enough, can excite multiple density waves within a protoplanetary disk as it orbits. These density waves can then interfere to produce a multiple-armed spiral structure in the disk inside of the planet’s orbit — a structure which can potentially be observed in scattered-light images of the disk.

But what do these arms look like, and what factors determine their structure? In a recently published study, Jeffrey Fung and Ruobing Dong, two researchers at the University of California at Berkeley, have modeled the spiral arms in an effort to answer these questions.

Arms Provide Answers

A useful parameter for describing the structure is the azimuthal separation (φsep) between the primary and secondary spiral arms. If you draw a circle within the disk and measure the angle between the two points where the primary and secondary arms cross it, that’s φsep.

scaling relation

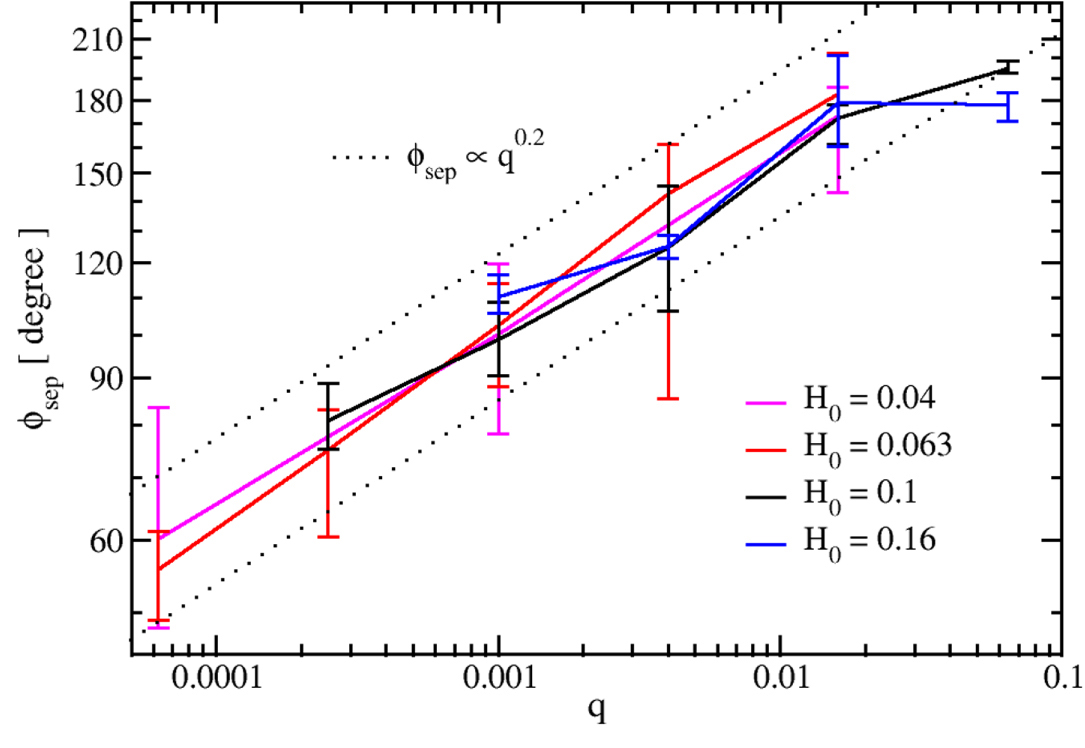
Azimuthal separation of the primary and secondary spiral arms, as a function of the planet-to-star mass ratio q. The different curves represent different disk aspect ratios. [Fung & Dong, 2015]

The authors find that φsep stays roughly constant for different radii, but it’s strongly dependent on the planet’s mass: for larger planets, φsep increases. They discover that φsep scales as a power of the planet mass for companions between Neptune mass and 16 Jupiter masses, orbiting around a solar-mass star. For larger, brown-dwarf-size companions, φsep is a constant 180°.

If this new theory is confirmed, it could have very interesting implications for observations of protoplanetary disks: this would give us the ability to measure the mass of a planet in a disk without ever needing to directly observe the planet itself!

Modeling Observations

Fung and Dong confirm their models by additionally running 3D simulations, which yield very similar outcomes. From these simulation results, they then synthesize scattered-light images similar to what we would expect to be able to observe with telescopes like the VLT, Gemini, or Subaru. The authors demonstrate that from these scattered-light images, they can correctly retrieve the planet’s mass to within 30%.

Finally, as a proof-of-concept, the authors apply this modeling to an actual system: SAO 206462, a nearly face-on protoplanetary disk with an observed two-armed spiral within it. From the measured azimuthal separation of the two arms, the authors estimate that it contains a planet of about 6 Jupiter masses.

Citation

Jeffrey Fung (馮澤之) and Ruobing Dong (董若冰) 2015 ApJ 815 L21. doi:10.1088/2041-8205/815/2/L21
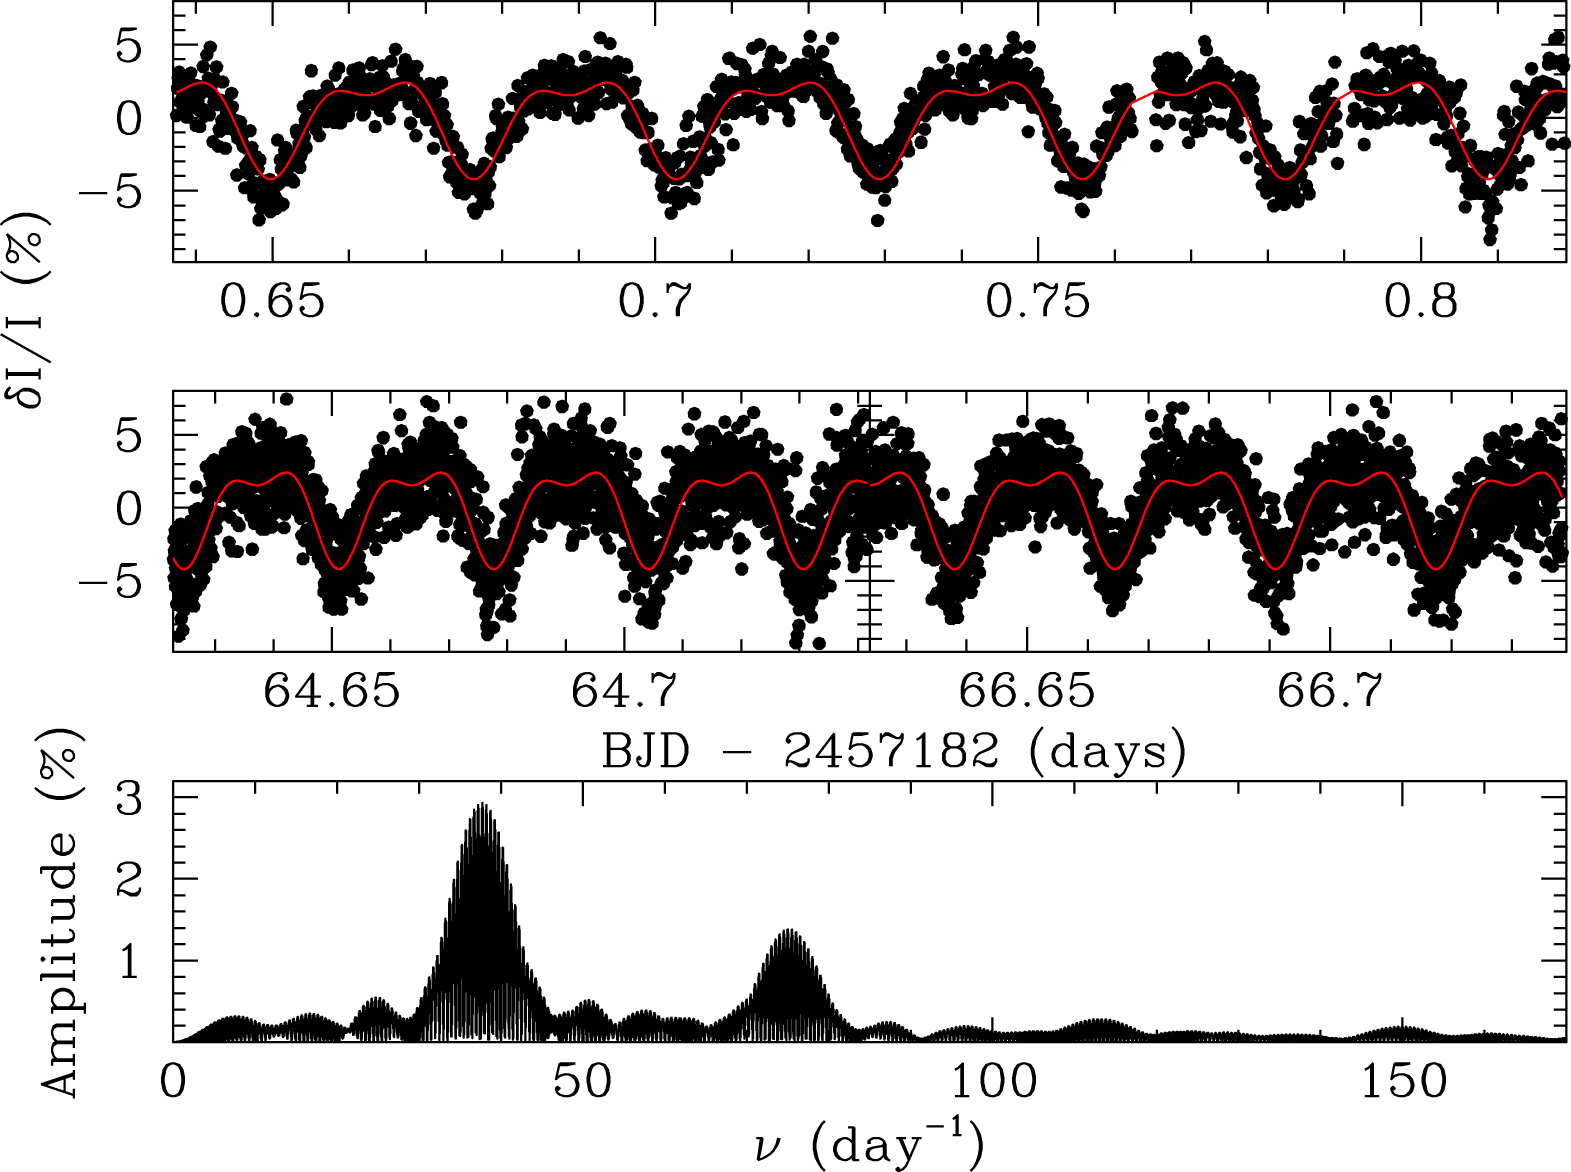
Leo P

Measurements of metal abundances in galaxies present a conundrum: compared to expectations, there are not nearly enough metals observed within galaxies. New observations of a nearby dwarf galaxy may help us understand where this enriched material went.

Removal Processes

Star formation is responsible for the build-up of metals (elements heavier than helium) in a galaxy. But when we use a galaxy’s star-formation history to estimate the amount of enriched material it should contain, our predictions are inconsistent with measured abundances: large galaxies contain only about 20–25% of the expected metals, and small dwarf galaxies contain as little as 1%!

So what happens to galaxies’ metals after they have been formed? The favored explanation is that metals are removed from galaxies via stellar feedback: stars that explode in violent supernovae can drive high-speed winds, expelling the enriched material from a galaxy. This process should be more efficient in low-mass galaxies due to their smaller gravitational wells, which would explain why low-mass galaxies have especially low metallicities.

But external processes may also contribute to the removal of metals, such as tidal stripping during interactions between galaxies. To determine the role of stellar feedback alone, an ideal test would be to observe an isolated low-mass, star-forming galaxy — i.e., one that is not affected by external processes.

Luckily, such an isolated, low-mass galaxy has recently been discovered just outside of the Local Group: Leo P, a gas-rich dwarf galaxy with a total stellar mass of 5.6 x 10⁵ solar masses.

Isolated Results

Dwarf abundances

Percentage of oxygen lost in Leo P compared to the percentage of metals lost in three other, similar-size dwarfs that are not isolated. If the gas-phase oxygen in Leo P were removed, Leo P’s measurements would be consistent with those of the other dwarfs. [McQuinn et al. 2015]

Led by Kristen McQuinn (University of Minnesota, University of Texas at Austin), a team of researchers has used Hubble observations to reconstruct Leo P’s star formation history. McQuinn and collaborators use this history to determine the dwarf galaxy’s total oxygen production — used as a tracer of its metal production — over its lifetime. They then compare this to the abundance of oxygen currently observed within Leo P.

In non-isolated dwarf-spheroidal galaxies of similar mass to Leo P, 99% of their expected metals are missing. In comparison, the authors find that Leo P is missing 95% of its expected metals. From these results, it seems that expulsion of enriched material by stellar feedback alone can explain most of the missing metals in such galaxies; external factors only remove an additional few percent.

This explanation is further supported by the fact that, of the oxygen remaining in Leo P, 25% is locked up in stars, whereas 75% is found to be in gas form in the galaxy’s interstellar medium. If this 75% were stripped away by external processes, Leo P’s measurements would become consistent with those of the non-isolated dwarf galaxies.

Citation

Kristen B. W. McQuinn et al 2015 ApJ 815 L17. doi:10.1088/2041-8205/815/2/L17

exoplanet atmosphere evaporation

What characteristics must a terrestrial planet exhibit to have the potential to host life? Orbiting within the habitable zone of its host star is certainly a good start, but there’s another important aspect: the planet has to have the right atmosphere. A recent study has determined how host stars can help their planets to lose initial, enormous gaseous envelopes and become more Earth-like.

Collecting An Envelope

When a terrestrial planet forms inside a gaseous protoplanetary disk, it can accumulate a significant envelope of hydrogen gas — causing the planet to bear more similarity to a mini-Neptune than to Earth. Before the planet can become habitable, it must shed this enormous, primordial hydrogen envelope, so that an appropriate secondary atmosphere can form.

So what determines whether a planet can get rid of its protoatmosphere? The dominant process for shedding a hydrogen atmosphere is thermal mass loss: as the planet’s upper atmosphere is heated by X-ray and extreme-ultraviolet (XUV) radiation from the host star, the envelope evaporates.

A Critical Dependence

In a recent study led by Colin Johnstone (University of Vienna), a team of scientists has developed models of this evaporation process for hydrogen planetary atmospheres. In particular, Johnstone and collaborators examine how the host star’s initial rotation rate — which strongly impacts the star’s level of XUV activity — affects the degree to which the planet’s hydrogen atmosphere is evaporated, and the rate at which the evaporation occurs.

The authors’ findings can be illustrated with the example of an Earth-mass planet located in the habitable zone of a solar-mass star. In this case, the authors find four interesting regimes (shown in the plot to the right):

  • Atmosphere evolution

    Evolution of the hydrogen protoatmosphere of an Earth-mass planet in the habitable zone of a solar-mass star. The four lettered cases describe different initial atmospheric masses. The three curves for each case describe the stellar rotation rate: slow (red), average (green), or fast (blue). [Johnstone et al. 2015]

    Case A
    (I
    nitial atmospheric mass of 10-4 Earth masses)
    Entire atmosphere evaporates quickly, regardless of the rotation speed of the host star.
  • Case B
    (I
    nitial atmospheric mass of 10-3 Earth masses)
    Entire atmosphere evaporates, but the timescale is much shorter if the stellar host is fast-rotating as opposed to slow-rotating.
  • Case C
    (Initial atmospheric mass of 10-2 Earth masses)

    If the stellar host is fast-rotating, entire atmosphere evaporates on a short timescale. If the host is slow-rotating, very little of the atmosphere evaporates.
  • Case D
    (Initial atmospheric mass of 10-1 Earth masses)

    Very little of the atmosphere evaporates, regardless of the rotation speed of the host star.

These results demonstrate that the initial rotation rate of a host star not only determines whether a planet will lose its protoatmosphere, but also how long this process will take. Thus, the evolution of host stars’ rotation rates is an important component in our understanding of how planets might evolve to become habitable.

Citation

C. P. Johnstone et al 2015 ApJ 815 L12. doi:10.1088/2041-8205/815/1/L12

Q2237+0305

What happens when light from a distant quasar — powered by a supermassive black hole — is bent not only by a foreground galaxy, but also by individual stars within that galaxy’s nucleus? The neighborhood of the central black hole can be magnified, and we get a close look at the inner regions of its accretion disk!

What is Microlensing?

Our view of Q2237+0305 is heavily affected by a process called gravitational lensing. As evidenced by the four copies of the quasar in the image above, Q2237+0305 undergoes macrolensing, wherein the gravity of a massive foreground galaxy pulls on the light of a background object, distorting the image into arcs or multiple copies.

But Q2237+0305 also undergoes an effect called microlensing. Due to the fortuitous alignment of Q2237+0305 with the nucleus of the foreground galaxy lensing it, stars within the foreground galaxy pass in front of the quasar images. As a star passes, its own gravitational pull also affects the light of the image, causing the image to brighten and/or magnify.

How can we tell the difference between intrinsic brightening of Q2237+0305 and brightening due to microlensing? Brightening that occurs in all four images of the quasar is intrinsic. But if the brightening occurs in only one image, it must be caused by microlensing of that image. The timescale of this effect, which depends on how quickly the foreground galaxy moves relative to the background quasar, is on the order of a few hundred days for Q2237+0305.

Resolving Structure

The light curve of a microlensed image can reveal information about the structure of the distant object. For this reason, a team of scientists led by Evencio Mediavilla (Institute of Astrophysics of the Canaries, University of La Laguna) has studied the light curves of three independent microlensing events of Q2237+0305 images.

double-peaked light curve

Average light curve of the three microlensing events near the peak brightness. The double-peaked structure may be due to light from the innermost region of the quasar’s accretion disk. [Mediavilla et al. 2015]

Mediavilla and collaborators find a two-peaked structure in the light curves. Modeling the data as a standard thin disk that has been lensed, the team shows that the light curve features are consistent with fine structure relatable to the region near the quasar’s central supermassive black hole. The authors find that the diameter of the fine structure is ~6 Schwarzschild radii, leading them to believe that this structure actually represents the innermost region of the accretion disk.

If the team’s models are correct, this represents the first direct measurement of the size of the innermost region of a quasar’s accretion disk. The authors encourage further monitoring of Q2237+0305: as stars within the dense foreground nucleus continue to pass in front of the quasar, many more microlensing events should be observable, allowing further analysis.

Citation

E. Mediavilla et al 2015 ApJ 814 L26. doi:10.1088/2041-8205/814/2/L26

Nessie

The recent discovery of a purported “bone” of the Milky Way, a dark cloud nicknamed “Nessie”, has provided us with new clues for mapping out the spiral structure of our galaxy. It turns out that Nessie may not be alone: a follow-up study has identified more bones, potentially making up a skeleton of the Milky Way that traces out the densest parts of its spiral arms.

Inconvenient Vantage Point

How many spiral arms does the Milky Way have? Where are they located? What does the structure look like between the arms? It may seem surprising that these fundamental questions don’t yet have clear answers. But because we’re stuck in the galaxy’s disk, we’re forced to piece together our understanding of the Milky Way’s structure based primarily on measurements of position and radial velocity of structures within the galactic plane.

The discovery of Nessie presents an intriguing new tool to identify the layout of the galaxy. Nessie is a very long, thin, infrared-dark filament that runs along the modeled position of the Scutum-Centaurus arm — and is believed therefore to trace the structure of the arm. In a new study led by Catherine Zucker (University of Virginia, Harvard-Smithsonian Center for Astrophysics), the authors have searched for additional bones like Nessie, hoping to use them to map out the skeleton of the Milky Way.

New Bones Discovered

p-v summary of bones

In this map of radial velocity vs. galactic longitude, the bone candidates are indicated by the numbered points. The colored lines indicate the positions of two of the galactic spiral arms, according to various models. Click for a closer look! [Zucker et al. 2015]

Zucker and collaborators began by using World Wide Telescope, a tool that facilitates visualization of multiple layers of data at a variety of scales, to search through Spitzer infrared data for additional structures like Nessie. Searching specifically along the predicted positions of galactic arms, they found 15 initial bone candidates.

Next, the team obtained radial-velocity data for the candidates from five separate radio surveys. Five of the candidates did not have radial velocities consistent with the galactic rotation curve at the predicted positions of the nearby arms.

Hope for a Skeleton

The authors used the remaining ten candidates to construct rough criteria for an object to be a Milky Way “bone”:

  1. Largely continuous mid-infrared extinction feature
  2. Parallel to the galactic plane, to within 30°
  3. Position within 20 pc of the galactic mid-plane
  4. Radial velocity within 10 km/s of the predicted velocity of a Milky Way arm
  5. No abrupt shifts in velocity within the extinction feature
  6. Projected aspect ratio of ≥50:1

Of the ten candidates, six meet all the criteria and are thought to mark the location of significant spiral features in the galaxy. The authors believe that this method may be used to identify hundreds of Milky Way bones in the future. Combining this skeleton with other tracers of galactic structure will ultimately help us to piece together a more accurate map of our galaxy.

Bonus

Check out this video, produced by the authors using World Wide Telescope, that shows the locations of the newly discovered bone candidates within Spitzer images of the Milky Way galactic plane. [Credit: Zucker et al. 2015]


Citation

Catherine Zucker et al 2015 ApJ 815 23. doi:10.1088/0004-637X/815/1/23

M-dwarf system

In an effort to learn more about how planets form around their host stars, a team of scientists has analyzed the population of Kepler-discovered exoplanet candidates, looking for trends in where they’re found.

Planetary Occurrence

Since its launch in 2009, Kepler has found thousands of candidate exoplanets around a variety of star types. Especially intriguing is the large population of “super-Earths” and “mini-Neptunes” — planets with masses between that of Earth and Neptune — that have short orbital periods. How did they come to exist so close to their host star? Did they form in situ, or migrate inwards, or some combination of both processes?

To constrain these formation mechanisms, a team of scientists led by Gijs Mulders (University of Arizona and NASA’s NExSS coalition) analyzed the population of Kepler planet candidates that have orbital periods between 2 and 50 days.

Mulders and collaborators used statistical reconstructions to find the average number of planets, within this orbital range, around each star in the Kepler field. They then determined how this planet occurrence rate changed for different spectral types — and therefore the masses — of the host stars: do low-mass M-dwarf stars host more or fewer planets than higher-mass, main-sequence F, G, or K stars?

Challenging Models

Planet radius distribution

Authors’ estimates for the occurrence rate for short-period planets of different radii around M-dwarfs (purple) and around F, G, and K-type stars (blue). [Mulders et al. 2015]

The team found that M dwarfs, compared to F, G, or K stars, host about half as many large planets with orbital periods of P < 50 days. But, surprisingly, they host significantly more small planets, racking up an average of 3.5 times the number of planets in the size range of 1–2.8 Earth-radii.

Could it be that M dwarfs have a lower total mass of planets, but that mass is distributed into more, smaller planets? Apparently not: the authors show that the mass of heavy elements trapped in short-orbital-period planets is higher for M dwarfs than for the larger F, G and K stars.

All of this goes contrary to expectation, because we know that protostellar disks, from which planets form, are more massive around larger-mass stars. So why is there more heavy-element mass trapped in planetary systems with low stellar mass?

This outcome isn’t predicted by either in situ or migration planet formation theories. The authors instead propose that the distribution could be explained if the inward drift of planetary building blocks — either dust grains or protoplanets — turns out to be more efficient around lower-mass stars.

Citation

Gijs D. Mulders et al 2015 ApJ 814 130. doi:10.1088/0004-637X/814/2/130

white dwarf

In the wake of the recent media attention over an enigmatic, dimming star, another intriguing object has been discovered: J1529+2928, a white dwarf that periodically dims. This mystery, however, may have a simple solution — with interesting consequences for future surveys of white dwarfs.

Unexpected Variability

J1529+2928 is an isolated white dwarf that appears to have a mass of slightly more than the Sun. But rather than radiating steadily, J1529+2928 dims once every 38 minutes — almost as though it were being eclipsed.

The team that discovered these variations, led by Mukremin Kilic (University of Oklahoma), used telescopes at the Apache Point Observatory and the McDonald Observatory to obtain follow-up photometric data of J1529+2928 spread across 66 days. The team also took spectra of the white dwarf with the Gemini North telescope.

Kilic and collaborators then began, one by one, to rule out possible causes of this object’s variability.

Eliminating Options

  • The period of the variability is too long for J1529+2928 to be a pulsating white dwarf with luminosity variation caused by gravity-wave pulsations.
  • The variability can’t be due to an eclipse by a stellar or brown-dwarf companion, because there isn’t any variation in J1529+2928’s radial velocity.
  • It’s not due to the orbit of a solid-body planetary object; such a transit would be too short to explain observations.
  • It can’t be due to the orbit of a disintegrated planet; this wouldn’t explain the light curves observed in different filters — plus the light curve doesn’t change over the 66-day span.

Spotty Surface

light curves

Top and middle two panels: light curves from three different nights observing J1529+2928’s periodic dimming. Bottom panel: The Fourier transform shows a peak at 37.7 cycles/day (and another, smaller peak at its first harmonic). [Kilic et al. 2015]

So what explanation is left? The authors suggest that J1529+2928’s variability is likely caused by a starspot on the white dwarf’s surface that rotates into and out of our view. Estimates show that the observed light curves could be created by a starspot at about 10,000K (compared to the white dwarf’s effective temperature of ~11,900K), covering 14% of the surface area at an inclination of 90°.

The formation of such a starspot would almost certainly require the presence of magnetic fields. Interestingly, J1529+2928 doesn’t have a strong magnetic field; from its spectra, the team can constrain its field strength to be less than 70 kG.

Given that up to 15% of white dwarfs are thought to have kG magnetic fields, eclipse-like events such as this one might in fact be common for white dwarfs. If so, then many similar events will likely be observed with future surveys of transients — like Kepler’s ongoing K2 mission, which is expected to image another several hundred white dwarfs, or the upcoming Large Synoptic Survey Telescope, which will image 13 million white dwarfs.

Citation

Mukremin Kilic et al 2015 ApJ 814 L31. doi:10.1088/2041-8205/814/2/L31

SDO solar observations

Looking for stars that “wobble” is one of the key ways by which we detect exoplanets: the gravitational pull of planets cause tiny variations in stars’ radial velocities. But our ability to detect Earth twins is currently limited by our ability to distinguish between radial-velocity variations caused by exoplanets, and those caused by noise from the star itself. A team of scientists has recently proposed that the key to solving this problem may be to examine our own star.

Precision Amid Noise

The radial-velocity technique works well for detecting large planets on close orbits, but detecting an Earth twin requires being able to detect star motion on the order of 10 cm/s! This precision is hard to reach, because activity on the stellar surface — i.e., sunspots, plages (bright spots), or granulation — can also cause variations in the measured radial velocity for the star, obscuring the signature of a planet.

Because the stars we’re examining aren’t resolved, we can’t track the activity on their surfaces — so how can we better understand the imprint that stellar activity has on radial-velocity measurements? A team of scientists has come up with a clever approach: examine the Sun as though it were a distant star.

Wealth of Information

The team, led by Xavier Dumusque (Branco-Weiss Fellow at the Harvard-Smithsonian Center for Astrophysics) and David F. Phillips (Harvard-Smithsonian Center for Astrophysics), has begun a project to observe the Sun with a ground-based solar telescope. The telescope observes the full disk of the Sun and feeds the data into the HARPS-N spectrograph in Spain, a spectrograph normally used for radial-velocity measurements of other stars in the hunt for exoplanets.

But the team has access to other data about the Sun, too: information from satellites like the Solar Dynamics Observatory and SORCE about the solar activity and total irradiance during the time when the spectra were taken. Dumusque and collaborators have combined all of this information, during a week-long test, to see if it’s possible to correct for radial-velocity perturbations due to sunspots and plages.

Reducing Variations

TSI and radial velocity

The total solar irradiance of the Sun (top panel) is correlated with the radial velocity variations measured for the Sun (bottom panel), due to the effects of surface inhomogeneities like sunspots and plages. [Dumusque et al. 2015]

By relating the total stellar irradiance (measured by SORCE) to the radial-velocity variation due to stellar noise, the team finds that — even with only a week of data — they’re already able to subtract off some of these effects. They reduce the radial-velocity variation by more than a factor of two, bringing it down to 60 cm/s.

After this initial success, the next step is to improve on this result with more extensive observations. The team plans to continue to monitor the Sun daily over the next two to three years, allowing them to further develop correction methods. They believe this will enable us to reach the precision needed to detect an Earth twin around another star.

Citation

Xavier Dumusque et al 2015 ApJ 814 L21. doi:10.1088/2041-8205/814/2/L21

NGFS

Theories of galaxy formation and evolution predict that there should be significantly more dwarf galaxies than have been observed. Are our theories wrong? Or are dwarf galaxies just difficult to detect? Recent results from a survey of a galaxy cluster 62 million light-years away suggest there may be lots of undiscovered dwarf galaxies hiding throughout the universe!

Hiding in Faintness

The “missing dwarf problem” has had hints of a resolution with the recent discovery of Ultra-Diffuse Galaxies (UDGs) in the Coma and Virgo galaxy clusters. UDGs have low masses and large radii, resulting in a very low surface brightness that makes them extremely difficult to detect. If many dwarfs are UDGs, this could well explain why we’ve been missing them!

But the Coma and Virgo galaxy clusters are similar in that they’re both very massive. Are there UDGs in other galaxy clusters as well? To answer this question, an international team of scientists is running the Next Generation Fornax Survey (NGFS), a survey searching for faint dwarf galaxies in the central 30 square degrees of the Fornax galaxy cluster.

The NGFS uses near-UV and optical observations from the Dark Energy Camera mounted on the 4m Blanco Telescope in Chile. The survey is still underway, but in a recent publication led by Roberto P. Muñoz (Institute of Astrophysics at the Pontifical Catholic University of Chile), the team has released an overview of the first results from only the central 3 square degrees of the NGFS field.

Surprising Detection

NGFS size-luminosity

Galaxy radii vs. their absolute i-band magnitudes, for the dwarfs found in NGFS as well as other stellar systems in the nearby universe. The NGFS dwarfs are similar to the ultra-diffuse dwarfs found in the Virgo and Coma clusters, but are several orders of magnitude fainter. [Muñoz et al. 2015]

In just this small central field, the team has found an astounding 284 low-surface-brightness dwarf galaxy candidates — 158 of them previously undetected. At the bright end of this sample are dwarf galaxies that resemble the UDGs found in Virgo and Coma clusters, verifying that such objects exist in environments beyond only massive clusters.

And at the faint end of the sample, the authors find additional extremely low-surface-brightness dwarfs that are several orders of magnitude fainter even than classical UDGs.

The authors describe the properties of these galaxies and compare them to systems like classical UDGs and dwarf spheroidal galaxies in our own Local Cluster. The next step is to determine which of the differences between the sample of NGFS dwarfs and previously known systems are explained by the environmental factors of their host cluster, and which are simply due to sample biases.

With much more data from the NGFS still to come, it seems likely that we will soon be able to examine an even larger sample of no-longer-missing dwarfs!

Citation

Roberto P. Muñoz et al 2015 ApJ 813 L15. doi:10.1088/2041-8205/813/1/L15

binary black hole

In June of this year, after nearly three decades of sleep, the black hole V404 Cygni woke up and began grumbling. Scientists across the globe scrambled to observe the sudden flaring activity coming from this previously peaceful black hole. And now we’re getting the first descriptions of what we’ve learned from V404 Cyg’s awakening!

Sudden Outburst

V404 Cyg is a black hole of roughly nine solar masses, and it’s in a binary system with a low-mass star. The black hole pulls a stream of gas from the star, which then spirals in around the black hole, forming an accretion disk. Sometimes the material simply accumulates in the disk — but every two or three decades, the build-up of gas suddenly rushes toward the black hole as if a dam were bursting.

The sudden accretion in these events causes outbursts of activity from the black hole, its flaring easily visible to us. The last time V404 Cyg exhibited such activity was in 1989, and it’s been rather quiet since then. Our telescopes are of course much more powerful and sensitive now, nearly three decades later — so when the black hole woke up and began flaring in June, scientists were delighted at the chance to observe it.

The high variability of V404 Cyg is evident in this example set of spectra, where time increases from the bottom panel to the top. [King et al. 2015]

The high variability of V404 Cyg is evident in this example set of spectra, where time increases from the bottom panel to the top. [King et al. 2015]

Led by Ashley King (Einstein Fellow at Stanford University), a team of scientists observed V404 Cyg with the Chandra X-ray Observatory, obtaining spectra of the black hole during its outbursts. The black hole flared so brightly during its activity that the team had to take precautions to protect the CCDs in their detector from radiation damage! Now the group has released the first results from their analysis.

Windy Disk

The primary surprise from V404 Cyg is its winds. Many stellar-mass black holes have outflows of mass, either in the form of directed jets emitted from their centers, or in the form of high-energy winds isotropically emitted from their accretion disks. But V404 Cyg’s winds — which the authors measure to be moving at a whopping ~4,000 km/s — appear to originate from much further out in the disk than what’s typical. Furthermore, the presence of disk winds and jets is normally anti-correlated, yet in V404 Cyg, both are active at the same time.

King and collaborators believe that the winds are likely associated with the disruption of the outer accretion disk due to pressure from the radiation in the central region as it becomes very luminous. V404 Cyg’s behavior is actually more similar to that of some supermassive black holes than to most stellar-mass black holes, which is extremely intriguing.

The authors are currently working to complete a more detailed analysis of the spectra and build a model of the processes occurring in this awakening black hole, but these initial results demonstrate that V404 Cyg has some interesting things to teach us.

Citation

Ashley L. King et al 2015 ApJ 813 L37. doi:10.1088/2041-8205/813/2/L37

1 107 108 109 110 111 114