
Editor’s note: Astrobites is a graduate-student-run organization that digests astrophysical literature for undergraduate students. As part of the partnership between the AAS and astrobites, we occasionally repost astrobites content here at AAS Nova. We hope you enjoy this post from astrobites; the original can be viewed at astrobites.org.
Title: A More Informative Map: Inverting Thermal Orbital Phase and Eclipse Lightcurves of Exoplanets
Authors: Emily Rauscher, Veenu Suri, Nicolas B. Cowan
First Author’s Institution: University of Michigan, Ann Arbor
Status: Submitted to AAS journals
During a recent visit to the Dutch National Maritime Museum I came across the world map from 1648 AD by cartographer John Blaeu. In addition to being the first world map of the Earth that adhered to the Copernican worldview, Blaeu’s map is an extremely detailed document of the knowledge of the world at the time sourced solely from the information gathered by explorers from their travels through ages to the far reaches of the world. Its errors and subjectivity to the western view of the world are quite amusing, but there is still a level of high detail and surprising accuracy in many places. Through these details, it is clear that cartographers must meticulously piece together information from a large number of sources of varying reliability. Creating maps of exoplanets, a practice beginning to be known as exocartography, is an equally challenging observational and mathematical problem that is addressed by today’s paper.
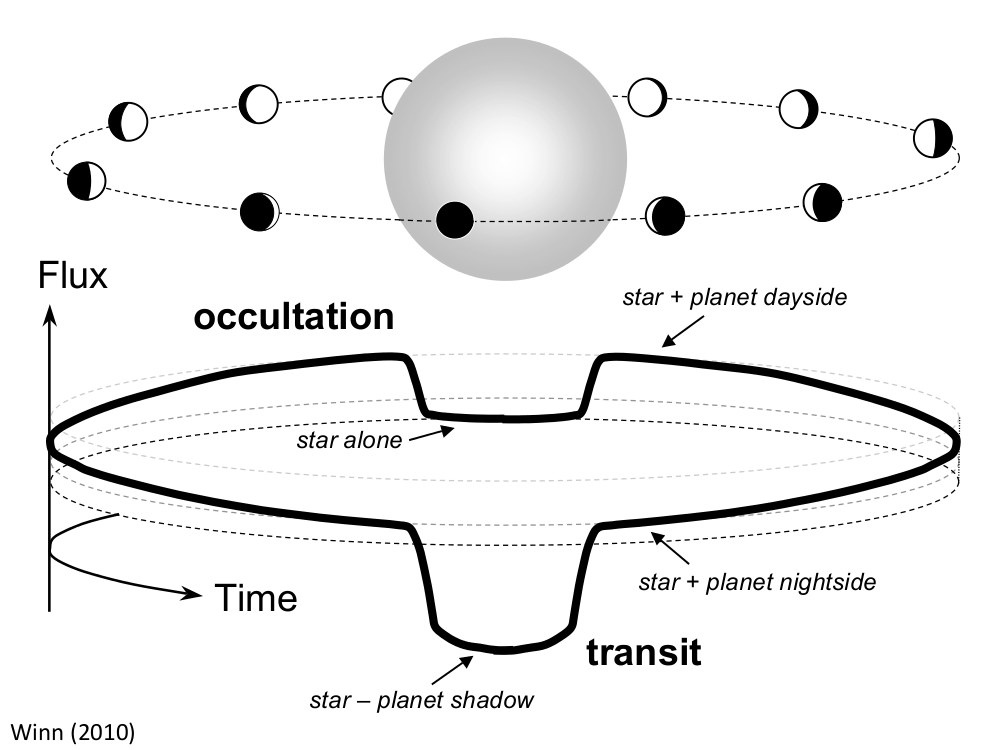
Figure 1: Schematic of transits and occultations (also referred to as secondary eclipse) in an exoplanetary system. [Winn 2010]
However, this technique can be sensitive to the choice of map structure and uncertainties in the orbital parameters of the system. As a result, it has only been reliably attempted for a few well-studied hot Jupiters — for example, HD189733 — and hot super-Earths to date. Today’s paper proposes a method that maximizes the information in the flux maps retrieved from phase curves and secondary eclipse observations, while also accounting for the effect of orbital parameter uncertainties.
A Closer Look at Exocartography
It may still be a few decades before we successfully send a spacecraft to get an up-close image of the nearest exoplanet. Till then, astronomers will mostly be busy extracting brightness maps of exoplanets from their high-precision photometric observations. Only phase-curve (i.e. not including the secondary eclipse) observations in this context are more sensitive to the longitudinal distribution of brightness, while most latitudinal information comes from the secondary eclipse. Considering the wavelength band in which these observations are taken, infrared phase curves like those obtained using Spitzer are more sensitive to the thermal emission from the planet, while shorter (optical) wavelengths usually probe the reflected light, which can be used to get an albedo map of the planet.
Once you have the phase-resolved or eclipse observations for a particular wavelength band, the first step in converting them to spatial flux maps of the planet conventionally involves assuming a 2D brightness map structure and fitting the observations with a disk-integrated flux-curve model (a function of the orbital phase) that has a one-to-one correspondence with the chosen map. But for a planet that could, in fact, have a very general distribution of spatial brightness, what’s the functional form for the 2D map you should choose to start with?
The best mathematical way to represent a signal with a general functional form is to decompose it into a linear combination of Fourier basis functions or basis maps. This choice is ideal because the Fourier basis functions are orthogonal, which makes them informatically independent of each other and prevents any scrambling of information when we use a linear combination of basis functions to represent a signal. In the case of brightness maps, which are essentially functions defined on the surface of a sphere, spherical harmonics play the role of the orthogonal basis functions, making them a good choice to represent the map structure for the planet’s brightness. Herein lies the key problem addressed by today’s paper: light curves corresponding to a set of orthogonal basis maps (like spherical harmonics) may not be orthogonal themselves, especially in the case of eclipse-only observations!
Orthogonalize!
The authors of today’s paper propose to use a principal component analysis (PCA) approach to orthogonalize the light curves (corresponding to spherical-harmonics maps for a chosen orbital realization) to get a set of eigen-lightcurves (or eigencurves), which can then be used to construct flux-curve models to fit the thermal phase curve, eclipse, or combined observations. Finding eigencurves in this context means getting the eigenvectors of a matrix composed of the initial set of light curves as column vectors, which is done by a simple linear transform of these light curves using the coefficients obtained from PCA. PCA essentially tries to determine the axes of variance and covariance in the input matrix of initial light curves. These axes, in the context of constructing the flux-curve model, are like independent lines of forces along which a linear combination of eigencurves acts to give the final model for the signal. Determining the eigencurves means determining these independent lines of forces.
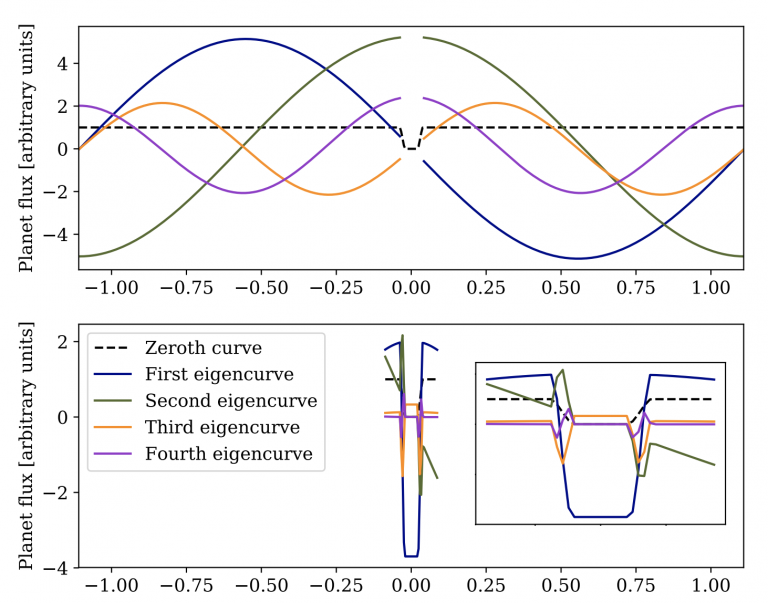
Figure 2: Time-varying eigencurves (horizontal axis showing time from the center of secondary eclipse in days). The first panel shows the case for the full orbit without secondary eclipse, and the second panel shows the eclipse-only case. [Rauscher et al. 2018]
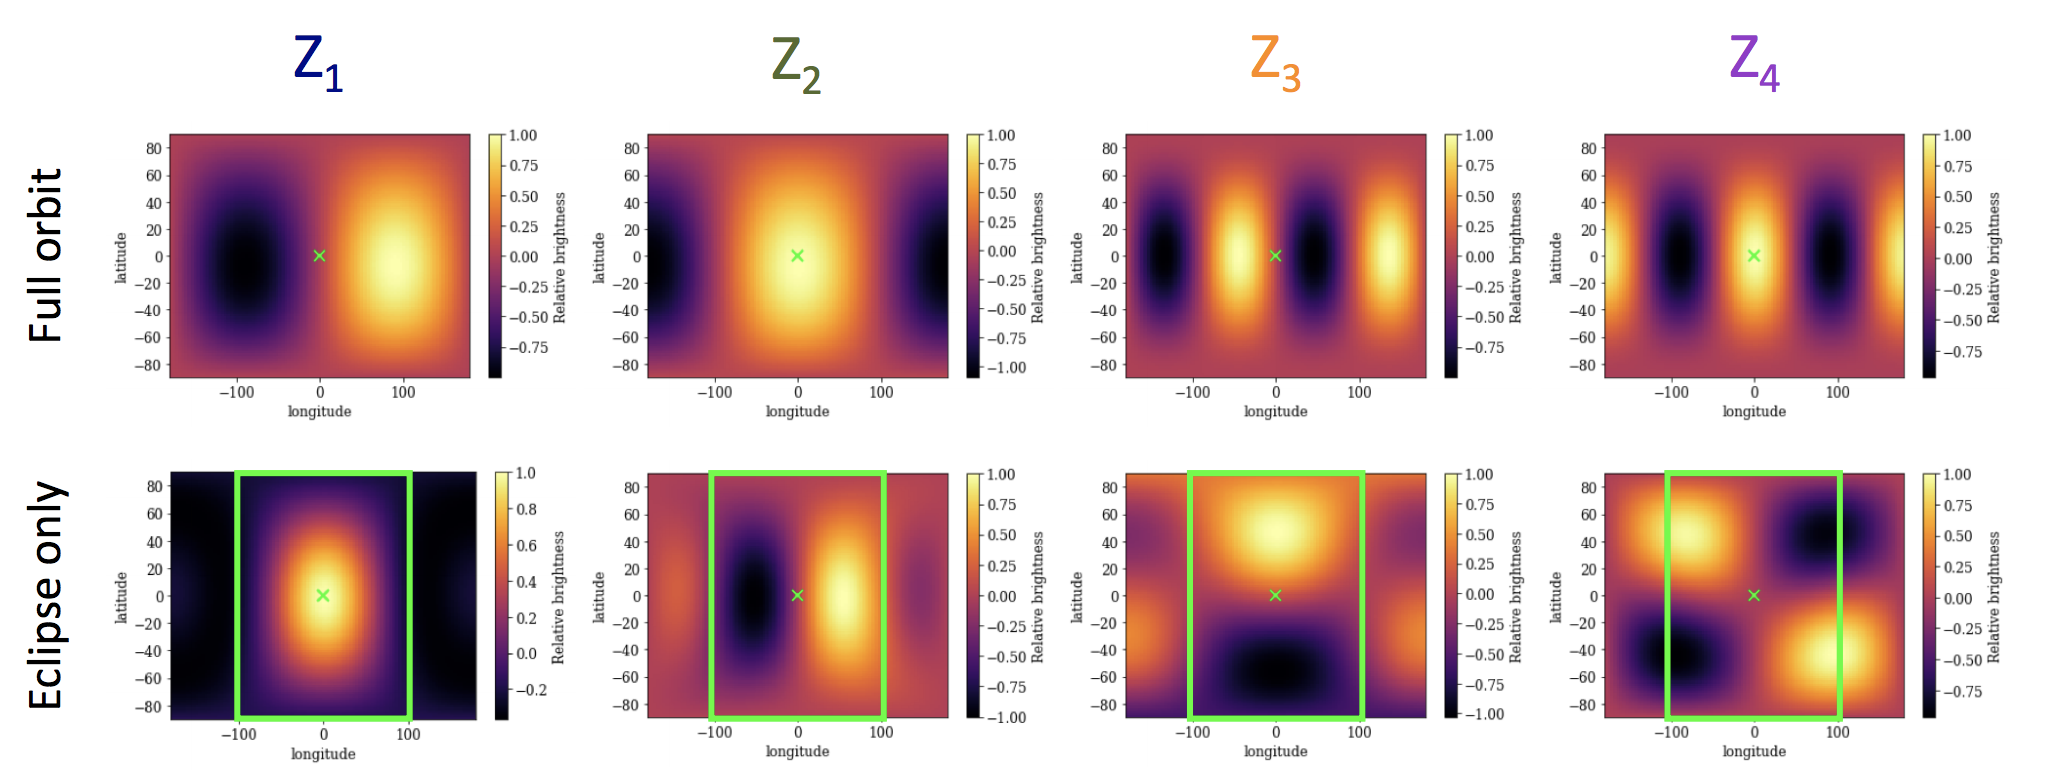
Figure 3: Spatially varying 2D eigenmaps for the two cases shown in Figure 2. ‘X’ in the bottom figure is the point permanently facing the star (assuming the planet to be tidally locked), and the green box in case of eclipse-only observation marks the range of longitudes probed by the observations. [Rauscher et al. 2018]
Usually, correlated noise in the detectors used for high-precision photometric observations are corrected for together with the fit for astrophysical parameters, which can lead to correlations creeping even in between the orthogonal light curves obtained from the PCA approach. This only calls for more caution when working with the high-quality mapping data which will be obtained from the James Webb Space Telescope in the future. With the planned high-precision photometric observations in multiple spectral bands by JWST, we can look forward to combining the horizontal 2D mapping as discussed in today’s paper with information about the vertical atmospheric structure, allowing us to get more reliable three-dimensional maps of exoplanets in the near future.
About the author, Vatsal Panwar:
I am a PhD student at the Anton Pannekoek Institute for Astronomy, University of Amsterdam. I work on characterization of exoplanet atmospheres to understand the diversity and origins of planetary systems. I also enjoy yoga, Lindyhop, and pushing my culinary boundaries every weekend.
2 Comments
Pingback:AAS Nova – New
Pingback:A Bare Hot Rock with No Atmosphere | astrobites