Featured Image: Mixing Chemicals in Stars
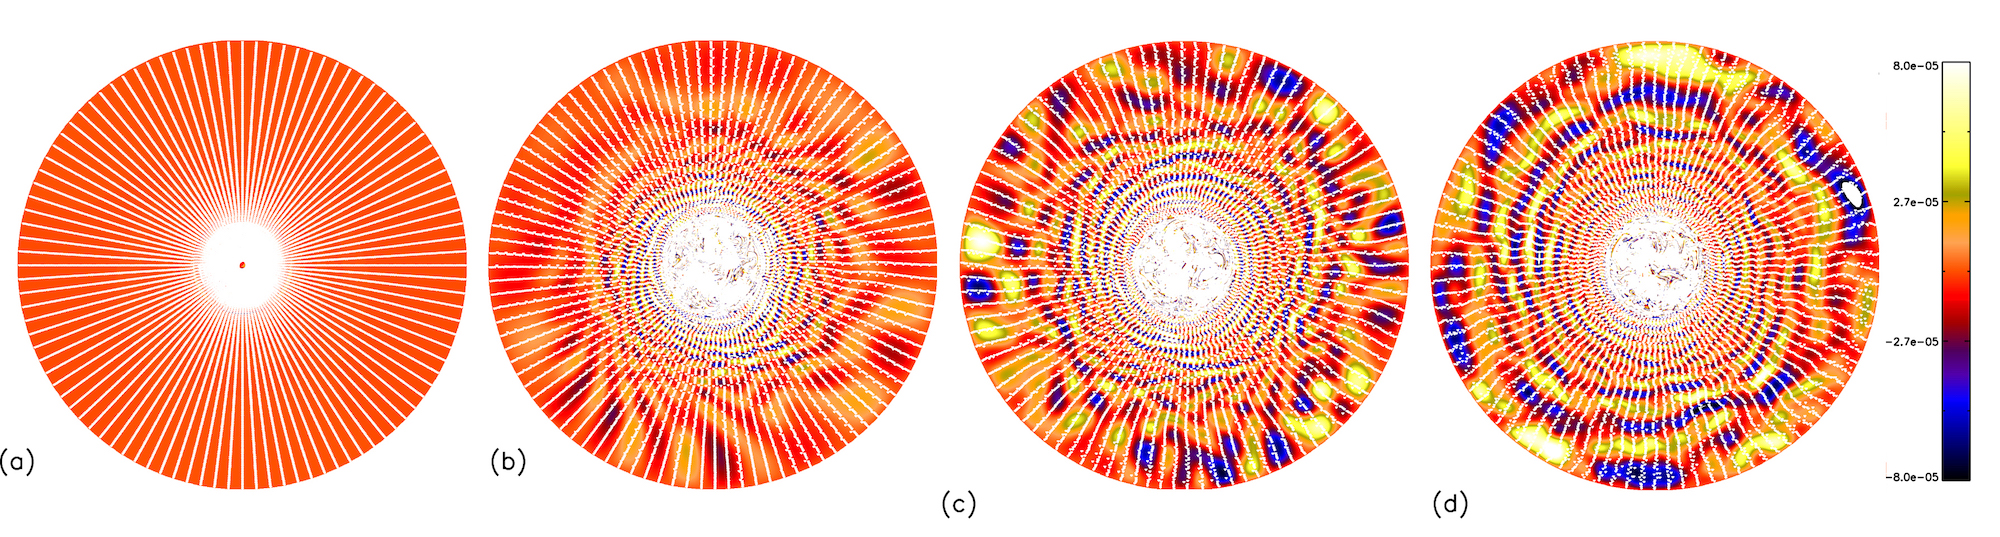
How do stars mix chemicals in their interiors, leading to the abundances we measure at their surfaces? Two scientists from the Planetary Science Institute in Arizona, Tamara Rogers (Newcastle University, UK) and Jim McElwaine (Durham University, UK), have investigated the role that internal gravity waves have in chemical mixing in stellar interiors. Internal gravity waves — not to be confused with the currently topical gravitational waves — are waves that oscillate within a fluid that has a density gradient. Rogers and McElwaine used simulations to explore how these waves can cause particles in a star’s interior to move around, gradually mixing the different chemical elements. Snapshots from four different times in their simulation can be seen below, with the white dots marking tracer particles and the colors indicating vorticity. You can see how the particles move in response to wave motion after the first panel. For more information, check out the paper below!
Citation
T. M. Rogers and J. N. McElwaine 2017 ApJL 848 L1. doi:10.3847/2041-8213/aa8d13