Star-Forming Clouds Feed, Churn, and Fall
Molecular clouds, the birthplaces of stars in galaxies throughout the universe, are complicated and dynamic environments. A new series of simulations has explored how these clouds form, grow, and collapse over their lifetimes.
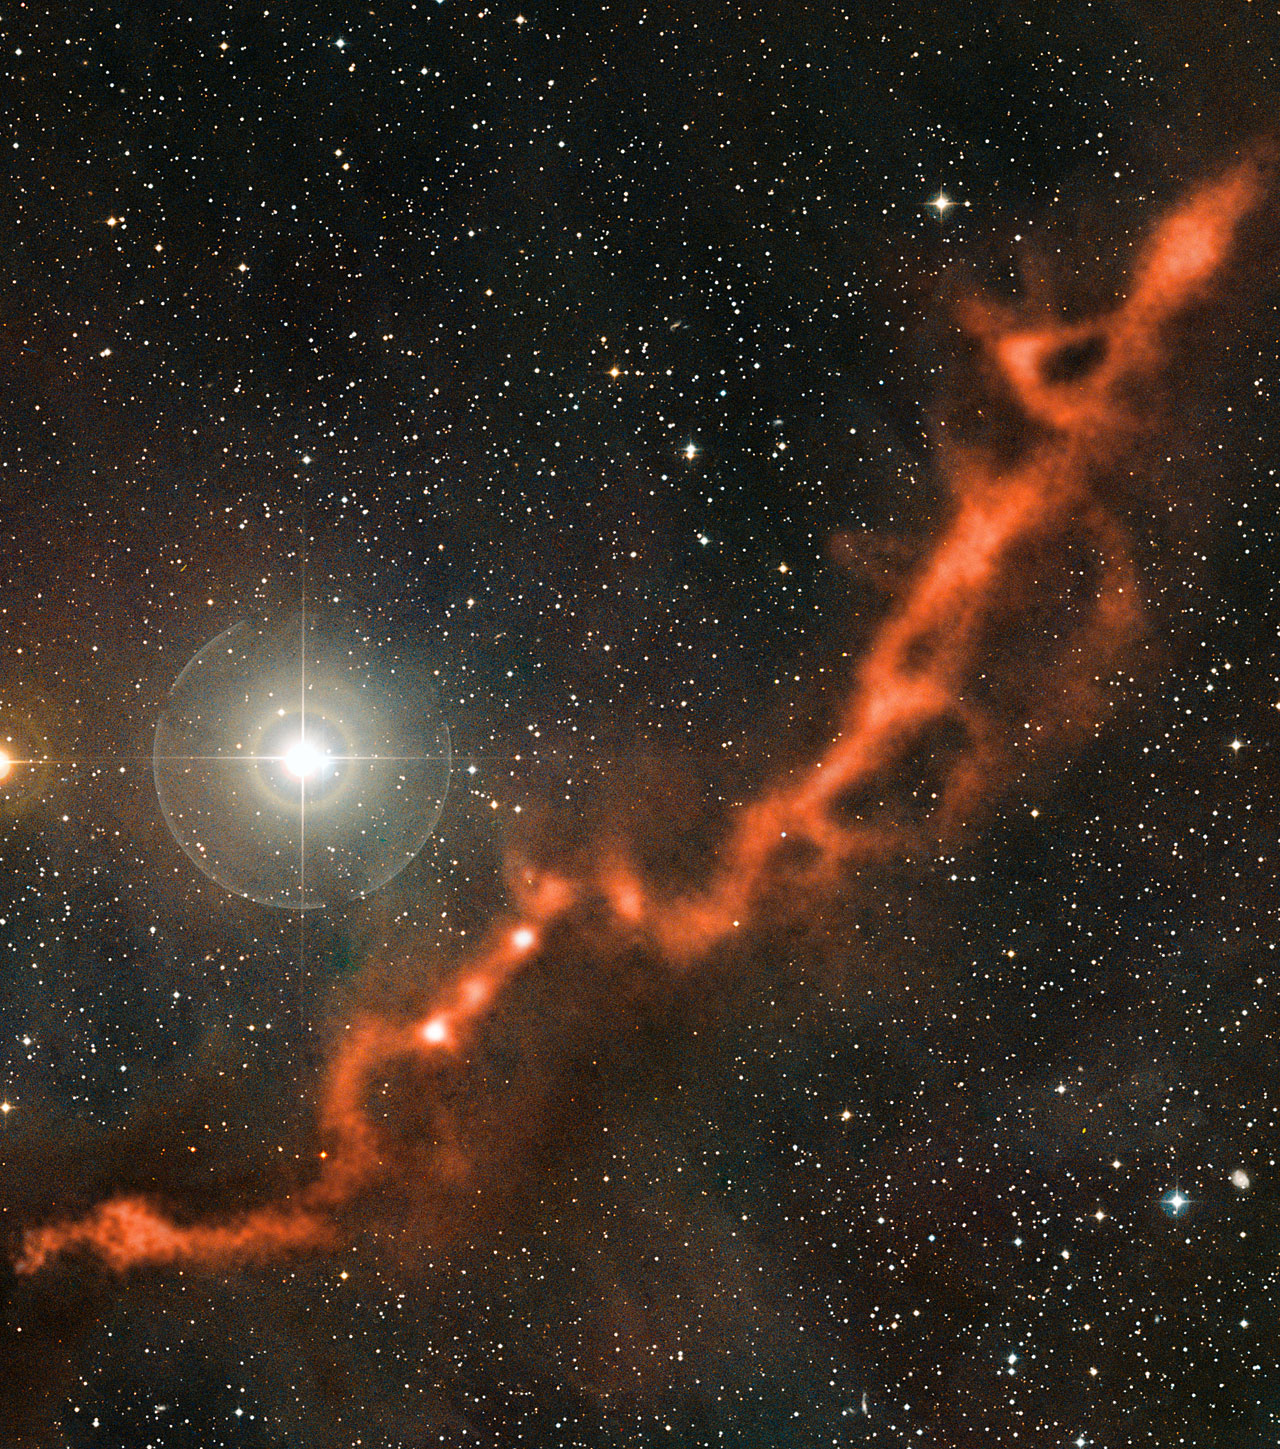
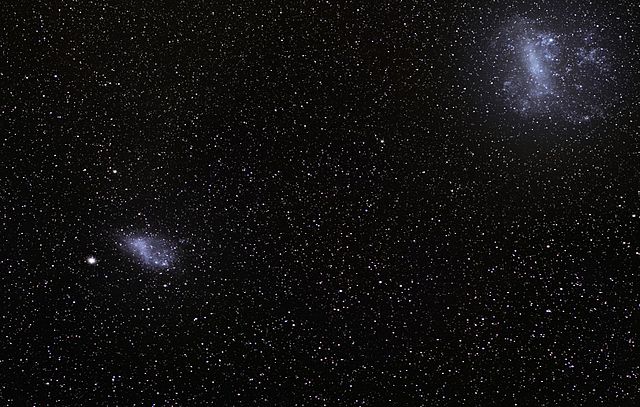
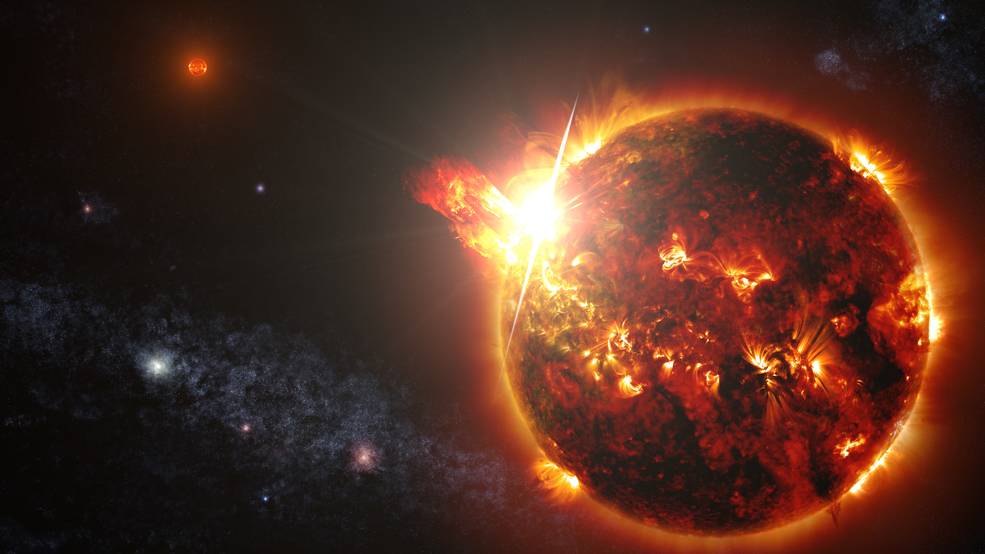
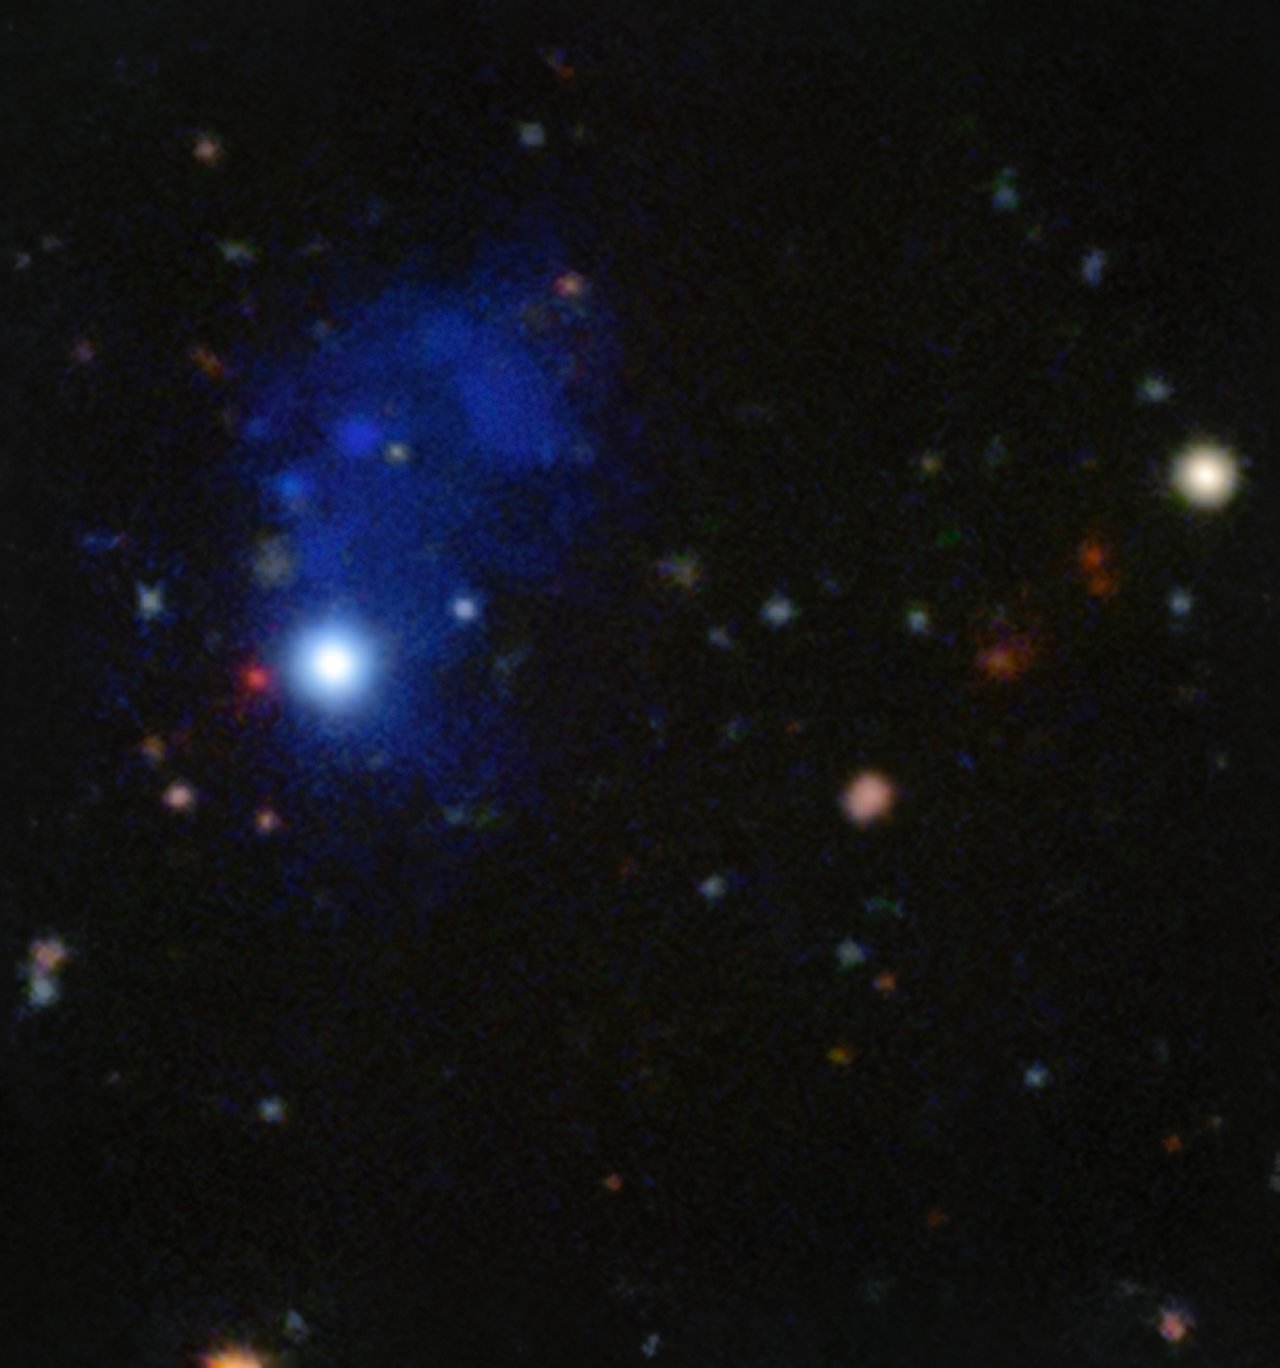
This composite image shows part of the Taurus Molecular Cloud. [ESO/APEX (MPIfR/ESO/OSO)/A. Hacar et al./Digitized Sky Survey]
Stellar Birthplaces
Molecular clouds form out of the matter in between stars, evolving through constant interactions with their turbulent environments. These interactions — taking the form of accretion flows and surface forces, while gravity, turbulence, and magnetic fields interplay — are thought to drive the properties and evolution of the clouds.
Our understanding of the details of this process, however, remains fuzzy. How does mass accretion affect these clouds as they evolve? What happens when nearby supernova explosions blast the outsides of the clouds? What makes the clouds churn, producing the motion within them that prevents them from collapsing? The answers to these questions can tell us about the gas distributed throughout galaxies, revealing information about the environments in which stars form.
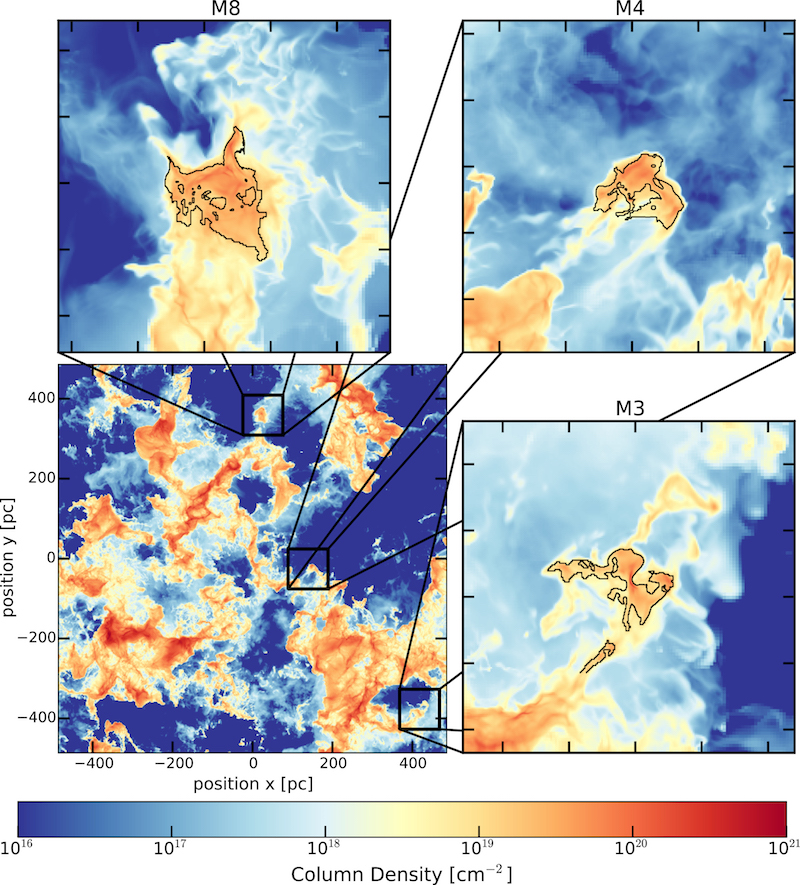
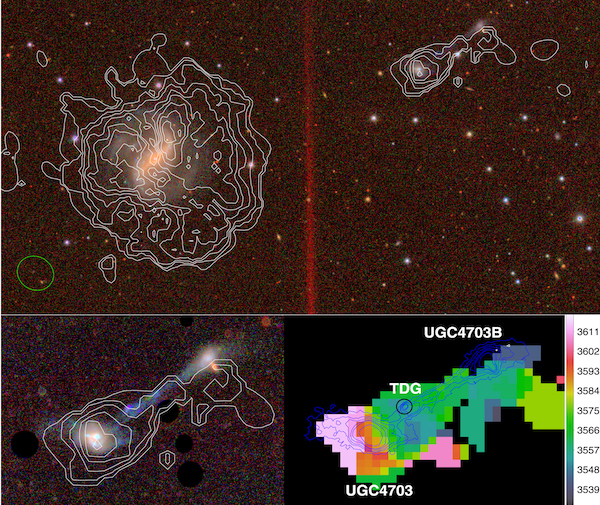
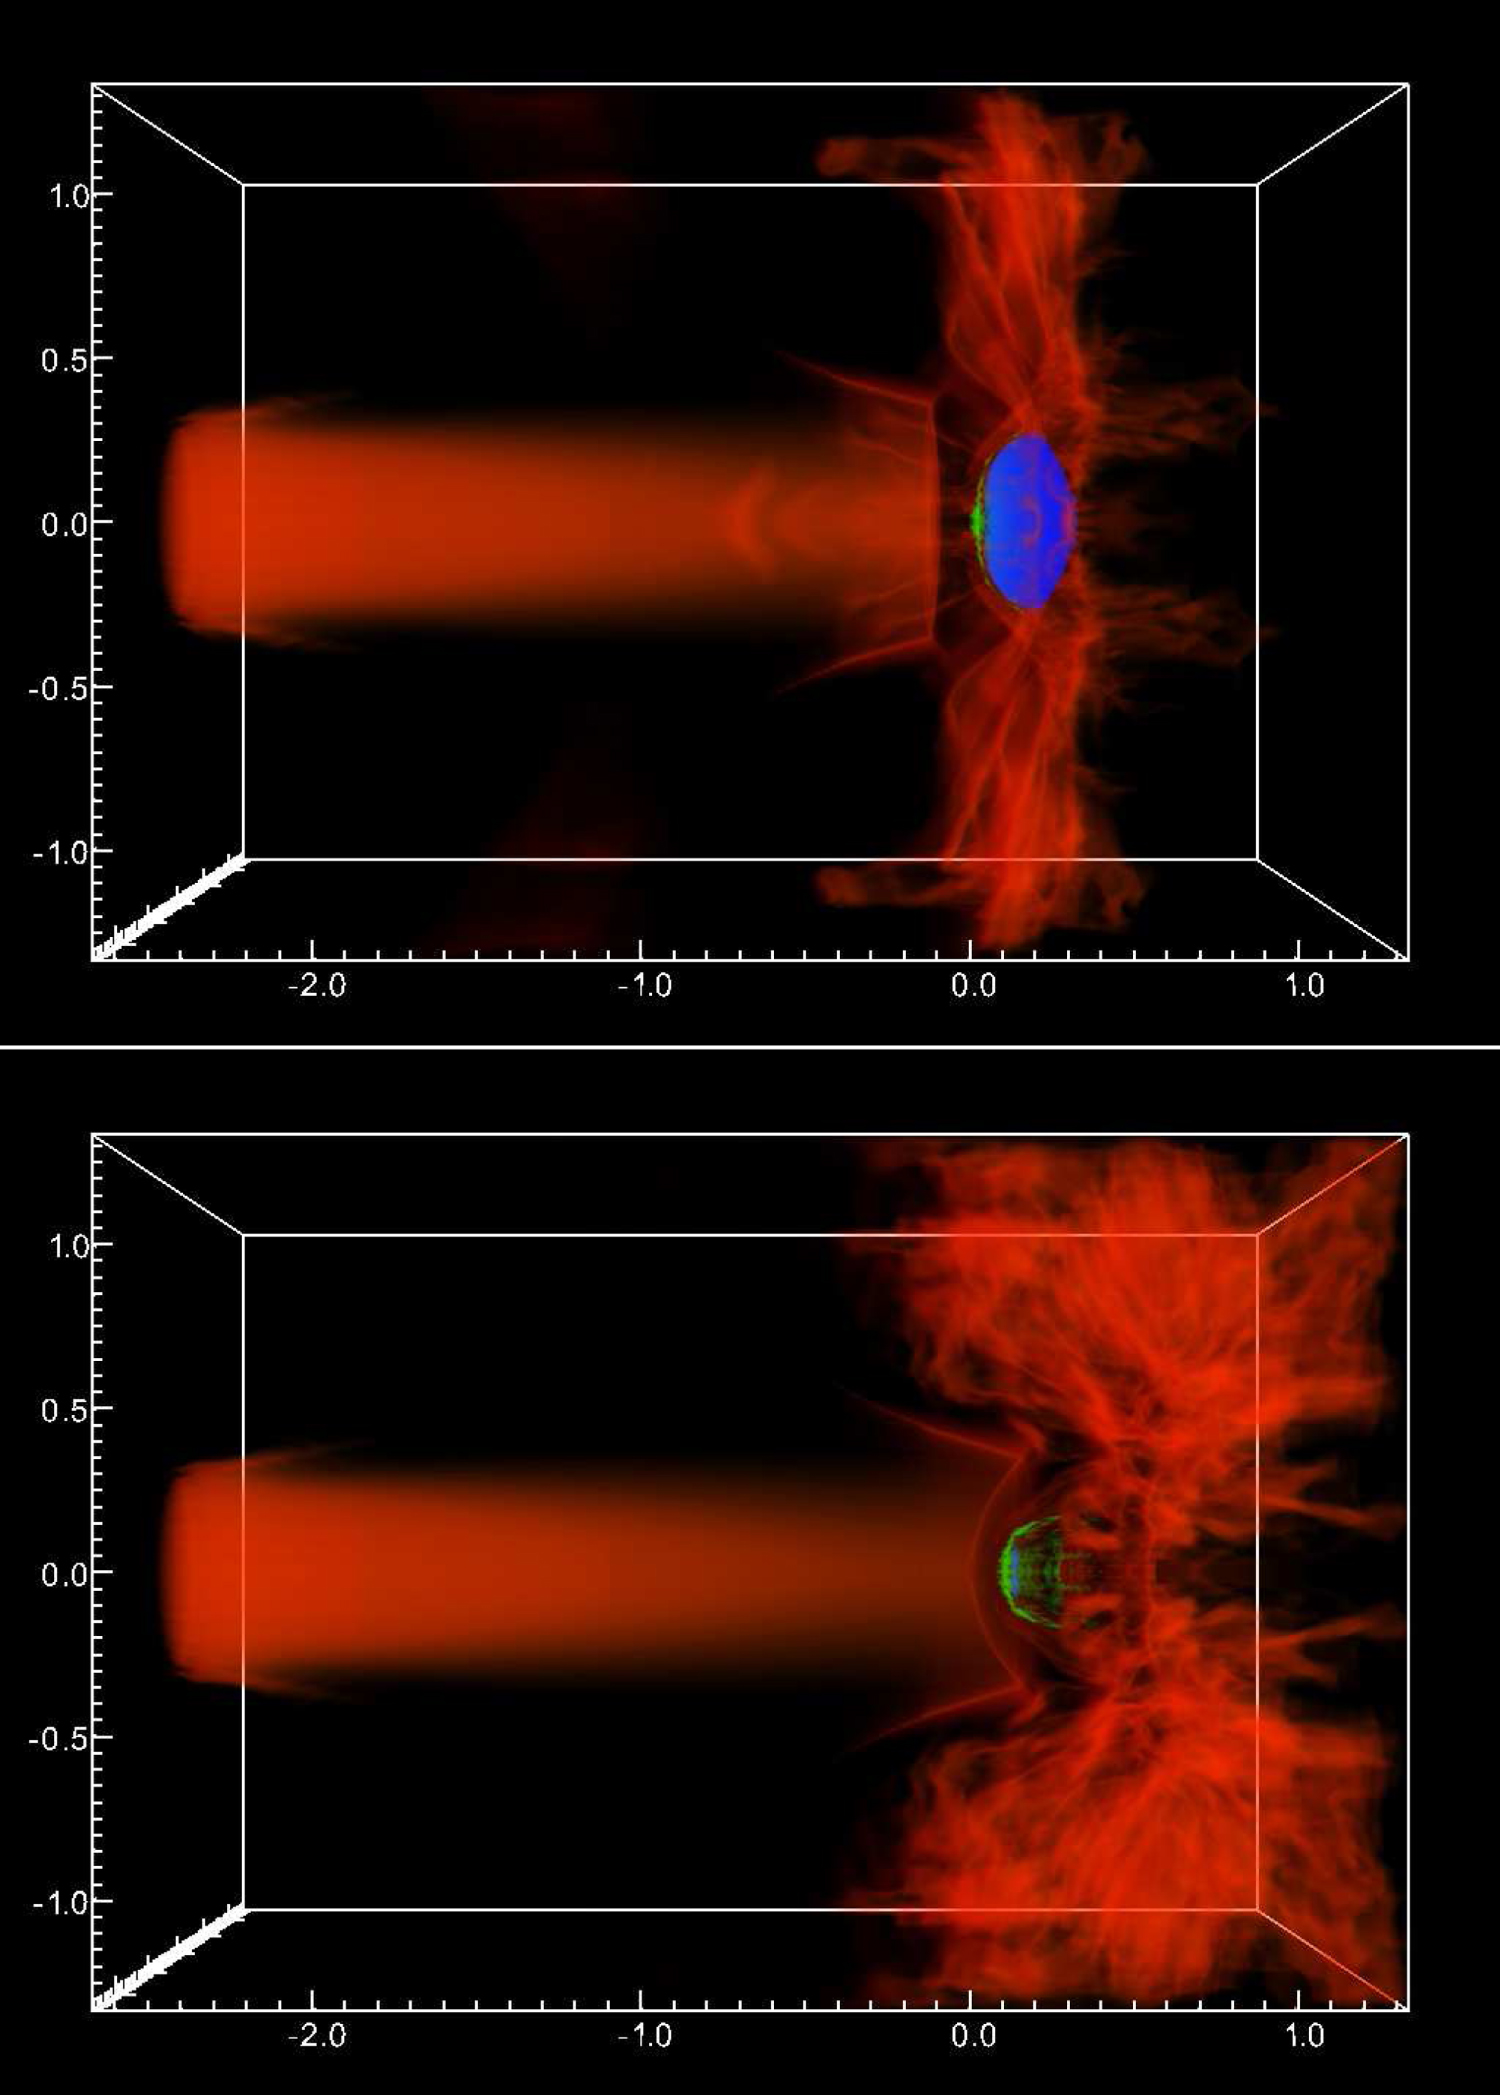
A still from the simulation results showing the broader population of molecular clouds that formed in the authors’ simulations, as well as zoom-in panels of three low-mass clouds tracked in high resolution. [Ibáñez-Mejía et al. 2017]
Models of Turbulence
In a new study led by Juan Ibáñez-Mejía (MPI Garching and Universities of Heidelberg and Cologne in Germany, and American Museum of Natural History), scientists have now explored these questions using a series of three-dimensional simulations of a population of molecular clouds forming and evolving in the turbulent interstellar medium.
The simulations take into account a whole host of physics, including the effects of nearby supernova explosions, self-gravitation, magnetic fields, diffuse heating, and radiative cooling. After looking at the behavior of the broader population of clouds, the authors zoom in and explore three clouds in high-resolution to learn more about the details.
Watching Clouds Evolve
Ibáñez-Mejía and collaborators find that mass accretion occurring after the molecular clouds form plays an important role in the clouds’ evolution, increasing the mass available to form stars and carrying kinetic energy into the cloud. The accretion process is driven both by background turbulent flows and gravitational attraction as the cloud draws in the gas in its nearby environment.

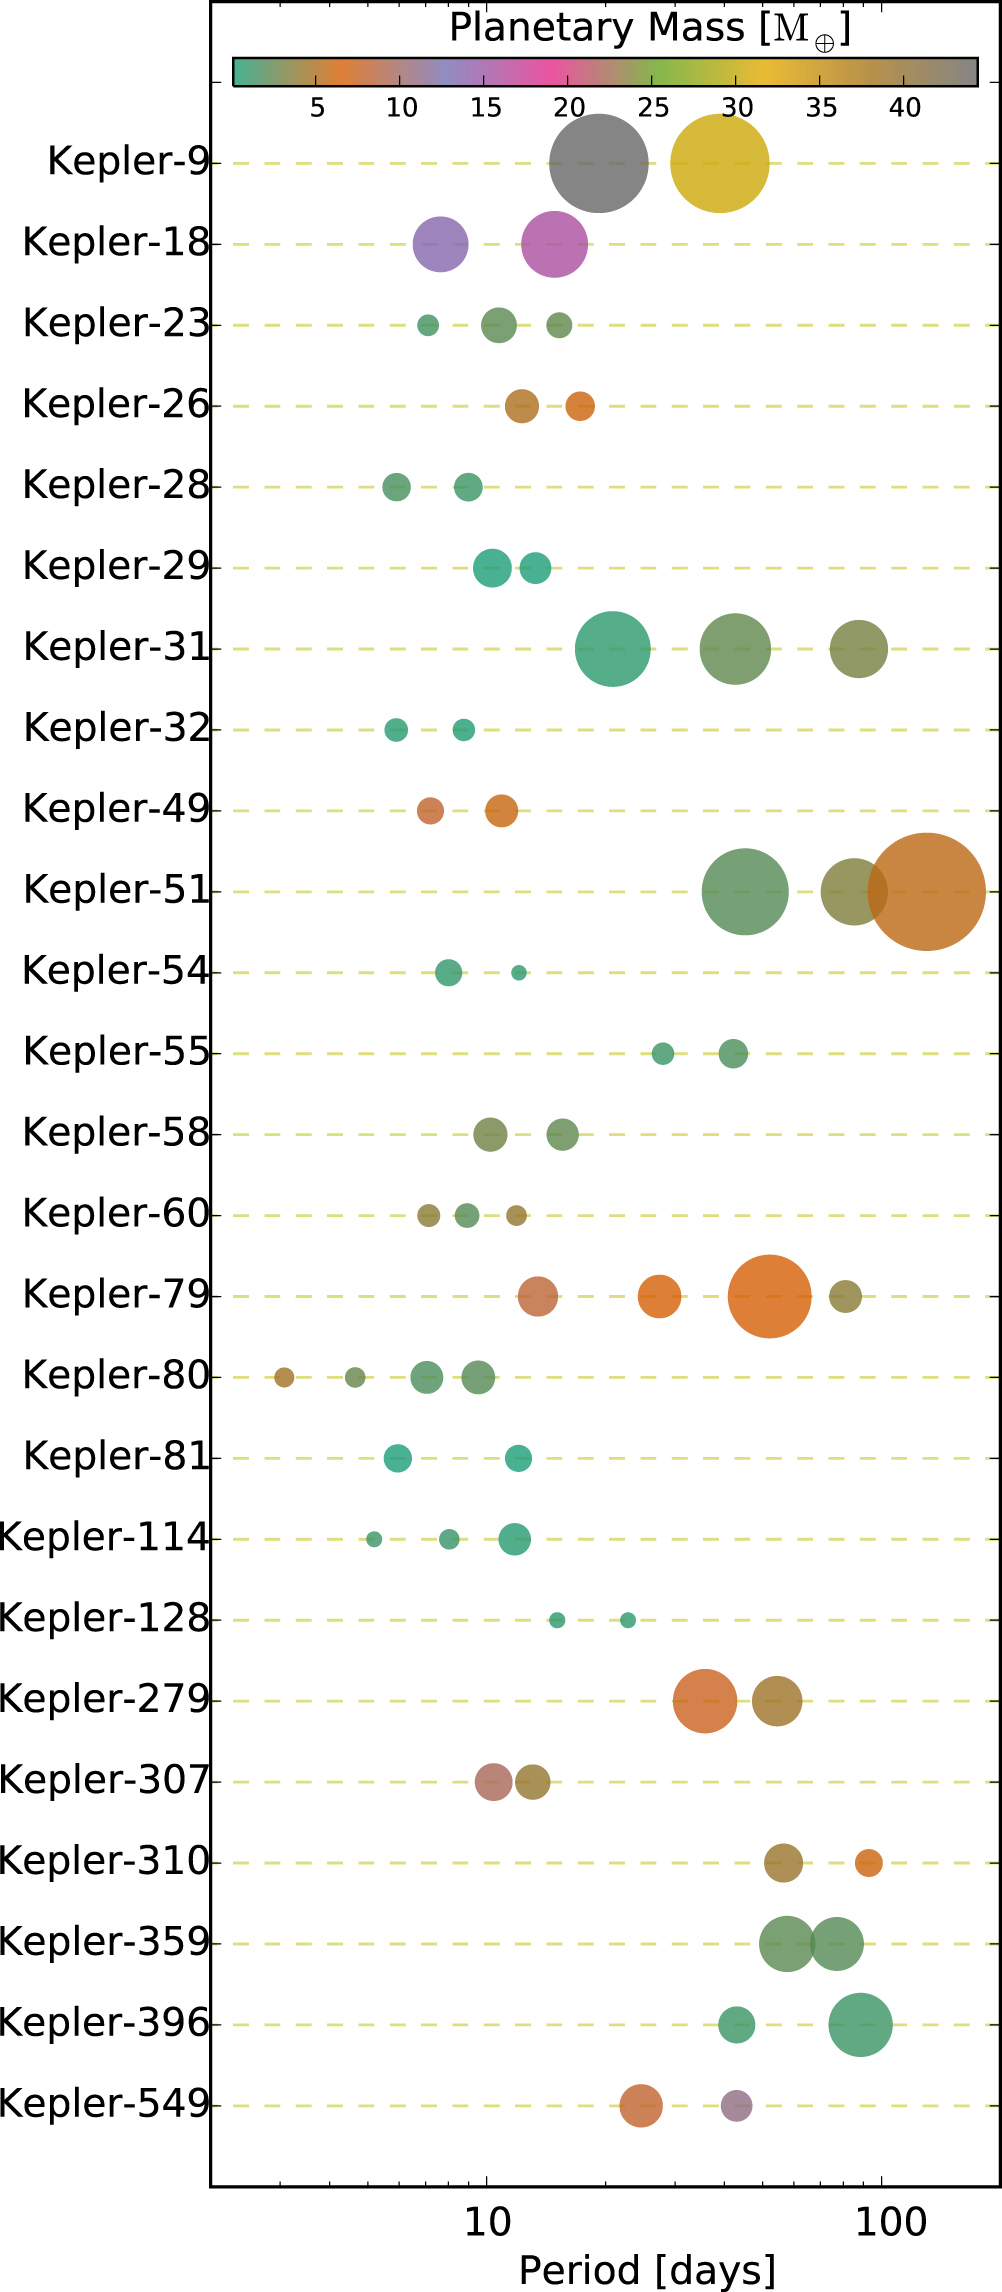
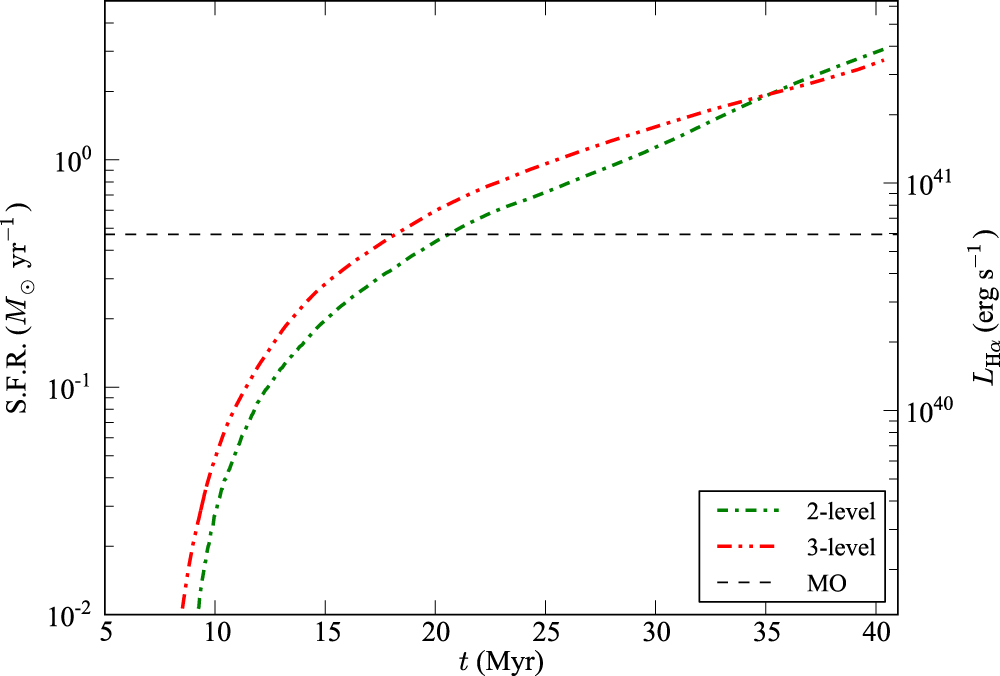
Plots of the cloud mass and radius (top) and mass accretion rate (bottom) for one of the three zoomed-in clouds, shown as a function of time over the 10-Myr simulation. [Adapted from Ibáñez-Mejía et al. 2017]
Lastly, Ibáñez-Mejía and collaborators show that mass accretion alone isn’t enough to power the turbulent internal motions we observe inside molecular clouds. Instead, they conclude, the cloud motions must be primarily powered by gravitational potential energy being converted into kinetic energy as the cloud contracts.
The authors’ simulations therefore show that molecular clouds exist in a state of precarious balance, prevented from collapsing by internal turbulence driven by interactions with their environment and by their own contraction. These results give us an intriguing glimpse into the complex environments in which stars are born.
Bonus
Check out the animated figure below, which displays how the clouds in the authors’ simulations evolve over the span of 10 million years.
Citation
Juan C. Ibáñez-Mejía et al 2017 ApJ 850 62. doi:10.3847/1538-4357/aa93fe


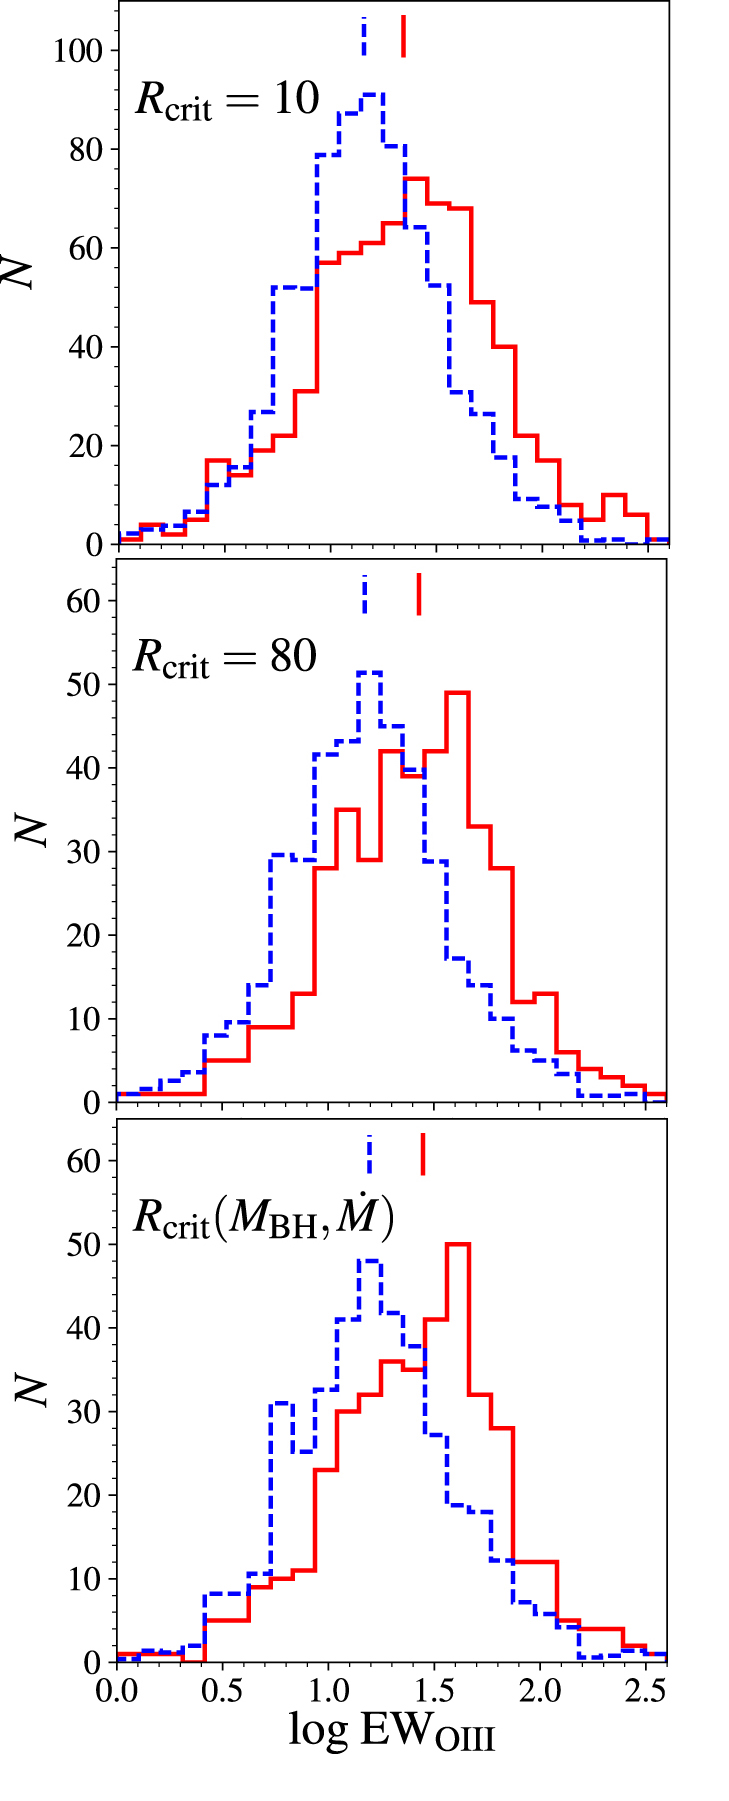
![EW[O III] vs. redshift](https://aasnova.org/wp-content/uploads/2017/11/fig4-4.jpg)