
Editor’s Note: Astrobites is a graduate-student-run organization that digests astrophysical literature for undergraduate students. As part of the partnership between the AAS and astrobites, we occasionally repost astrobites content here at AAS Nova. We hope you enjoy this post from astrobites; the original can be viewed at astrobites.org.
Title: CEERS: Increasing Scatter Along the Star-Forming Main Sequence Indicates Early Galaxies Form in Bursts
Authors: Justin W. Cole et al.
First Author’s Institution: Texas A&M University
Status: Published in ApJ
In the local universe, galaxies tend to form stars at a slow and steady rate, but new observations suggest this is not the case in the early universe. JWST has allowed astronomers to peer further back into the universe’s history, and the galaxies that they’ve found seem to defy expectations. For example, astronomers keep observing more bright galaxies than initially expected. One explanation for the observations made by JWST is that galaxies in the early universe form their stars in bursts interspersed with periods of less intense star formation.
The average rate at which galaxies form stars varies over cosmic time: from the beginning of the universe, it rises for about 3.3 billion years, peaks at around a redshift of z = 2 (equivalent to about 10.4 billion years ago), and then begins to decline. While an individual galaxy might deviate from this general trend, it’s a good description of how an entire population of galaxies behaves over time. Importantly, this trend is slightly different depending on a galaxy’s mass. More massive galaxies tend to form more of their stars and reach their peak star formation rate earlier in the universe’s history.
The correlation between mass and star formation rate gives rise to a relationship known as the star-forming main sequence, or SFMS. The SFMS is an observed correlation between a galaxy’s stellar mass and its star formation rate — higher-mass galaxies generally form stars at a higher rate. Since the cosmic star formation rate changes with time, so does the SFMS. For example, the SFMS of galaxies close to the peak of cosmic star formation will be shifted towards higher star formation rates than the SFMS of local galaxies.
To make things more interesting, astronomers can use different features in a galaxy’s spectrum to estimate the star formation rate averaged over a different amount of time. For instance, you can use the luminosity of the Hα emission line to estimate the star formation rate averaged over the last 10 million years. This is because the Hα emission line is produced in ionised gas surrounding the most massive stars (O types), which only live for a couple million years. By contrast, the ultraviolet luminosity of a galaxy is more sensitive to the emission from lower-mass, longer-lived stars, giving astronomers a way to estimate the star formation rate over the past 100 million years.
The authors of today’s article use these two measures of star formation rate to investigate the star-forming histories of over 1,800 high-redshift galaxies. They find that the SFMS has a lot more scatter if you use a short-timescale, Hα-based star formation rate as opposed to a longer-timescale, ultraviolet-based star formation rate. This suggests that the star formation rate is more variable on short timescales and supports the idea of bursty star formation.
The galaxies used in the analysis were observed as part of the Cosmic Evolution Early Release Science (CEERS) survey using the Near Infrared Camera (NIRCam) on JWST. All of the galaxies are in a very well-studied region of the sky known as the Extended Groth Strip, so the authors were able to combine the JWST data with pre-existing Hubble data.
To determine how the SFMS evolves with time, the authors divided the sample into five different bins, each in a different redshift range. For each bin and each star formation rate indicator, they estimated the slope, normalisation (y-intercept), and scatter of the SFMS. Across all redshifts, the authors found that the shorter-timescale, Hα-based star formation rate generated an SFMS with more scatter (see Figure 1) and a lower normalisation than an SFMS based on a longer-timescale star formation rate. Larger scatter shows that the star formation rate varies more on short timescales than long timescales, reflecting a bursty star-formation history. The lower normalisation shows that the short-timescale star formation rate is, on average, lower than the long-timescale rate. So, the authors conclude that while star formation does happen in bursts, it’s more accurate to describe the star-formation history as interruptions to normal star formation (lulls or naps that last between 100 and 250 million years), as opposed to short periods of very intense star formation.
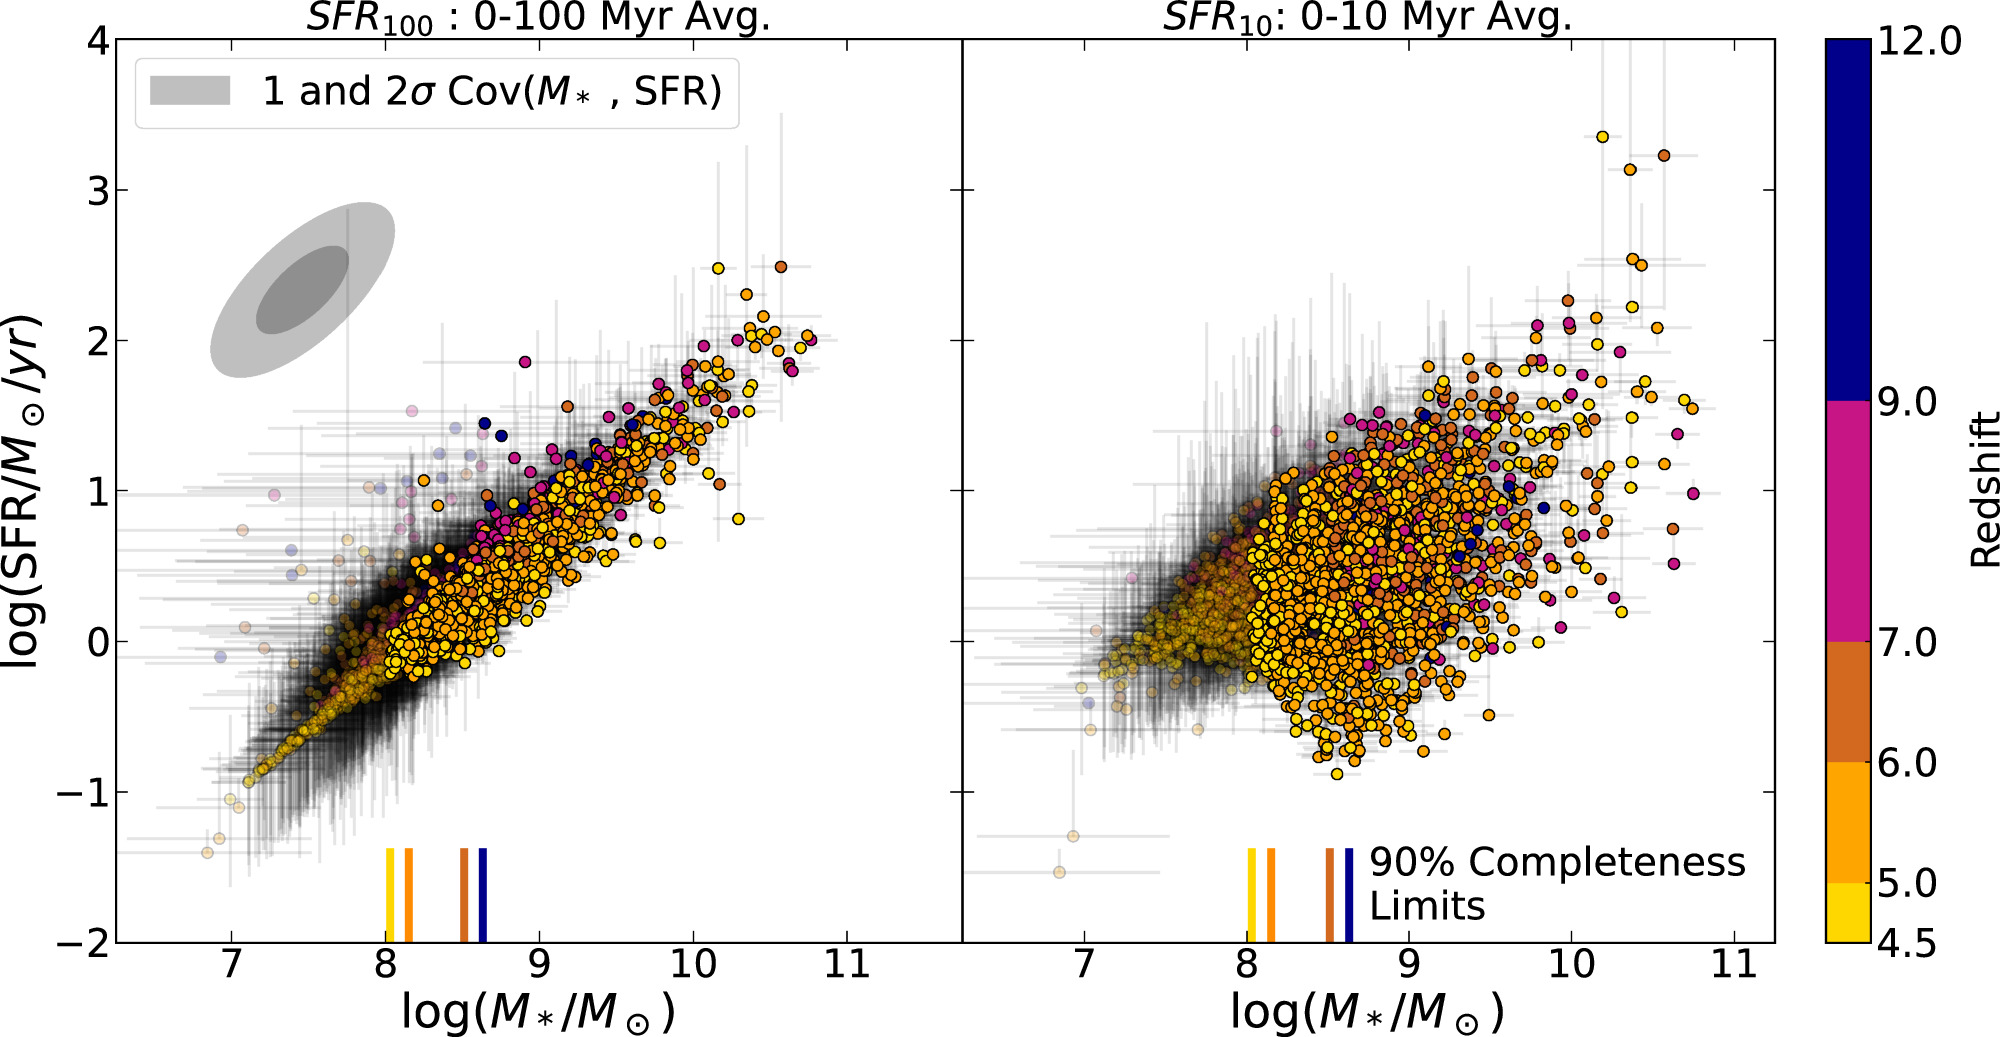
Figure 1: The left-hand panel shows a long-term star formation rate (averaged over 100 million years) and the right-hand panel shows a shorter-term star formation rate (averaged over 10 million years). You can see that the right-hand panel has a lot more scatter than the left. [Cole et al. 2025]
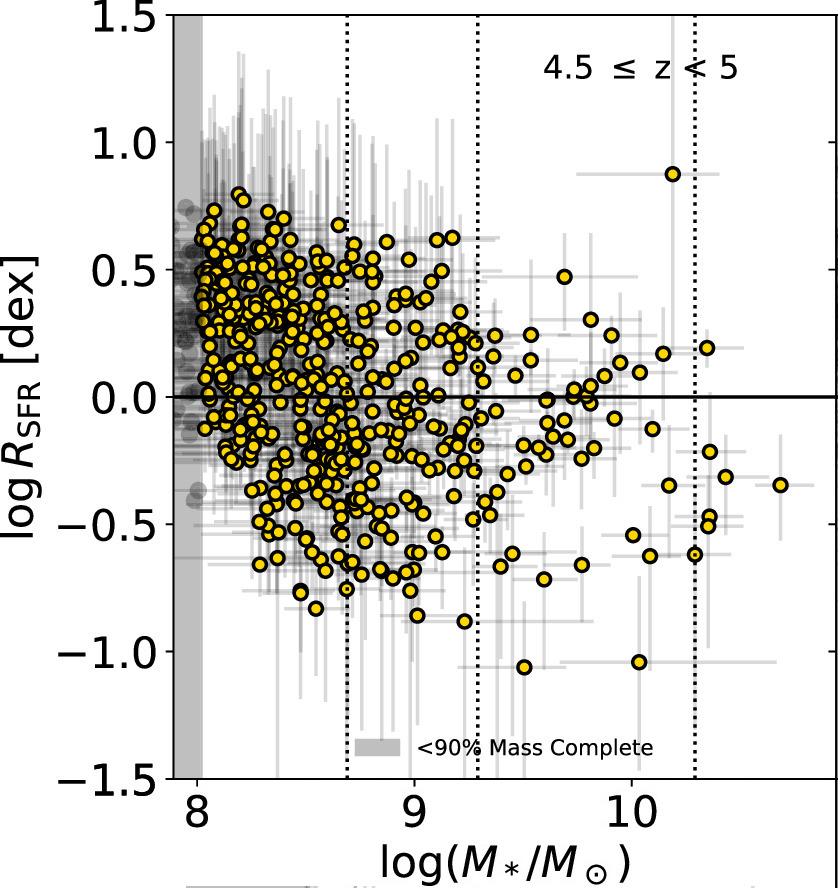
Figure 2: Higher-mass (x-axis) galaxies have a lower short-term star formation rate as compared to their long-term star formation rate, suggesting that higher-mass galaxies have shorter periods of activity. Click to enlarge. [Adapted from Cole et al. 2025]
The results of today’s article give us an exciting insight into the early stages of galaxy evolution and will help us to model these newly observed baby galaxies. There are still lots of open questions regarding why star-formation histories seem to be so different in the early universe, so stay tuned as astronomers learn more about galaxy evolution!
Original astrobite edited by Will Golay.
About the author, Nathalie Korhonen Cuestas:
Nathalie Korhonen Cuestas is a second-year PhD student at Northwestern University, where her research focuses on the chemical evolution of galaxies.