
Editor’s Note: Astrobites is a graduate-student-run organization that digests astrophysical literature for undergraduate students. As part of the partnership between the AAS and astrobites, we occasionally repost astrobites content here at AAS Nova. We hope you enjoy this post from astrobites; the original can be viewed at astrobites.org.
Title: Discovery of Local Analogs to JWST’s Little Red Dots
Authors: Ruqiu Lin et al.
First Author’s Institution: Shanghai Astronomical Observatory
Status: Published in ApJL
The universe is home to many fascinating objects! In today’s bite, let’s take a closer look at two of them:
Little red dots: These compact red galaxies are peppered throughout the early universe (as seen in JWST images), and evidence suggests that each little red dot hosts an active black hole (active galactic nucleus) at its center. This raises essential questions about how black holes got so huge in a very short time since the formation of the universe. You can read more about little red dots here and here.
Green pea galaxies: These are small and green (resembling peas!) and are found in the nearby universe (0.1 < z < 0.4). They appear green because a large fraction of light from these galaxies originates from bright, glowing gas clouds that emit light at specific wavelengths (such as emission from [O III], which falls in the part of the electromagnetic spectrum that corresponds to green color) rather than the broad spectrum of light and continuous colors emitted by stars in other galaxies. The presence of broad emission lines in the spectrum of green peas suggests that these galaxies could also host an active galactic nucleus. Interestingly, green peas were first discovered in 2007 by citizen scientists through the Galaxy Zoo project.
Wait, Are These the Same Thing?
The similarities between little red dots and green pea galaxies suggest that green peas could be early-universe little red dots that evolved with little change and survived to the present-day universe. The authors of today’s article set out to explore this possibility. A good approach is to list the characteristics of little red dots and determine whether green peas share those same traits. The authors start with a large sample of around 2,000 green pea galaxies and then systematically select the galaxies that have the closest resemblance to little red dots.
What Are the Defining Characteristics of Little Red Dots?
- They have broad H-alpha lines. One of the characteristic features of little red dots is the presence of broad hydrogen lines, which indicates that they host an active galactic nucleus. Thus, only the green peas with signatures of broad lines (full width at half-maximum of the emission line is greater than 1,000 km/s) were selected, narrowing the list down to 19 green peas with broad H-alpha lines.
- They are little! If the name wasn’t clear enough, little red dots have compact sizes. Fourteen out of the 19 broad-line green peas were compact, with the radius of the image being less than 2.5 arcseconds, which is similar to the size of little red dots.
- They have “V”-shaped spectral energy distributions. Perhaps the most defining feature of little red dots is that they have a spectral energy distribution that looks like a “V,” with a sharp rise in the ultraviolet part of the spectral energy distribution, which gradually slopes downwards and then rises steeply again in the infrared. While the increase in the infrared can be attributed to dust reddening, the ultraviolet spike is still poorly understood. Nevertheless, seeing that this is the defining characteristic of little red dots, the authors only select compact, broad-line green peas that have similar (based on the calculated slopes from little red dots) V-shaped spectral energy distributions, using ultraviolet data from the Galaxy Evolution Explorer survey and optical data from the Sloan Digital Sky Survey (Figure 1).
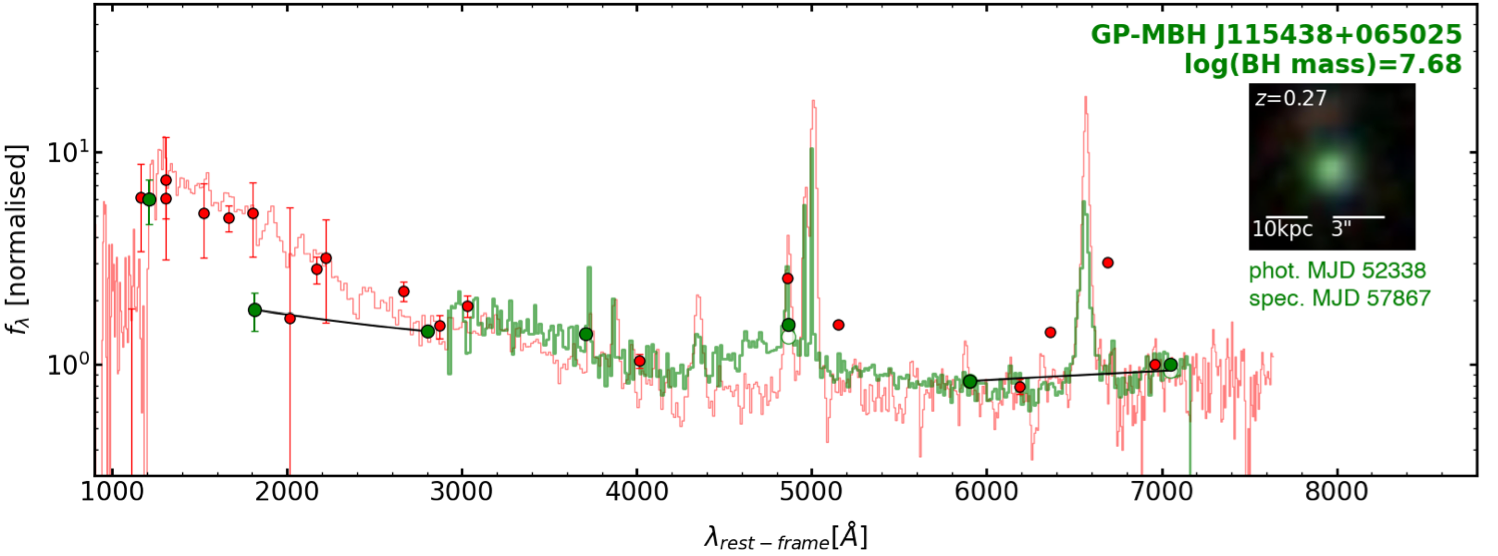
Figure 1: The ultraviolet–optical spectrum of a little red dot plotted in red with the spectrum of a green pea candidate overplotted in green to show the similarities between the two spectra. The broad H-alpha feature can be noticed in both spectra at around 6564 Å. The rising continuum in the ultraviolet for the little red dot spectrum is visible here, which is also seen in the green pea spectrum (indicated by the green dots). [Adapted from Lin et al. 2025]
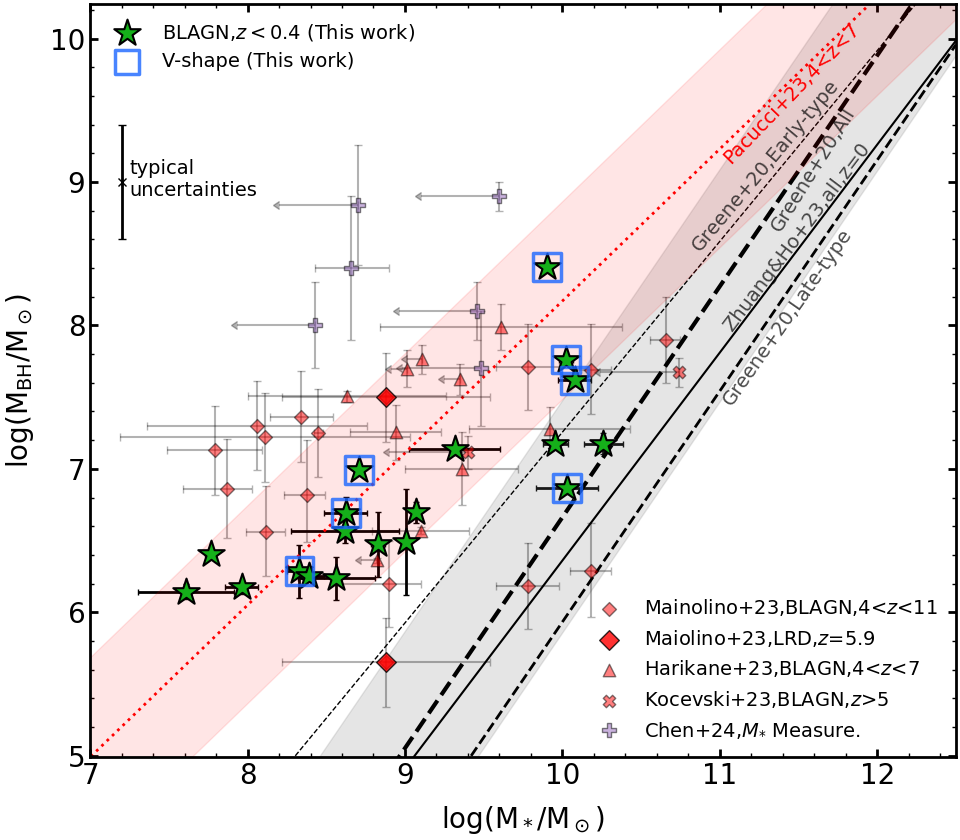
Figure 2: A plot showing the stellar mass of the galaxy on the x-axis with the black hole mass on the y-axis. The various black lines are the expected masses from scaling relations. The little red dots (red diamonds, crosses, and triangles) and green peas (green stars, with the broad-line green peas with V-shaped spectral energy distributions highlighted with the blue box) have higher black hole masses than expected. [Lin et al. 2025]
Original astrobite edited by Erica Sawczynec.
About the author, Archana Aravindan:
I am a PhD candidate at the University of California, Riverside, where I study black hole activity in small galaxies. When I am not looking through some incredible telescopes, you can usually find me reading, thinking about policy, or learning a cool language!