
Editor’s Note: Astrobites is a graduate-student-run organization that digests astrophysical literature for undergraduate students. As part of the partnership between the AAS and astrobites, we occasionally repost astrobites content here at AAS Nova. We hope you enjoy this post from astrobites; the original can be viewed at astrobites.org.
Title: Search for the Blazhko Effect in Field RR Lyrae Stars Using LINEAR and ZTF Light Curves
Authors: Ema Donev and Željko Ivezić
First Author’s Institution: XV. Gymnasium (MIOC)
Status: Published in AJ
RR Lyrae stars are a class of pulsating variable stars — similar to better-known Cepheid variables — that sit on the horizontal branch of the Hertzsprung–Russell diagram. Because of the regularity with which they pulsate, these stars are useful for a number of scientific applications, including standard-candle distancing (helping astronomers set the scale of distances in the universe) and as probes of very old star formation in nearby populations (because most RR Lyrae stars are at least 10 billion years old).
Today’s article studies the Blazhko effect in RR Lyrae stars. Simply put, the Blazhko effect is a long-term change of the duration (period) or strength (amplitude) of pulsation in some RR Lyrae variables. Fig. 1 shows an example from today’s article. While this effect was first observed as early as 1907, the physical mechanism for Blazhko modulation is still formally unknown, as is the percentage of RR Lyrae stars that exhibit it. Broadly speaking, there are three explanations for this effect: 1) nonlinear resonance between a star’s primary pulsation mode and some higher-level pulsation, 2) magnetic influence, or 3) cycles in the convection activity.
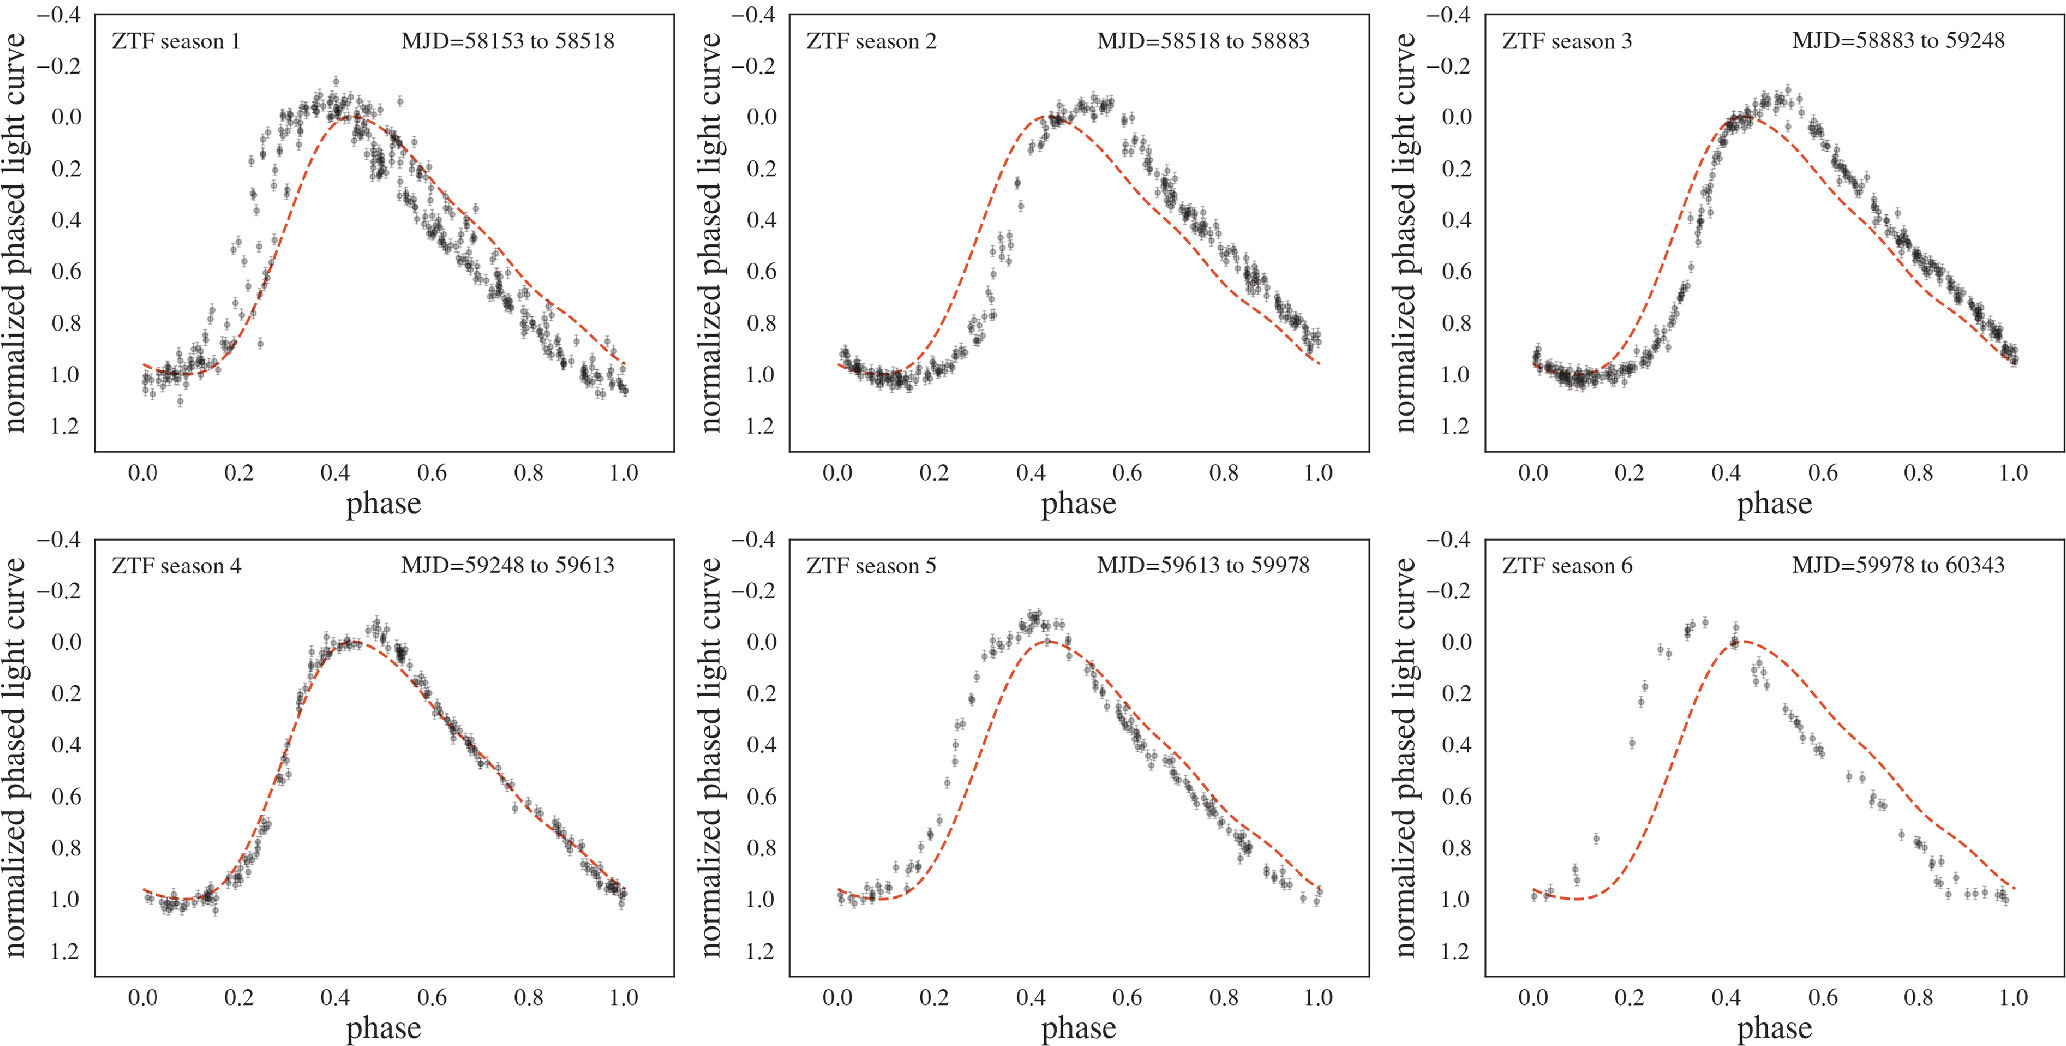
Figure 1: An example of the Blazhko effect. Each panel shows data from ZTF for the same source for different seasons (at different times). The best-fit pulsation model for the total data set is shown in red. Over time, the actual pulsation of the source (black data) varies significantly from the average best fit due to Blazhko modulation. [Adapted from Donev and Ivezić 2025]
From this initial set of RR Lyrae stars, today’s article identifies 531 potential Blazhko star candidates that are moved on to a visual inspection step. In order to identify the candidates for visual inspection, the authors establish two pre-selection methods based on the direct light curve and periodogram for each source:
- Light curve selection works by algorithmically assigning a score to each source, with higher scores indicating a greater expectation that the source is a Blazhko RR Lyrae star. The scores are associated with best-fit pulsation models. One way a given source could earn points was by having a very high reduced χ2 statistic in one or both data sets. Blazhko modulation changes the characteristics of the pulsations over time, meaning the best-fit model will be a poor fit to many of the pulsations within one or both data sets. Generally, poorer fits mean higher reduced χ2 values. In addition, candidates could earn points by having a moderately high reduced χ2 statistic in one or both data sets, as well as a significant change in pulsation characteristics of the best fit model from one data set to the next. Such a change between data sets is an indication of long-term Blazhko modulation. From this 479 of the 531 candidates are identified.
- Periodogram selection works by looking for interactions between the primary pulsation and Blazhko frequencies. First, the authors create a periodogram for the time-series data. In short, a periodogram plots a number of possible frequencies (or periods) of variability in the data versus the “power” associated with that frequency (or period), where higher power means the data vary more strongly at that frequency. When periodic data have only one associated frequency, the periodogram will show a single peak with high power. In the case where there are two effects of variation (in this case, the pulsation of the star and the Blazhko modulation) with disparate frequencies, a single, large peak will occur at the average frequency, with a smaller peak appearing to either side. Fig. 2 shows an example using simulated data. By identifying the location and strength of these side peaks, the authors are able to identify a handful of additional Blazhko sources (29), as well as estimate the frequencies of Blazhko modulation.
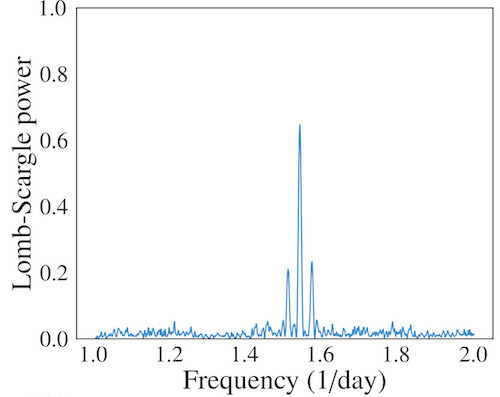
Figure 2: A simulated Lomb–Scargle periodogram made using the sum of two sine functions with similar, but different, frequencies. Note the primary peak at the frequencies’ mean, and the smaller side peaks indicating the difference. [Adapted from Donev and Ivezić 2025]
Original astrobite edited by Kylee Carden.
About the author, Catherine Slaughter:
Catherine is a PhD candidate in astrophysics at the University of Minnesota. Her research primarily deals with stellar population astrophysics in local dwarf galaxies, with particular focus on the intersection between computational and observational research methods. Prior to moving to Minnesota, she completed her BA in Physics and Astronomy, and MSc in Astronomy Research at Leiden University.