
Do galaxies form stars steadily or in sudden bursts? In a new article, researchers study starlight from hundreds of galaxies to disentangle their star formation histories.
In the Light of New Stars
As new stars form, they heat and disrupt their surroundings. This process of feedback, which also includes things like supernovae and jets from accreting supermassive black holes, can moderate the rate at which a galaxy forms new stars. As a result, star formation sometimes happens in fits and starts. But how can we tell if a galaxy has experienced smooth or sudden star formation?
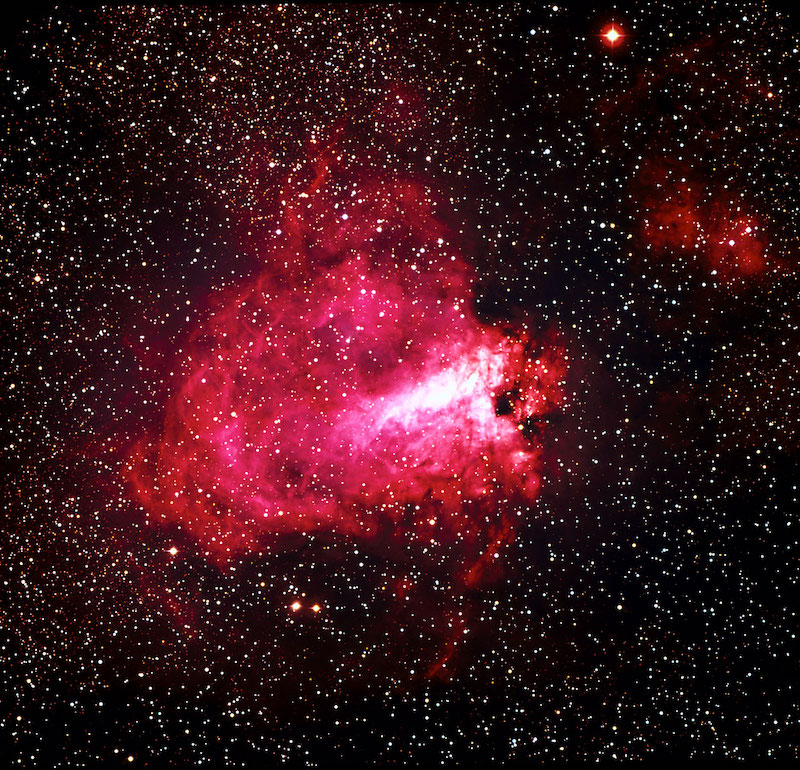
Messier 17, the Omega Nebula, glows red because of energy injected by hot young stars. [ESO; CC BY 4.0]
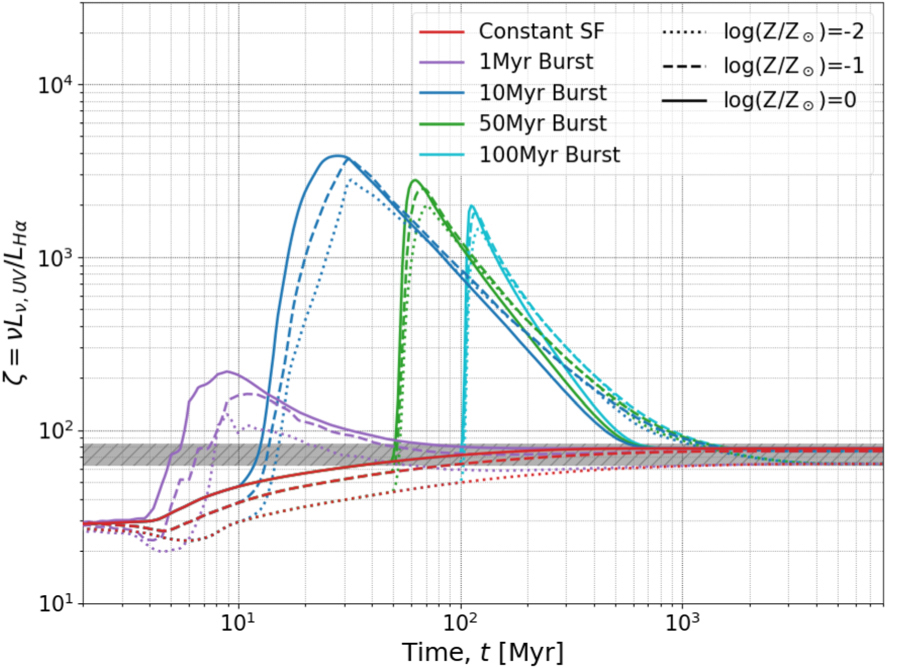
Model output showing how the ultraviolet-to-H-alpha ratio, ζ, changes over time for constant star formation (red lines) and bursts of different durations (purple, blue, green, and cyan lines). Click to enlarge. [Adapted from Mehta et al. 2023]
Studying Star Formation History
Vihang Mehta (IPAC-Caltech) and collaborators determined the recent star formation histories for 979 galaxies using ultraviolet images and infrared spectra from the Hubble Space Telescope. These data sets allowed them to determine the ultraviolet emission from cooler B and A stars and the H-alpha emission from ionized gas surrounding hot O and B stars. (The galaxies in the sample are at redshifts between 0.7 and 1.5, so their red H-alpha emission has shifted into the infrared.)
Using these data, Mehta’s team calculated the ratio of ultraviolet to H-alpha emission for each galaxy. To interpret the results, the team modeled how steady and “bursty” star formation impact the ratio. In the case of steady star formation, the ratio increases slowly to a constant value. For a burst of star formation, the ratio jumps to high values before decreasing to a constant value.
Smooth vs. Bursty
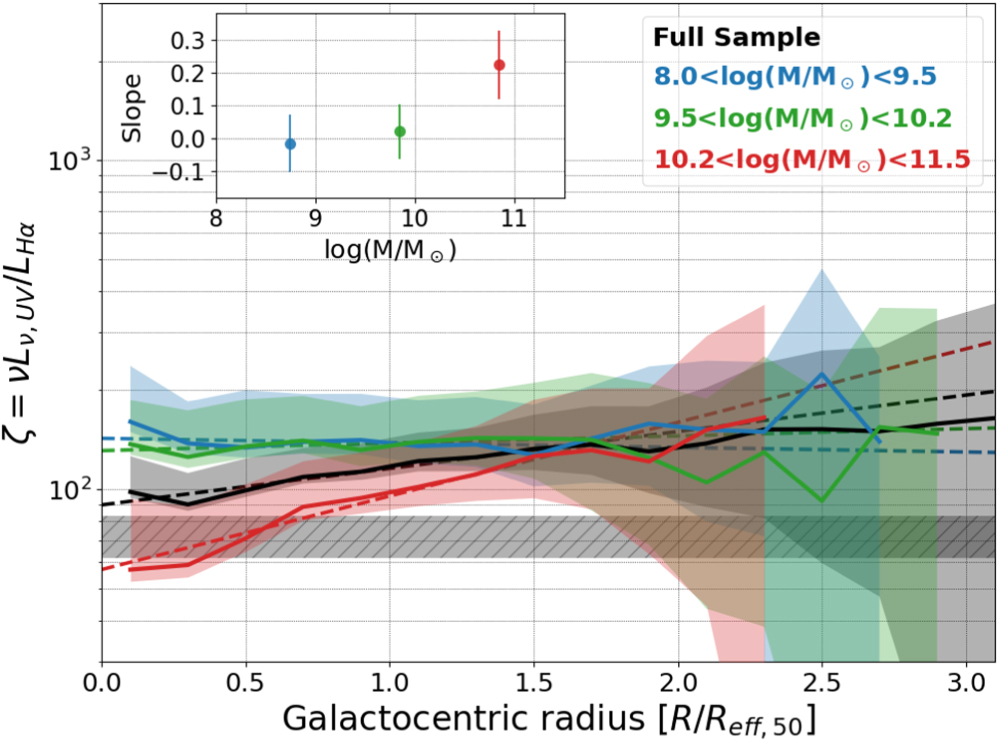
Measured ultraviolet-to-H-alpha ratio, corrected for dust attenuation, as a function of distance from the galactic center for galaxies in three mass bins. Low- and intermediate-mass galaxies do not have a strong trend with radius. Click to enlarge. [Mehta et al. 2023]
Bursty star formation appears to be more important in the outskirts of these galaxies than at their centers. Breaking the galaxies into groups by mass, the team found that low- and intermediate-mass galaxies have bursty star formation throughout. High-mass galaxies, on the other hand, appear to have smooth star formation at their centers and bursty star formation at their edges. Looking at localized trends, the team also found that regions where stars are relatively sparse tend to have bursty star formation, regardless of the total mass of the galaxy.
The trends unearthed in this study will help to constrain our models of star formation. And as always, JWST data can help push this investigation to higher redshifts, even as far back as cosmic noon — when our universe’s star formation was at its peak.
Citation
“A Spatially Resolved Analysis of Star Formation Burstiness by Comparing UV and Hα in Galaxies at z ∼ 1 with UVCANDELS,” Vihang Mehta et al 2023 ApJ 952 133. doi:10.3847/1538-4357/acd9cf