")
Editor’s Note: Astrobites is a graduate-student-run organization that digests astrophysical literature for undergraduate students. As part of the partnership between the AAS and astrobites, we occasionally repost astrobites content here at AAS Nova. We hope you enjoy this post from astrobites; the original can be viewed at astrobites.org.
Title: Beyond UVJ: Color Selection of Galaxies in the JWST Era
Authors: Jacqueline Antwi-Danso et al.
First Author’s Institution: Texas A&M University
Status: Published in ApJ
Separating the Living from the Dead

Figure 1: The galaxy cluster SMACS 0723, as seen by JWST. [NASA, ESA, CSA, and STScI]
Quiescent galaxies are often called “red and dead” because they appear redder in color than star-forming galaxies, which have younger and bluer stellar populations. Using this principle, quiescent galaxies are selected through what’s known as a UVJ diagram. In this diagram, the difference in a galaxy’s brightness in an ultraviolet filter (U) and a visible filter (V) is compared to the difference in its brightness in a visible filter (V) and a near-infrared filter (J). Because quiescent galaxies tend to be less bright than star-forming galaxies in ultraviolet and near-infrared bands (they tend to lack the infrared-emitting dust of dusty star-forming galaxies), they will clump together in the upper left part of the UVJ diagram, as seen in Figure 2. With just three photometric data points, large samples of galaxies can be classified as either quiescent or star forming!
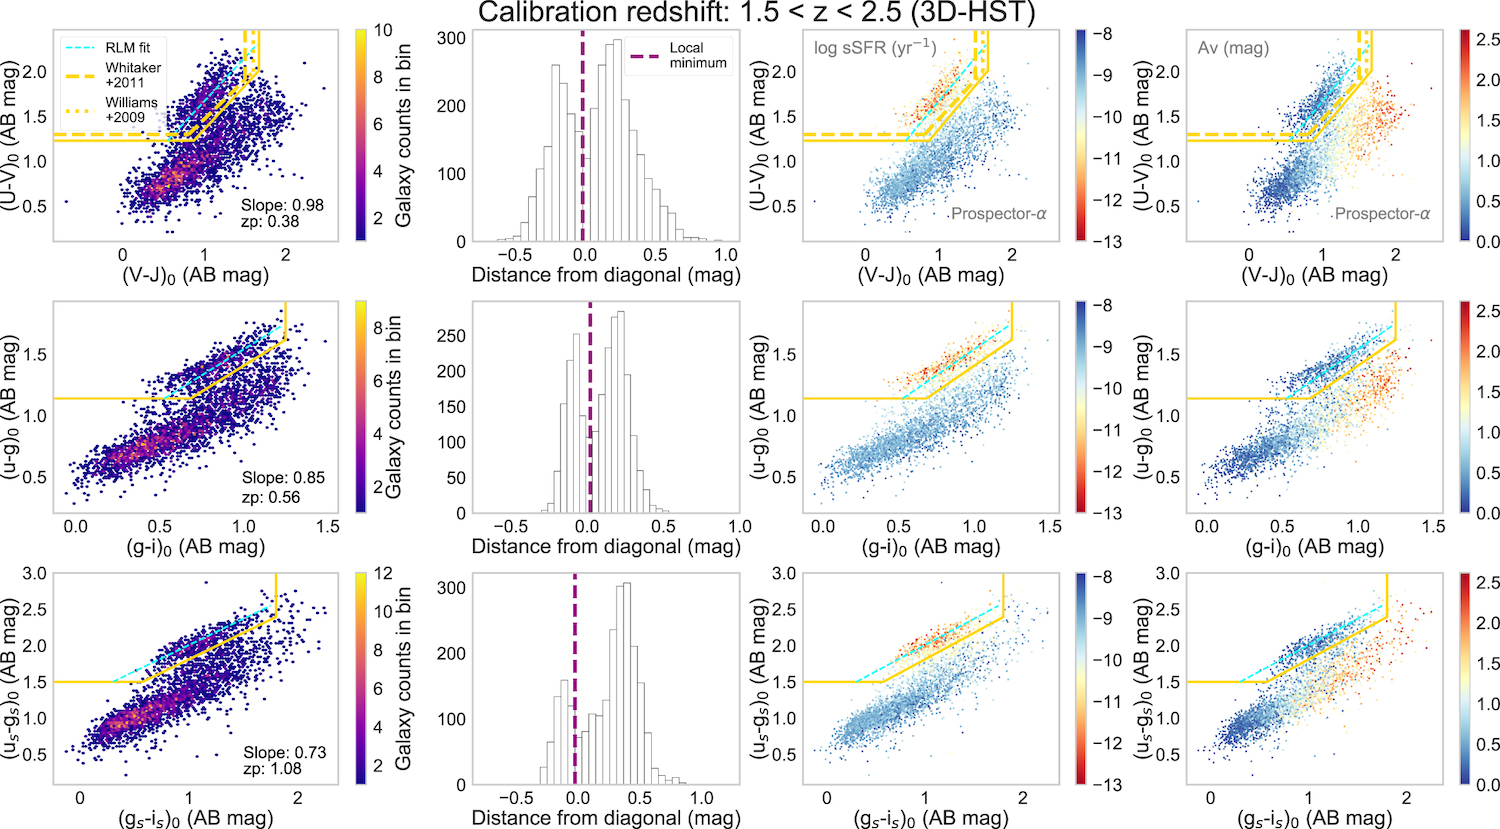
Figure 2: UVJ diagrams color coded by galaxy number, star formation rate divided by stellar mass (specific star formation rate, or sSFR), and extinction (Av) are shown in the upper panel. [Antwi-Danso et al. 2023]
A more robust way to determine whether a galaxy is actively forming stars is to look at its spectrum, which we can now do even with high-redshift galaxies using JWST! But spectroscopy is more costly than photometry, and we can characterize many more sources by relying on photometric data. To counter these problems, the authors of today’s article present a new photometric selection method using synthetic filters.
Getting Rid of the Star-Forming Imposters with Synthetic Filters
The authors introduce the synthetic filters us, gs and is, which correspond to the u, g, and i filters used by the Sloan Digital Sky Survey. These top-hat filters are narrow — so they avoid emission lines — but are well separated from one another, which makes this combination of filters capable of distinguishing between dusty star-forming galaxies and quiescent galaxies. Importantly for higher-redshift galaxies, the is filter overlaps with Spitzer/Infrared Array Camera channels and JWST/Near Infrared Camera (NIRcam) coverage, as seen for a galaxy at z = 4.5 in Figure 3.

Figure 3: In the second panel from the top, the synthetic filters us, gs, and is are shown with the spectral energy distribution of a galaxy at z = 4.5 with strong emission lines, while the locations of the traditional U, V, and J filters are shown in the bottom panel. The central wavelengths of the synthetic filters correspond with the Sloan Digital Sky Survey filters u, g, and i as shown in green in the third panel from the top. The synthetic filter is has better coverage by Spitzer/Infrared Array Camera channels (shown in the top panel) compared with the J band. Additionally, the synthetic filters avoid emission lines that overlap with the V band. The JWST instrument NIRcam goes out to 5 microns, which is the right edge of the Spitzer/Infrared Array Camera channel 2 in the top panel. [Antwi-Danso et al. 2023]
At all redshifts, but particularly at high redshifts, the (ugi)s selection outperforms UVJ in terms of contamination. In Figure 4, the completeness, contamination, and ratio of true to false positives is shown as a function of redshift for the sample of high-redshift galaxies from the JAGUAR catalog. At z = 6, ~60% of galaxies selected by UVJ as quiescent are star-forming — so the selected sample is mostly composed of frauds! By comparison, ~33% of the galaxies picked out by the synthetic filters are star-forming, a significant improvement.
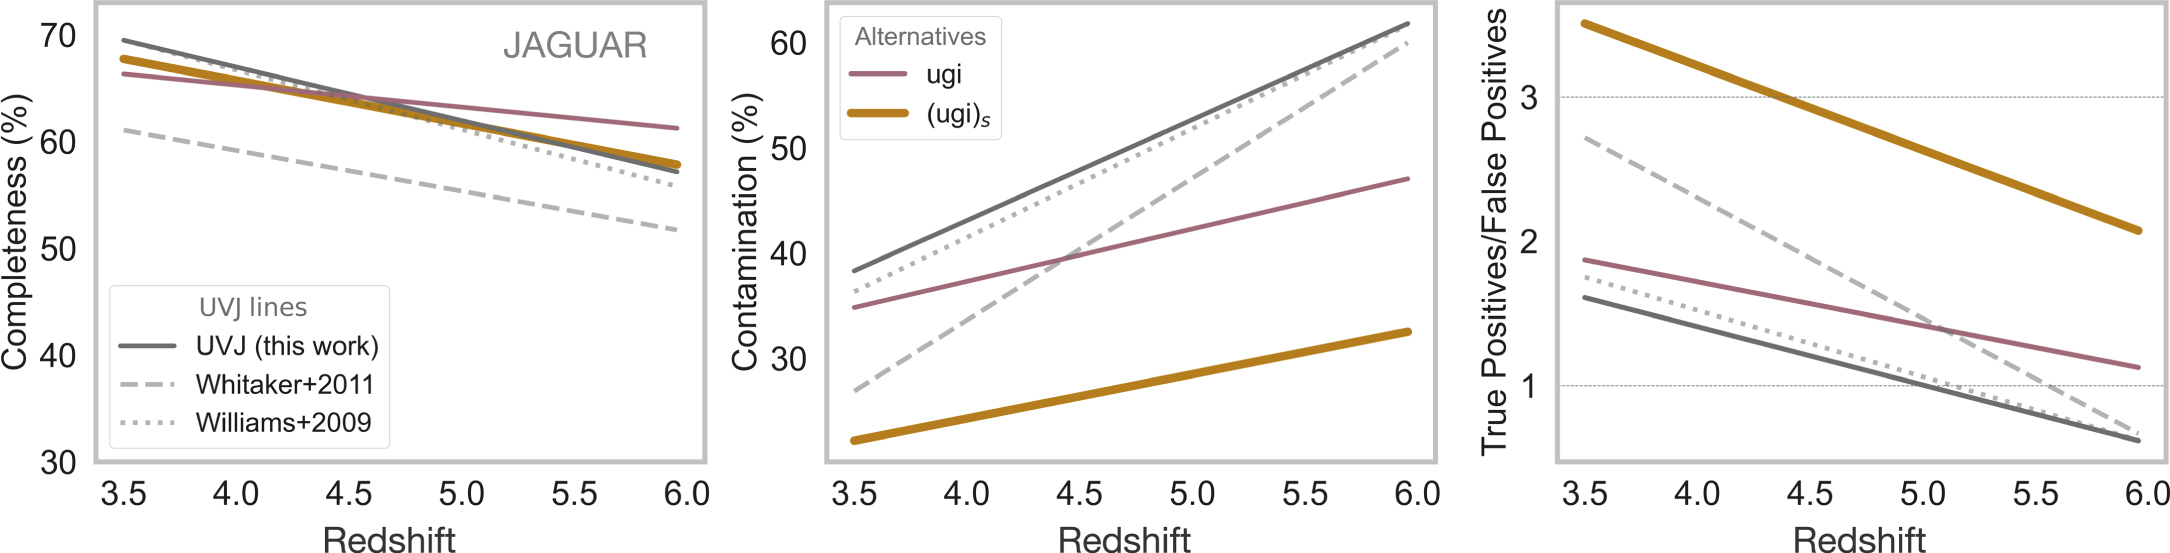
Figure 4: Completeness, contamination, and the true positive to false positive ratio as a function of redshift for the selections from UVJ (solid gray), ugi (pink), and the synthetic (ugi)s filters (orange). All three selections have similar completeness, but (ugi)s has lower contamination and a higher true positive to false positive ratio. [Antwi-Danso et al. 2023]
In the era of JWST, color selection methods to distinguish between star-forming and quiescent galaxies will likely continue to play an important role in studying galaxy evolution. The (ugi)s selection is promising for weeding out star-forming galaxies at higher redshifts, and the authors note that upcoming spectroscopic data from JWST will further test the efficacy of this method. By being able to select quenched galaxies at higher redshifts (z ~ 6), we may be exploring the first galaxies ever to quench!
Original astrobite edited by Ishan Mishra.
About the author, Sarah Bodansky:
I’m a first-year graduate student at the University of Massachusetts Amherst studying galaxies. My current research is focused on using observations to better understand the evolution of dust mass in star-forming galaxies. Outside of research, I enjoy reading, cooking, and hanging out with my cat.