
Editor’s note: Astrobites is a graduate-student-run organization that digests astrophysical literature for undergraduate students. As part of the partnership between the AAS and astrobites, we occasionally repost astrobites content here at AAS Nova. We hope you enjoy this post from astrobites; the original can be viewed at astrobites.org.
Title: Untangling the Galaxy I: Local Structure and Star Formation History of the Milky Way
Authors: Marina Kounkel, Kevin Covey
First Author’s Institution: Western Washington University
Status: Accepted to AJ
Despite our home planet being embedded in it, the Milky Way and its immediate environment remain an enigma to astronomy. Once thought to have few satellite neighbors, The Milky Way has been found to have many dwarf galaxies orbiting it. New stellar streams are being uncovered as well, likely remnants of past gravitational interactions with dwarf galaxies, in which the Milky Way pulled rivers of stars from its now-dissipated partners. This burst of discoveries of new nearby and entangled structures are thanks to advancements in technology allowing astronomers to observe dimmer objects and to track stars with greater precision.
Today’s paper utilizes one of these advancements, the much lauded Gaia mission, in tandem with machine learning methods to identify new substructures within the Milky Way and, in so doing, learn about its murky past.
Re-Clustering the Star Clusters
To begin, the authors are presented with the challenge of identifying stellar structures within the enormous Gaia dataset. In order to group stars together the authors use a clustering algorithm, which is a series of steps designed to isolate populations of objects with similar characteristics; the characteristics in question here are the stars’ coordinates within the Milky Way, their parallaxes, and their proper motions. A data sample of over 19 million stars are selected from the Gaia catalog, chosen to isolate stars for which the above characteristics are measured with high certainty. After much testing of the algorithmic parameters, the model returns over 1,900 star clusters, many of which have been independently identified in other studies. However, they also identify new structures that appear to have eluded other investigations (Figure 1).
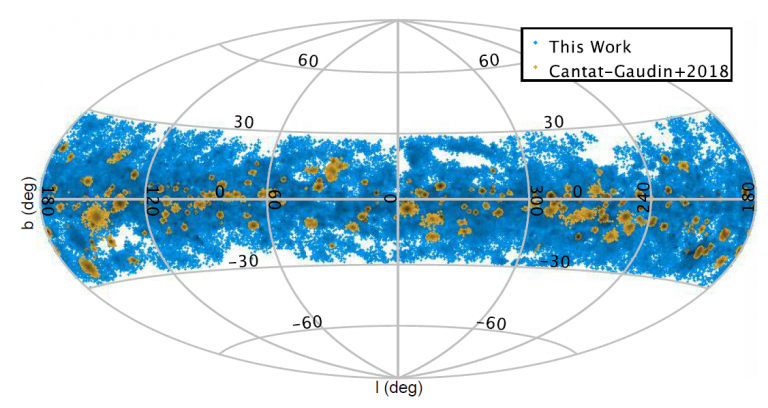
Figure 1: Map projection of the portion of the sky considered in today’s paper, with algorithm-identified star clusters marked in blue. Yellow markings indicate star clusters previously identified using different methods. Galactic coordinates are indicated with b and l. [Kounkel & Covey 2019]
The authors determine the ages of their identified clusters testing two separate methods: analysis by a convolutional neural network (CNN) and isochrone fitting. Training the CNN using both known real clusters and a multitude of artificial ones, they only reproduce the accepted ages of clusters in 44% of cases. Similarly, using isochrones alone is only successful in a minority of cases. Using the CNN age estimate as an input to their isochrone model, however, increases the success rate to 77%, so this methodology is used to obtain ages for the remainder of the work.
Finding Loose Strings
While investigating the distribution of their identified star clusters, the authors noticed that they tended to be distributed in long, narrow structures. These strings, as the authors call them, are about 200 parsecs in length and lie parallel to the plane of the Milky Way. They appear similar to stellar streams, but are these simply new streams, or something new entirely? The answer lies in a peculiar trend noticed by the authors: although these strings act very similarly to normal clusters in terms of their motion, they are markedly younger than the population of clusters as a whole (Figure 2).
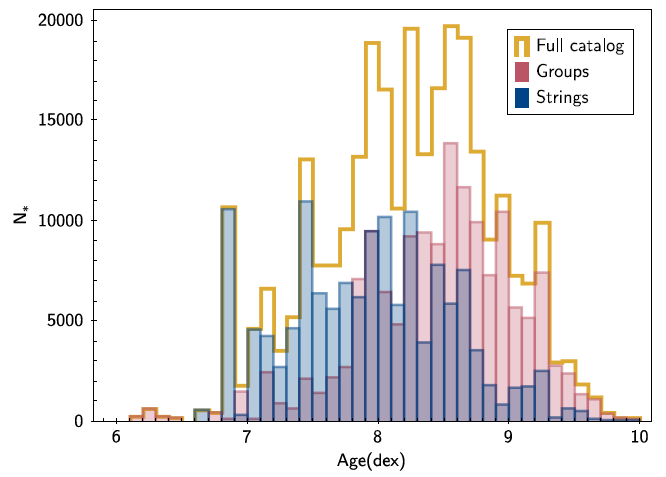
Figure 2: Histogram of the age distribution of the star clusters (called “groups” here) compared to the strings. Notice how the distribution of string ages appears to have lower ages. [Kounkel & Covey 2019]
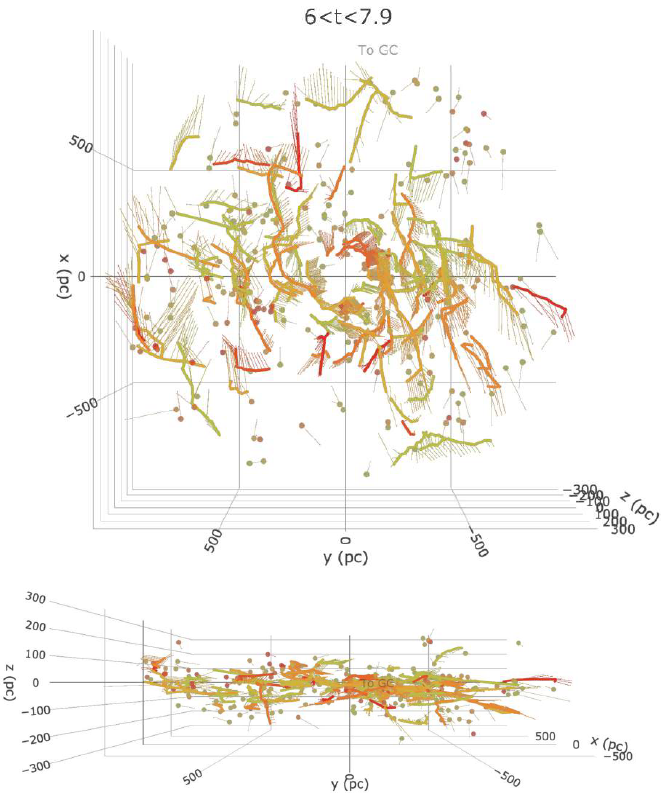
Figure 3: 3D plot of a subsample of the strings, where the thick lines represent the “spine” of the string and the thin lines perpendicular to the spine indicate the velocities of the stellar components of the string. Color indicates age, and a redder string is a younger string. Check out an interactive version of this plot on the Dr. Kounkel’s website. [Kounkel & Covey 2019]
If so, deeper analysis of these strings might provide a way of studying the past structure and star formation history of our home galaxy.
About the author, Caitlin Doughty:
I am a fourth-year graduate student at New Mexico State University. I use cosmological simulations to study galaxy evolution during the epoch of reionization, with a focus on metal absorption in the circumgalactic medium.