Features RSS

M31 and satellites

Though dark matter appears to be common in the universe, there’s still a lot we don’t know about it. A new study has now shed some light on this mysterious topic using faint satellite galaxies around the Milky Way.

Prolific Yet Unseen

dark matter

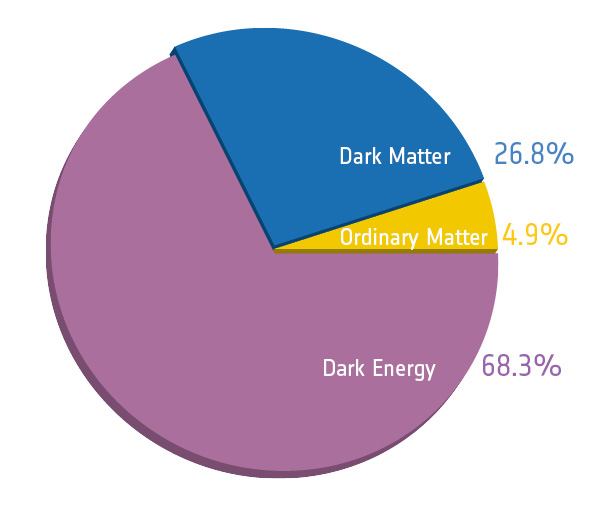
The relative amounts of the different constituents of the universe. Dark matter makes up roughly 27%. [ESA/Planck]

Our universe is composed almost entirely of dark energy, dark matter, and ordinary matter. While ordinary matter makes up a scant 5% of the universe, dark matter appears to be more common, accounting for 27%. But while dark matter reveals itself through its gravitational effects — adding bulk to galaxy halos that helps hold galaxies together and changes how they move, for instance — we’ve yet to detect it directly.

This challenge means that we’re still working to understand the nature of this unseen substance. Is dark matter made up of primordial black holes? An as-yet undiscovered subatomic particle? Or something else entirely? 

Abell 1689

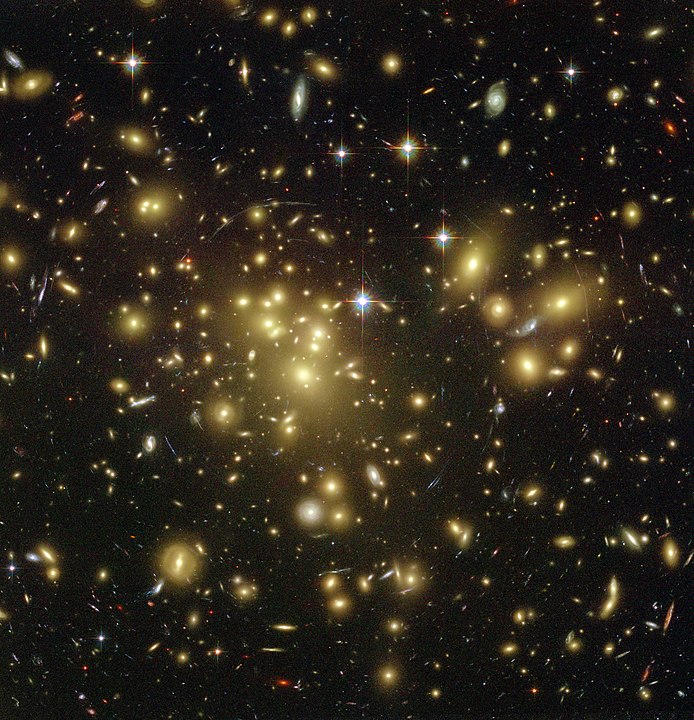
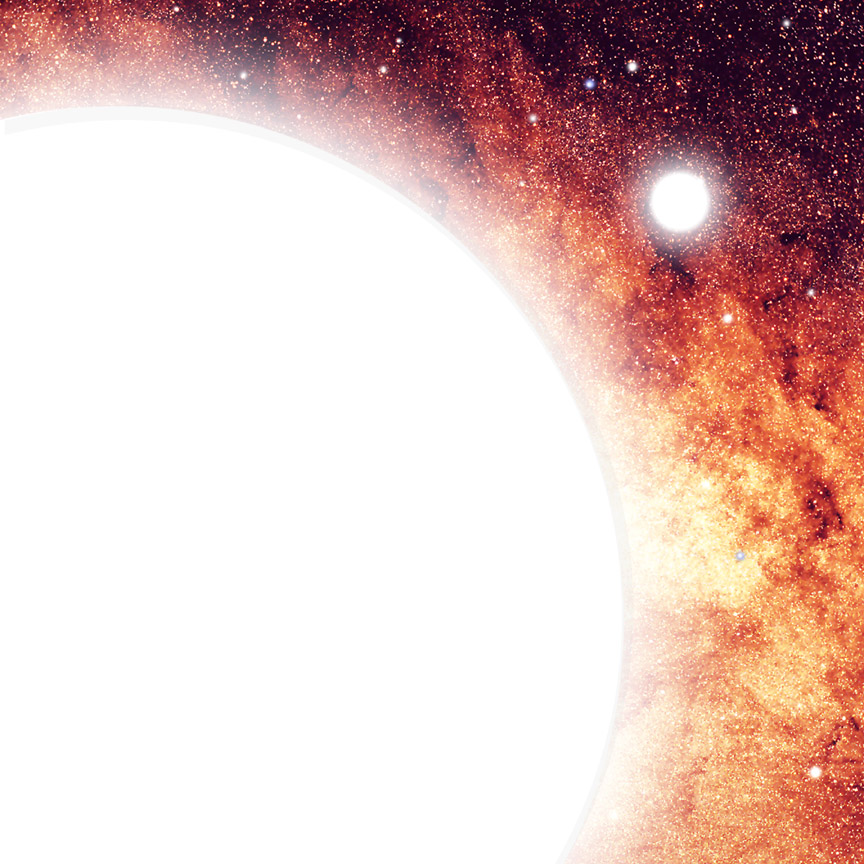
Strong gravitational lensing like that observed in this image of Abell 1689 provides evidence for dark matter, but we still don’t understand its nature. [NASA/N. Benitez/T. Broadhurst/H. Ford/M. Clampin/G. Hartig/G. Illingworth/the ACS Science Team/ESA]

The Hunt for the Right Model

Based on our observations and models of our universe, the standard picture of dark matter is the ΛCDM model, in which dark matter is described as cold (it moves slowly, forming structures only gradually) and collisionless (it doesn’t scatter off of ordinary matter, instead effectively passing through it).

The cold, collisionless dark-matter model has held up to a number of tests, and it neatly explains the large-scale structure of our universe. But some challenges to the model exist, and astronomers are still considering a number of alternative pictures.

In a new study led by Ethan Nadler (Kavli Institute for Particle Astrophysics and Cosmology, Stanford University), a team of scientists has now tested alternative theories by asking whether dark matter might not be collisionless, but instead interacts with ordinary matter.

Suppressing Structure

Nadler and collaborators point out that alternative models that treat dark matter as a collisional fluid come with a catch: in this picture, as dark matter scatters off of particles in the early universe, heat and momentum are transferred. This transfer smooths out perturbations in the distribution of matter, suppressing the very glitches that would later grow to become small-scale structure in the universe today.

In effect, the more that dark matter collides with baryons, the less small-scale structure there should be today — limiting the number of low-mass dark-matter halos in our galactic neighborhood and constraining how many small, faint galaxies reside within them.

dark-matter–proton scattering cross sections

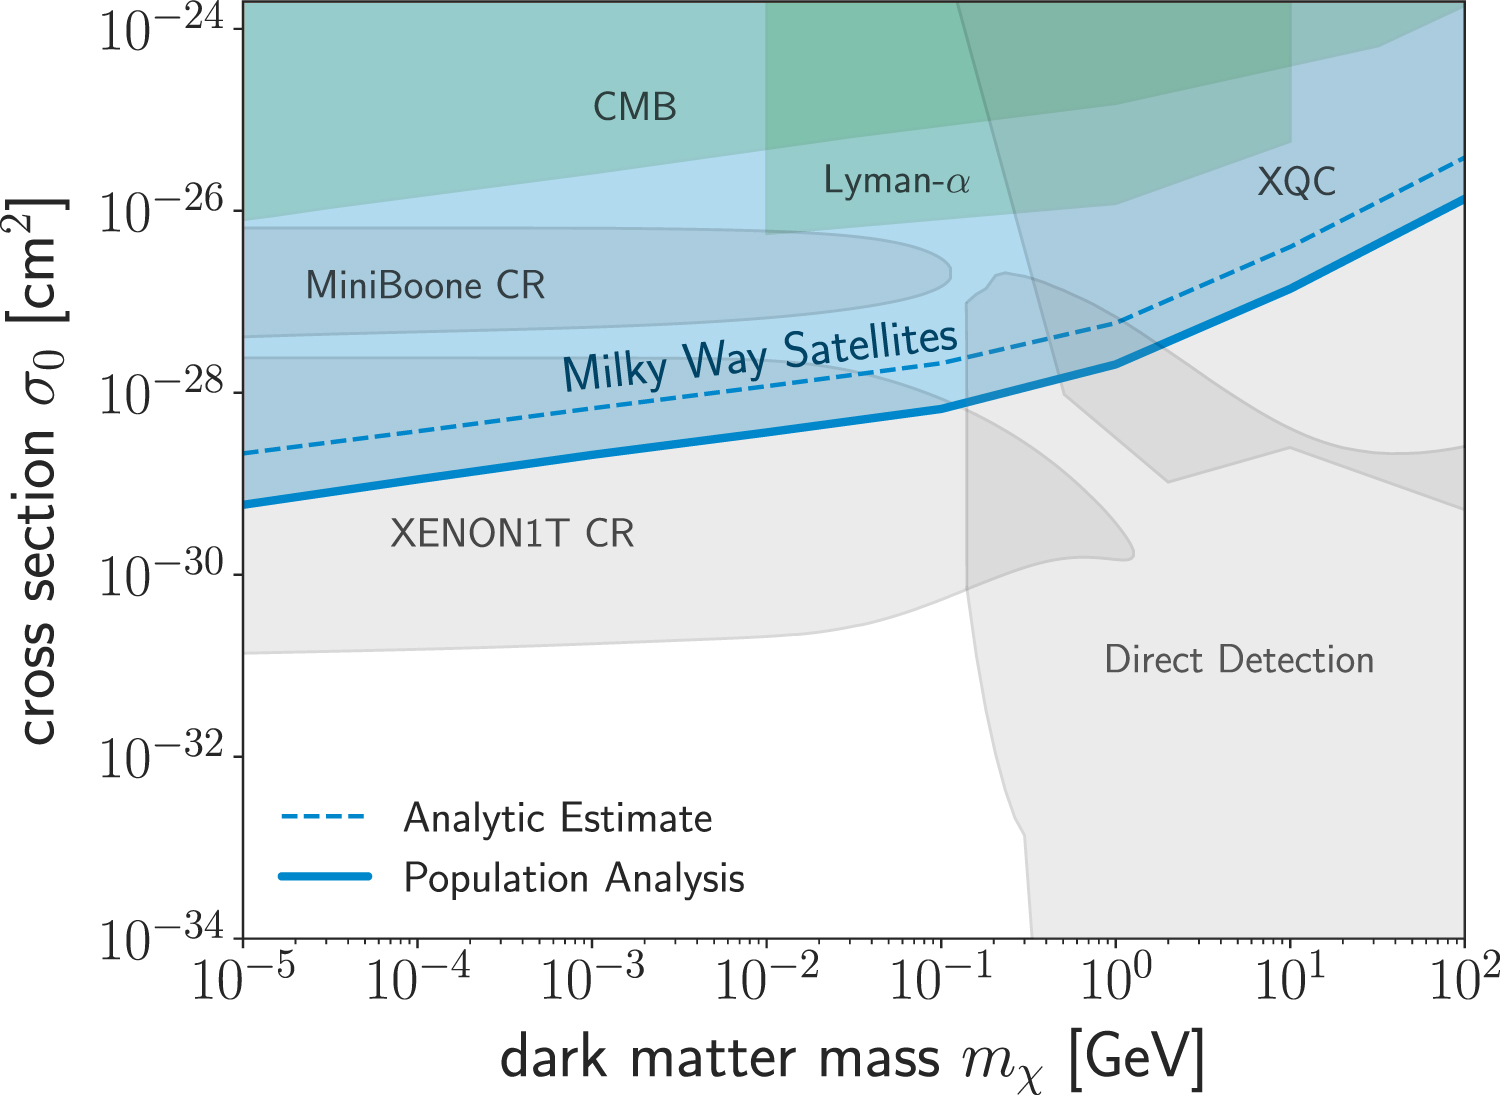
Upper limits on the velocity-independent dark-matter–proton scattering cross section as a function of dark-matter particle mass. The different shaded regions show values excluded by various observations. The blue shaded exclusion region is the new constraint placed by observations of Milky Way satellites in the current study. Click to enlarge. [Nadler et al. 2019]

Collisions Limited

So what do observations tell us? By combining the observed population of classical and Sloan Digital Sky Survey (SDSS)-discovered Milky-Way satellite galaxies with some clever probabilistic modeling of the population, Nadler and collaborators were able to place strict limits on the scattering cross sections for different-sized dark-matter particles, thereby constraining just how “collisional” dark matter can be.

The authors’ work continues to support the standard, collisionless picture of dark matter — but there’s plenty of room for deeper constraints. As data arrives from upcoming imaging programs like the Large Synoptic Survey Telescope (LSST), we’re sure to learn more about the small-scale structure of our surroundings and what it means for the nature of mysterious dark matter.

Citation

“Constraints on Dark Matter Microphysics from the Milky Way Satellite Population,” Ethan O. Nadler et al 2019 ApJL 878 L32. doi:10.3847/2041-8213/ab1eb2

Saturn's rings from Cassini

Saturn may appear calm and motionless from afar, but the immense planet is subtly pulsing and oscillating — and those oscillations impose a pattern on the planet’s rings that could tell us about Saturn’s history.

A Planet in Motion

Close-up of Saturn's rings

This extreme close-up of Saturn’s rings from Cassini shows the alternating dark and light bands of spiral density waves. [NASA/JPL-Caltech/Space Science Institute]

As the Cassini spacecraft orbited Saturn, it watched light trickle through the planet’s icy rings as they passed in front of distant stars. The flickering starlight revealed density waves — alternating stripes of compacted and loose material. Those density waves tell us much more than just what’s going on in the rings — they also tell us about the motions of Saturn’s surface.

Yanqin Wu (University of Toronto, Canada) and Yoram Lithwick (Northwestern University) combined observations and theory to study Saturn’s surface oscillations. They found that impacts from small objects were the most likely cause of the oscillations, with convection and atmospheric storms playing a minor role. Each of those impacts caused Saturn to “ring” like a bell, and the volume of the “sound” that we hear now depends on how hard it was struck, how many times, how long ago, and how quickly it fades.

Wu & Lithwick 2019 Fig. 4

Energies associated with different oscillation modes as derived from Cassini observations (black squares) and theory (colored circles and grey dashed line). While the impact theory matches the observations well for high l-values, it’s several orders of magnitude too low at low l-values. Alternative explanations, shown in the right-hand plot, match the data more closely at those low l-values. Click to enlarge. [Wu & Lithwick 2019]

Ringing Like a Bell

Saturn’s oscillations diminish as energy is carried away by the density waves in its rings, a process that can take up to 20 million years. By considering the expected frequency and size of impacts over that time period, the authors find that collisions in the distant past could have imparted enough energy to set Saturn ringing in the way we see today — with the exception of a few oscillation modes.

The authors explored several possibilities to explain the mismatch. Saturn could have experienced a once-in-a-million-year impact within the past 40,000 years — a so-called “lucky” strike. It’s also possible that some oscillation modes fade away more quickly than others or that energy is transferred between modes.

Another intriguing possibility is that those missing modes are excited not by impacts but by something more exotic: rock storms. These massive storms might begin deep within Saturn, where the atmospheric pressure is roughly ten thousand times higher than the pressure at Earth’s surface. Since it’s still not clear whether these massive storms actually exist, the authors acknowledge that the theory can’t yet be proved or disproved.

Wu & Lithwick 2019 Fig. 6

Simulations of two potentially observable signatures of the impact of a 150-km object: gravitational moments (left) and radial velocity (right). [Wu & Lithwick 2019]

From One Gas Giant to Another

Could oscillations be used to learn about the impact history of other planets? Since Jupiter lacks an extensive ring system to act as a dampener, any impact-induced oscillations would last far longer — potentially as long as billions of years — and we may be able to spot them.

To show this, Wu and Lithwick estimated how Jupiter would respond to a collision with a 150-km body a billion years ago. They found that the resulting changes in Jupiter’s gravitational field and surface velocity should be detectable by Juno and ground-based spectroscopy, respectively. With further study, we may be able to read the oscillations of Saturn and Jupiter to look back in time.

Citation

“Memoirs of a Giant Planet,” Yanqin Wu and Yoram Lithwick 2019 ApJ 881 142. doi:10.3847/1538-4357/ab2892

Coronal mass ejection

With energies a thousand times greater than an average solar flare, stellar superflares can strip away atmospheres and endanger life on planetary surfaces. These violent outbursts often go hand in hand with coronal mass ejections, shaping the evolution of planets near and far.

A Bit of Solar System History

Aurora borealis

Astronauts on the International Space Station captured this view of the aurora over Canada. [NASA]

In 1859, a solar storm launched a coronal mass ejection toward Earth. Named after one of the British astronomers who dutifully recorded the associated solar flare, the Carrington event is one of the most powerful solar storms to impact the Earth in recorded history.

Luckily for us, our middle-aged Sun rarely throws tantrums that explosive; if it happened today, the Carrington event would fry spacecraft electronics and power grids, causing trillions of dollars of damage.

In the Sun’s wilder youth, however, superflares were likely common. Studying younger Sun-like stars, like 700-million-year-old κ1Cet, can help us understand what the Sun was like billions of years ago — and what the planets orbiting young stars may be subjected to today.

Lynch et al. 2019 Fig. 5

Simulation of the coronal mass ejection magnetic flux rope propagating away from the star, as seen from the star’s north pole. [Lynch et al. 2019]

Simulating a Global Superflare

A team of astronomers led by Benjamin Lynch (University of California-Berkeley) used three-dimensional magnetohydrodynamic models to study the eruption of a superflare and a coronal mass ejection from the young Sun-like star κ1Cet.

They started with observations of κ1Cet’s surface magnetic field, then modeled how the stellar wind drags the magnetic field outward. By setting the star’s surface in motion, they caused the field lines to become twisted and tangled, building up the magnetic energy.

The magnetic energy gradually increased until reconnection kicked in and launched a coiled rope of magnetic flux into space. The eruption of the modeled coronal mass ejection lasted 10 hours and released a whopping 3 × 1026 Joules — about the same amount of energy estimated to have been released by the Sun in the 1859 Carrington event.

Lynch et al. 2019 Fig. 11

Radial cuts showing the speed (left) and density (right) of the coronal mass ejection. [Adapted from Lynch et al. 2019]

An Effect to Consider

Lynch and coauthors note that their model captures the most extreme superflare that κ1Cet can release based on past observations of the star’s surface magnetic flux. However, because starspots aren’t resolved in those observations, it’s possible that they could contain even more magnetic flux than expected, leading to even more energetic outbursts.

The authors hope that models of stellar superflares and coronal mass ejections can be used to understand how stellar activity affects planetary systems. They pointed to the importance of taking into consideration the effects of flares and coronal mass ejections on the habitability of exoplanets, not all of which are bad: when energetic particles from these events enter a planet’s atmosphere, they can generate compounds like hydrogen cyanide, which may play a role in the formation of the building blocks of life.

Citation

“Modeling a Carrington-scale Stellar Superflare and Coronal Mass Ejection from k1Cet,” Benjamin J. Lynch et al 2019 ApJ 880 97. doi:10.3847/1538-4357/ab287e

Pisces–Eridanus stellar stream

stellar stream

Artist’s impression of a stellar stream arcing high in the Milky Way’s halo. The Pisces-Eridanus stream has been discovered much closer to Earth than those illustrated here. [NASA]

Pisces–Eridanus may try to pass itself off as a billion years old, but scientists are calling its bluff. The Transiting Exoplanet Survey Satellite (TESS) has now carded this nearby stream of stars, revealing that it’s actually a relative baby!

Looking for Age

Stellar streams are faint associations of stars that were born together and move together, but they’ve been stretched into long tails across the sky. Some stellar streams likely originated as dense, compact clusters of stars that were pulled into streams by tidal interactions; others may have formed in a decentralized fashion and been spread further apart with time.

To understand the evolution of stars in streams and clusters, we use benchmarks: sample star clusters of different ages that we’ve explored in high detail. Unfortunately, most star clusters and associations that we can observe closely are young. Known older clusters all lie at larger distances — the 1-Gyr-old benchmark cluster NGC 6811, for example, is 3,600 light-years away — which limits what we can learn from them.

distance vs. age

Plot of distance vs. age for a selection of benchmark open star clusters. Pisces–Eridanus was originally identified as being 1 Gyr old (Meingast et al. 2019 red marker on the plot), which would make it the oldest cluster within 300 pc (~1,000 light-years). [Curtis et al. 2019]

Can I See Your ID?

It’s for this reason that the recent discovery of the Pisces–Eridanus stream — a faint stellar stream that spans 120° in the sky, is located just 260–740 light-years away, and was originally aged at 1 billion years — was met with a warm welcome. This unexpectedly close stream could prove to be a critical new 1-Gyr-old benchmark that would help us better understand stellar evolution.

Acting as bouncers for the 1 Gyr+ club, however, is a team of astronomers led by Jason Curtis (NSF Astronomy and Astrophysics Postdoctoral Fellow at Columbia University). They’ve set out to check that Pisces–Eridanus is as old as it initially led us to believe — and it turns out we’ve been deceived.

Revealing Rotation

Curtis and collaborators used TESS light curves of more than 100 members of the Pisces-Eridanus stream to identify how rapidly the stars are spinning. In a process called gyrochronology, the authors used the stars’ measured rotation rates to determine the age of the stream by comparing the distribution of rotation periods to the distributions for benchmark clusters with known ages.

rotation period distributions

Rotation period distributions for Pisces–Eridanus (red) and three benchmark clusters: 120 Myr Pleiades (blue), 670 Myr Praesepe (cyan), and 1 Gyr NGC 6811 (orange). Pisces–Eridanus stars clearly overlap with the Pleiades stars, indicating the two clusters have the same age. [Adapted from Curtis et al. 2019]

They found that Pisces-Eridanus’s distribution precisely overlapped the distribution for the stars of the Pleiades, indicating that these two groups are the same age: a mere 120 million years old!

Curtis and collaborators then used Gaia data combined with past radial-velocity measurements to hunt for new members of the Pisces-Eridanus stream. They identified 34 new high-mass candidate members — and the colors and brightnesses of these stars also support a young age of around 120 million years.

A Target for Planet-Hunting

Does the Pisces-Eridanus stream’s newly revealed youth mean that it’s no good to us after all? Not at all, according to Curtis and collaborators. One particular value of this stream is as an exploration ground in the hunt for exoplanets; planet discoveries here will allow us to learn about planet formation in a unique, diffuse environment.

What else have we learned? This study marks the first gyrochronology study conducted using TESS data — demonstrating the valuable role TESS has to play in the future as we continue to work to understand stellar and planetary birth and evolution.

Citation

“TESS Reveals that the Nearby Pisces–Eridanus Stellar Stream is only 120 Myr Old,” Jason L. Curtis et al 2019 AJ 158 77. doi:10.3847/1538-3881/ab2899

Barnard 68

Let’s be honest: the universe has an awful lot of gas. But the gas discovered in a new study isn’t your run-of-the-mill atomic gas! We’ve now found dense, star-formation-enabling molecular gas farther out than ever before.

A Crucial Ingredient

Carina Nebula

A Hubble view of a molecular cloud, roughly two light-years long, that has broken off of the Carina Nebula. [NASA/ESA, N. Smith (University of California, Berkeley)/The Hubble Heritage Team (STScI/AURA)]

Interstellar gas fills galaxies, lingering in the space between stars. Most of this material is in atomic form — primarily low-density ionized hydrogen and helium. But in some regions, conditions are right for atoms to join together into molecules, forming reservoirs of molecular gas. Less than 1% of the Milky Way’s interstellar medium is molecular gas by volume — yet this gas is critical to the galaxy’s development.

You can’t get star formation without molecular gas; this cold, dense material forms the fuel that can eventually collapse into hydrogen-fusing cores. This means that hunting molecular gas can give us insight into how galaxies build up and form their stellar populations: molecular gas reservoirs actively feed violently starbursting galaxies throughout the universe.

Molecular gas is also often associated with the host galaxies of distant quasars, supermassive black holes accreting vast amounts of matter and shining brightly. By studying the properties of this molecular gas, we can learn more about how supermassive black holes evolve with their host galaxies.

CO emission around PSO145+19

Intensity maps of CO line emission show two locations of molecular gas: PSO145+19 and PSO145+19N. The blue cross marks the location of the known quasar. Click to enlarge. [Koptelova & Hwang 2019]

Looking Back in Time

Because galaxy formation and evolution is very much a big-picture question, we might wonder how molecular gas was different in the early universe. Did early star-forming galaxies contain more molecular gas than today’s galaxies? What were the properties of the gas? How did early galaxies form and evolve, creating young stars and feeding their central black holes?

To answer these questions, we need to hunt for large reservoirs of molecular gas at high redshifts. But this is challenging! The most common component of molecular gas, molecular hydrogen, isn’t easily detectable. For this reason, we turn to carbon monoxide (CO) as a tracer of molecular gas reservoirs. 

So far, the most distant detections we’ve made of molecular gas using CO emission are at redshifts of z = 6–6.9. But now a pair of scientists from National Central University in Taiwan have looked even farther.

Drama of a Distant Interaction

Using observations of CO emission lines, Ekaterina Koptelova and Chorng-Yuan Hwang have discovered two sources containing molecular gas at a redshift of z = 7.09. That’s 13 billion light-years away, or from a time when the universe was just ~700,000 years old!

ALMA spectra of PSO145+19

ALMA spectra of PSO145+19 (top panels) and PSO145+19N (bottom panels) reveal spectral lines corresponding to CO emission and water emission. [Koptelova & Hwang 2019]

Koptelova and Hwang estimate the two molecular-gas sources to be roughly 27,000 and 41,000 light-years across. One of the two sources is coincident with a previously discovered quasar, and the other is located about 68,000 light-years to the side of the quasar — a very close neighbor, on cosmic scales!

The properties of the sources lead the authors to suggest that the gas may be tracing two or more star-forming galaxies that are interacting in the early universe. These colliding monsters contain reservoirs of molecular gas to fuel their star formation, as well as at least one quasar.

Future observations will hopefully confirm this picture and help us to better understand the role that molecular gas plays in the dramatic formation and evolution of galaxies in the early universe. 

Citation

“A Luminous Molecular Gas Pair beyond Redshift 7,” Ekaterina Koptelova and Chorng-Yuan Hwang 2019 ApJL 880 L19. doi:10.3847/2041-8213/ab2ed9

self-lensing

Though Kepler’s primary mission ended years ago, the resulting dataset remains a vast playground in which astronomers continue to discover new surprises in stellar light curves. The latest? Evidence of a white dwarf that defies all expectations.

Forming a Lightweight

ELM white dwarf

Artist’s impression of an extremely low-mass white dwarf (foreground) orbiting a more typical white dwarf (background). [CfA/David A. Aguilar]

White dwarfs come in a range of different sizes. A typical white dwarf might be around 0.6 solar mass and arise when an isolated star of perhaps a few times the mass of the Sun expands into a red giant, exhausts its fuel supply, and puffs off its outer layers, leaving behind its dead, dense core.

But some observed white dwarfs have much lower masses — say, between 0.15 and 0.3 solar mass. To produce such a small remnant mass, the mass of the initial progenitor star would also have to be very low. But this poses a problem: smaller stars take longer to evolve, so a star of such low mass would need longer than the age of the universe to exhaust its fuel supply!

Since isolated stellar evolution can’t explain extremely low-mass white dwarfs, astronomers have settled on another explanation: binary interactions. In this scenario, the close orbit of two stars in a binary results in material being stripped away from the progenitor star, accelerating its mass loss and allowing it to evolve into a very low-mass white dwarf.

So far, this explanation has fit our observations. But now, the discovery of a new low-mass white dwarf is challenging our understanding.

self lensing diagram

Example diagram of a different self-lensing binary system, KOI-3278. When the white dwarf passes between us and the primary star, gravitational magnification causes a brightening in the light curve that we detect. For KIC 8145411, we do not observe an occultation, because the light from the white dwarf is too faint to detect directly. [Eric Agol]

Self-Lensing Surprise

In a new publication, a team of scientists led by Kento Masuda (NASA Sagan Fellow at Princeton University) present the discovery of the binary system KIC 8145411 from Kepler data. This unique binary is one of only five known self-lensing systems: one object in the binary gravitationally lenses the light of the other as it passes in front once per orbit.

Masuda and collaborators use follow-up observations from the Fred Lawrence Whipple Observatory in Arizona and the Subaru telescope in Hawaii to pin down the properties of the system, confirming that we’re looking at a 0.2 solar-mass white dwarf orbiting a Sun-like star in an edge-on, eclipsing orbit.

But here’s the catch: KIC 8145411’s orbit is quite wide, at 1.28 AU (a period of ~450 days) — ten times too wide for the primary and the white-dwarf progenitor to have interacted in the way we’d expect. How, then, did this “impossible” white dwarf come to exist?

Tip of the Iceberg

white dwarfs in binaries

Masses of known white dwarfs in binaries and their orbital periods. The KIC 8145411 system is a clear outlier, having both a low mass and a very wide orbit. Click to enlarge. [Masuda et al. 2019]

Masuda and collaborators discuss a few proposed formation mechanisms — like interactions with a since-ejected or swallowed tertiary object — but none of them are especially satisfying.

So what’s next? The authors point out that we had only a 1 in 200 chance of detecting this particular system, due to its edge-on orientation — which likely means that KIC 8145411 is just the tip of the iceberg. Now that we know what we’re looking for, dedicated searches may turn up many more of these systems in the future — hopefully helping us to explain why this white dwarf is possible after all!

Citation

“Self-lensing Discovery of a 0.2 M White Dwarf in an Unusually Wide Orbit around a Sun-like Star,” Kento Masuda et al 2019 ApJL 881 L3. doi:10.3847/2041-8213/ab321b

black hole neutron star binary

There’s still a lot we don’t know about the internal structure and behavior of neutron stars, the compact remnants of giant, collapsed stars. Can the mergers of neutron stars with another type of exotic object, black holes, reveal important information?

Uncharted Remnants

gamma-ray bursts

Illustration of a short gamma-ray burst, which could be produced during the collision of a neutron star with a black hole. [ESO/A. Roquette]

Since neutron stars were first theorized, we’ve observed about 2,000 of them in the Milky Way and the Magellanic Clouds. Due to the exotic high-density conditions inside neutron stars, however, we still don’t well understand their interior structure and behavior.

A star’s internal properties are characterized by its “equation of state”. To better constrain the equation of state for neutron stars, we need accurate measurements of their masses and radii. But though we know that neutron stars are typically have the mass of a couple of Suns packed into a sphere of order 10 km in radius, it’s challenging to get precise enough radius measurements to constrain the equation of state for these dense, distant objects.

Can we do a better job of measuring neutron-star radii using future observations of merging neutron-star–black-hole binaries? A team of scientists led by Stefano Ascenzi (Tor Vergata University of Rome, INAF Rome Observatory, and Sapienza University of Rome, Italy) thinks the answer is yes — and in a new study, the team outlines how.

A Well-Marked Collision

It’s expected that the merger of a neutron star with a black hole would result in the destruction of the neutron star, the brief formation of a torus around the black hole as the neutron-star matter rains back down, and the rapid accretion of the torus.

This process would produce a pair of observable signals: 

  1. a gravitational-wave chirp from the merger, visible to detectors like the Laser Interferometer Gravitational-wave Observatory (LIGO) and its European counterpart Virgo, and
  2. a short gamma-ray burst (GRB) caused by the accretion of the torus.
equations of state

Example of how the various curves of mass vs. radius described by different neutron-star equations of state (colored curves) could be eliminated based on mass and radius measurements of a neutron star during a merger. In this test run, the authors’ injected neutron star properties are shown by the blue dot and the recovered properties are shown by the red dot. The red dashed lines show the 68% and 90% credible regions for the recovered properties — which, in this example, eliminate several of the possible equations of state. [Adapted from Ascenzi et al. 2019]

According to Ascenzi and collaborators, we can use these two signals in tandem to obtain information about the neutron star. Fitting the gravitational-wave signal of such a merger will reveal the neutron-star and black-hole masses, as well as the spin of the black hole. Measurements of the short GRB energy will tell us how much mass was in the torus that accreted onto the black hole.

The combination of this information allows us to infer the radius of the neutron star in the initial binary. Ascenzi and collaborators show that this method would let us estimate a neutron star radius to within 20% accuracy for a gravitational-wave detection with a signal-to-noise ratio of 10. For comparison, the signal-to-noise ratio for GW 170817, the first observed binary neutron star merger, was more than 30.

Looking for a New Type of Merger

How lucky do we have to get to observe a neutron-star–black-hole merger simultaneously in gravitational waves and electromagnetic radiation? Theory predicts these joint detections will perhaps occur at rates of 0.1 to 10 per year with current technology, and future telescopes and gravitational-wave detectors should increase our odds.

Here’s hoping these spectacular explosions will reveal more about neutron-star interiors soon!

Citation

“Constraining the Neutron Star Radius with Joint Gravitational-wave and Short Gamma- Ray Burst Observations of Neutron Star–Black Hole Coalescing Binaries,” Stefano Ascenzi et al 2019 ApJ 877 94. doi:10.3847/1538-4357/ab1b15

Beehive Cluster

Many people start to slow down as they age, and stars seem to be the same way. Astronomers measure how fast stars spin to determine their ages, but new measurements suggest that some stars may wind down more quickly than others.

Color-magnitude diagram

Color-magnitude diagram for globular cluster M55. Stars with masses higher than the turn-off point mass have lived long enough to evolve off the main sequence. [B.J. Mochejska, J. Kaluzny (CAMK), 1-m Swope Telescope]

Assigning Ages

It’s relatively straightforward to determine the age of a star that belongs to a cluster. The age of the cluster — and the stars that comprise it — is equal to the hydrogen-burning lifetime of the stars that are just about to swerve off the main sequence and balloon into red giants.

It’s much more challenging to measure the age of an isolated star. Astronomers rely on a method called gyrochronology — measuring a star’s age from the seemingly predictable slowdown of its rotation over time.

Stellar rotation periods appear to increase with the square root of the star’s age, but recent observations have hinted that that may not be true for all stars.

Evidence from Star Clusters

A team led by Jason Lee Curtis (Columbia University) studied F, G, and K stars to determine if the slowdown rate depends on mass. They used light curves from the Kepler spacecraft to measure the rotation periods of stars in NGC 6811, an open cluster in the constellation Cygnus. Curtis and collaborators used the observed rotation periods of the F and G stars in NGC 6811 to pinpoint the cluster’s age at 1.04 billion years.

Curtis et al. 2019 Fig. 5

Comparison of rotation periods for stars in NGC 6811 (blue, red, and cyan symbols) to models of Praesepe at 670 million and 1 billion years old (gray and black curves). The observed stellar rotation rates begin to diverge from the expected behavior around 5,400 K. [Curtis et al. 2019]

Next, they turned to a younger open cluster, Praesepe, which clocks in at around 670 million years old. Using a gyrochronology model derived from Praesepe’s observed stellar rotation periods, the authors artificially aged the cluster to 1 billion years old — the same age as NGC 6811. If all stars spin down the same way, the rotation rates of the artificially aged cluster should match those from NGC 6811.

Instead, although the rotation rates of the F and G stars from the two clusters matched neatly, NGC 6811’s lower-mass K stars were spinning faster than expected. In fact, they lined up almost perfectly with the K stars in the much younger cluster. In other words, while the F and G stars had slowed down with age, the K stars seemed to have not slowed down a bit in at least 330 million years.

Curtis et al. 2019 Fig. 7

Stellar ages derived from gyrochronology for NGC 6811 and the Hyades Cluster, compared to the 670-million-year-old Praesepe model. [Adapted from Curtis et al. 2019]

Why the Slow Pace?

One interpretation of this finding is that a star’s spin-down rate depends on its mass, with lower-mass stars winding down more slowly. However, the authors cautioned that it may not be that simple. Instead, they posited that stars experience a period during which their rotation rates don’t slow down — and lower-mass stars spend more time in this stalled spin-down state than higher-mass stars.

The authors aren’t sure what causes the stars to take a break from spinning down. They suggested that the stars either temporarily experience less magnetic braking or their outer layers gain angular momentum from their interiors.

Curtis and collaborators hope that studies of even older clusters, like 2.5-billion-year-old Ruprecht 147, will reveal at what point K dwarfs resume their usual spin-down and lead to a better understanding of how rotation rates can be used to determine the ages of stars.

Citation

“A Temporary Epoch of Stalled Spin-down for Low-mass Stars: Insights from NGC 6811 with Gaia and Kepler,” J. L. Curtis, M. A. Agüeros, S. T. Douglas, and S. Meibom 2019 ApJ 879 49. doi:10.3847/1538-4357/ab2393

atmospheric stripping

Can we use clues from the present to figure out how a planet has been blasted by the radiation of its host star in the past? According to a new study, it’s a definite possibility.

A History of Rotation and Radiation

rotation-period curves

Three example rotation-period curves show that stars can start with very different rotation rates and evolutionary tracks, but after 2 billion years, the tracks all converge. [Kubyshkina et al. 2019]

The history of a star’s radiation — its stellar flux evolution history — is important not just for what it tells us about the star, but also for the implications for nearby planets. Stars that emit large amounts of high-energy radiation early in their histories can wear away the atmospheres of fluffy, Neptune-like planets, leaving behind cores with thinner atmospheres like Earth’s or even no atmosphere at all.

How can we tell how much flux a star has historically emitted? This is tricky! We know that stars that rotate faster produce more high-energy radiation. But though stars are born with vastly different spin rates, they all lose angular momentum and spin down over time.

For a while, all these spin-down tracks are unique. But after about 2 billion years of slowing down, the tracks for stellar rotation evolution converge — if you’re looking at a star older than 2 billion years, you can no longer directly tell from its current properties how fast it rotated in the past, or how much flux it consequently emitted over its history.

But if a star has a sub-Neptune-sized planet in a close orbit? According to a new study led by Daria Kubyshkina (Austrian Academy of Sciences), we might then be able to make some inferences!

Clues from a Modern Atmosphere

For stars hosting close-in planets with hydrogen-dominated atmospheres, a bit of creative modeling of a planet’s atmospheric evolution can allow us to infer its host’s flux evolution history.

recovery of injected signal

Recovery of an injected signal in the authors’ analysis. In this example, the mass of the planet is assumed to be exactly known. The posterior distributions for the other parameters of the system (blue curves) well match the prior distributions of the input parameters (red curves). From top to bottom, the parameters are the stellar rotation period at 150 Myr, age of the system and present-time rotation period, and orbital separation and stellar mass. [Adapted from Kubyshkina et al. 2019]

The amount of hydrogen atmosphere a planet has left later in its life — which can be estimated from the planet’s observed radius — reveals how much stellar flux it has received over its lifetime. Kubyshkina and collaborators build a framework that combines this information with knowledge about the system’s properties today to make a best guess at the star’s entire flux evolution history. The more parameters we know for the system, the better its history can be constrained.

Hunting Down Masses

This framework has applications beyond just understanding the past rotation and radiation of the host star.

Say we observe a system containing multiple planets; here one planet mass is well known, but the others are not. Under the authors’ analysis, the mass of the first planet can be used to place strong constraints on the rotation history of the star. But this history can then be used in conjunction with the observed radii for the system’s other planets to obtain realistic estimates for their masses!

The authors show the power of this analysis by applying it to two known planetary systems, HD 3167 and K2-32, inferring the rotation history of the two stars and constraining the masses of the planets in the systems. Their work clearly demonstrates the importance of advances in theory and modeling to help us get the most out of our growing body of exoplanet observations.

Citation

“Close-in Sub-Neptunes Reveal the Past Rotation History of Their Host Stars: Atmospheric Evolution of Planets in the HD 3167 and K2-32 Planetary Systems,” D. Kubyshkina et al 2019 ApJ 879 26. doi:10.3847/1538-4357/ab1e42

galaxy formation model Meraxes

Astronomy is driven forward by a combination of novel observations and complex, inventive modeling. How can astronomers better analyze their models? A new study presents a tool for the job — and is also the first article published under a new partnership between the American Astronomical Society (AAS) and the Journal of Open Source Software.

Exploring a Complex Universe

Modeling complicated astronomical systems is an important part of how we work to understand the universe. As technology advances, models have become increasingly more complex, encompassing more and more parameters. Complex models can do a better job of describing the astronomical systems we observe, but they’re also more challenging — and time-consuming — to analyze to see how well they might fit data.

model reconstructions

Reconstruction of a multi-Gaussian model with 12 parameters using two techniques: normal MCMC parameter sampling (right column) and hybrid PRISM+MCMC parameter sampling (left column). The reconstruction is shown as a blue solid line, and the true model is shown as a dashed black line. The different rows represent increasing iterations. The hybrid reconstruction fits the known data better after fewer iterations — effectively analyzing the model 16 times faster than the normal MCMC approach. Click to enlarge. [van der Velden et al. 2019]

One approach astronomers often use to analyze many-parameter models is Markov Chain Monte Carlo (MCMC) methods. With MCMC methods, instead of fully evaluating a model throughout parameter space, you randomly sample the model in a variety of places. This provides a general idea of the behavior of the model without requiring the time and computing investment of a full analysis.

While MCMC methods are generally robust, they can be quite slow — you might spend a lot of time sampling uninteresting parts of parameter space rather than focusing on the ones that are most likely to describe your system. To address this problem, a team of scientists led by Ellert van der Velden (Swinburne University of Technology and ARC Centre of Excellence in All Sky Astrophysics, Australia) have developed a new tool: a software package they call Probabilistic Regression Instrument for Simulating Models, or PRISM.

Let’s Speed Up the Process

How does PRISM work? When given a model to analyze, PRISM uses clever statistical methods to create an approximation of the model and iteratively predict which regions of parameter space aren’t of interest. This allows the user to home in on the interesting regions and explore the general behavior of a model very quickly. This algorithm can be used either alone or in conjunction with MCMC methods to analyze models more efficiently.

PRISM’s approach isn’t new: these techniques have previously been used to analyze models in a variety of scientific disciplines, including the study of whales, oil reservoirs, galaxy formation, disease, and biological systems. But PRISM takes the techniques and neatly bundles them up into a python software package that anyone can use to analyze their models — a valuable tool for astronomers and other scientists alike!

JOSS logo

The Journal of Open Source Software is a developer friendly, open access journal for research software packages. [JOSS]

A New Partnership for Software

Want more assurance about this software? You’ve got it! Van der Velden and collaborators’ article on PRISM, published in ApJS, is just one of a pair of publications; the second is the scrutinized software itself.

Under a new agreement between the AAS and the Journal of Open Source Software (JOSS), scientists submitting articles about astronomical software to AAS journals may choose not only to have their article reviewed, but also to have the software itself reviewed at JOSS in parallel. When both review processes are complete, the reviewed software is linked with the paper describing it in AAS journals.

The article presenting PRISM is the first of these simultaneous reviews to be conducted and published, and we expect many more to come! Software plays such an integral role in the study of astronomy today, and AAS publishing is pleased to help ensure that these valuable tools are shared.

Citation

“Model Dispersion with PRISM: An Alternative to MCMC for Rapid Analysis of Models,” Ellert van der Velden et al 2019 ApJS 242 22. doi:10.3847/1538-4365/ab1f7d

“Model dispersion with PRISM; an alternative to MCMC for rapid analysis of models,” van der Velden 2019 Journal of Open Source Software, 4(38) 1229. doi:10.21105/joss.01229

1 67 68 69 70 71 115