Features RSS

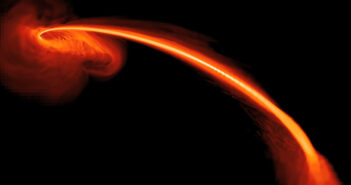
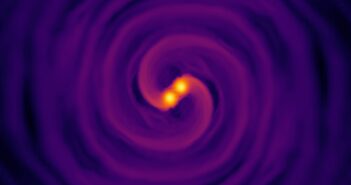
illustration of two neutron stars spiraling toward each other

In May of last year, an international collaboration of astronomers and physicists switched on a set of detectors and began the most intensive search for gravitational waves ever attempted. They did not have to wait long for a new discovery that challenges our understanding of the extreme universe: just days into their campaign, the scientists caught the signal from the smallest black hole ever detected by their observatories, one that is so light it couldn’t have formed according to our typical models. After a year of analysis, the scores of scientists involved in this remarkable find have just published their work in The Astrophysical Journal Letters.

How To Warp Spacetime

Although gravitational waves, or ripples in spacetime caused by collisions between massive objects, have permeated the universe since its very beginning, scientists have only been able to directly measure them since 2015. Since then, we’ve learned much about these waves and the objects that source them, and we’ve built up a pretty clear picture of what it takes to wrinkle space itself.

photograph of the LIGO Hanford gravitational wave detector

A gravitational wave detector. Ripples in spacetime cause the two arms to change lengths by tiny amounts, and scientists detect passing waves by carefully measuring these distortions. [Caltech/MIT/LIGO Lab]

In short, you need a pair of enormously heavy objects to smash into each other at high speeds. Two types of objects will do the trick: neutron stars, or the exotic remains of supernova explosions, and the more massive and more infamous black holes.

Neutron stars, as best we understand from theoretical models and observations taken with radio and X-ray telescopes, can weigh up to about 3 times the mass of the Sun and are formed when a large star explodes. Black holes, on the other hand, are typically heavier. They weigh more than 5 times the mass of the Sun, and they’re thought to form when a large star collapses in on itself.

Putting these two facts together, it’d be very strange to identify an object that’s between 3 and 5 solar masses: anything in that gap would be too heavy to be a neutron star, but too light to be a black hole. And yet, that’s exactly what the international collaboration found: the collision between a 1.4-solar-mass neutron star and a 3.6-solar-mass black hole, making the latter an inhabitant of the so-called “mass gap.”

A Rule-Breaking Merger

The inferred masses of each component of a handful of gravitational wave mergers. The “mass gap” is marked in light grey, and the likely mass of the primary component of this event, GW230529, lies nearly entirely within it. [A. G. Abac et al 2024]

Their merger, named in the traditionally catchy parlance of astronomers as GW230529_181500, was a real surprise. Though the collaboration has a total of four gravitational wave detectors at its disposal, only one saw the signal: the newest, named KAGRA, is not sensitive enough to spot an event this faint, while VIRGO was undergoing upgrades at the time and one of the two LIGO sites had been switched off only an hour and a half too soon to catch the show. This lack of detector backup, combined with the weirdness of the implied progenitor, left the team with a lot of work to do to prove that what they were seeing was real.

In the end, the event passed all of their tests. The wave was detected by three independent analysis pipelines, and although the choices that go into modeling the collision can affect the inferred mass, most reasonable options all point to the same conclusion: the observed gravitational wave really does seem to have come from an impossibly light black hole and its merger with a typical neutron star. This proof-by-contradiction that small black holes exist implies that there are probably plenty of them, which happily means we can look forward to additional head-scratching detections of similar pairs in the future.

Citation

“Observation of Gravitational Waves from the Coalescence of a 2.5–4.5 M⊙ Compact Object and a Neutron Star,” A. G. Abac et al 2024 ApJL 970 L34. doi:10.3847/2041-8213/ad5beb

Hubble image of the Flame Nebula

visualization of a turbulent flow

Visualization of the plume from a candle transitioning from a smooth flow near the wick to a turbulent flow higher up. [Gary Settles; CC BY-SA 3.0]

Turbulence — the culprit behind bumpy airplane rides, breaking waves, and billowing clouds — happens throughout the universe. Modeling realistic turbulent plasmas is difficult and computationally expensive, but new methods make simulating turbulence easier, faster, and more flexible than ever before.

A Chaotic Challenge

In the accretion disks around supermassive black holes, the clouds of molecular gas where stars are born, and even the atmosphere of the Sun, turbulence plays an important role in transferring energy and mixing plasmas. Because turbulent plasmas are so common, researchers across astronomical fields must wrestle with the challenge of modeling these chaotic systems.

The traditional way to model a turbulent system is to do so numerically: churning through sets of equations to track the behavior of a plasma across tiny time increments. But as models become more complex, this comes at a higher computational cost, requiring an increasingly large number of hours for computers to handle the math.

representation of a simulated three-dimensional turbulent magnetic field

A representation of a typical three-dimensional turbulent magnetic field generated by BxC. [Adapted from Maci et al. 2024]

Synthetic Magnetic Fields

Synthetic models that use relatively simple algorithms to generate realistic plasmas provide an alternative. Recently, Daniela Maci (KU Leuven) and collaborators introduced a new synthetic model of turbulent magnetic fields. The team’s model builds on an existing synthetic model called BxC, a Python-based code that speedily produces three-dimensional turbulent magnetic fields.

To generate realistic turbulence, BxC starts with a random field of vectors based on white noise. From there, this vector field is tweaked and transformed to adjust its statistical properties. In practice, this means that not only do BxC’s synthetic fields look turbulent, they also reproduce the expected statistical properties of a turbulent field, setting BxC apart from other models. This makes BxC an excellent jumping-off platform for creating realistic turbulent magnetic fields, and Maci’s team showed how the statistical properties of the modeled field depend on the model’s inputs.

Paths Forward

simulation results showing turbulence that develops on top of a background magnetic field

Examples of simulated turbulence that develops on top of a background magnetic field. Click to enlarge. [Adapted from Maci et al. 2024]

To make the synthetic fields more applicable to astrophysical plasmas, Maci’s team expanded upon the original code in a couple of key ways. First, they recognized that turbulence often develops on top of a background magnetic field, and they developed a way for turbulence to be applied while maintaining the underlying structure of the field. This applies to magnetic field structures like loops or flux tubes, both of which are seen in the atmosphere of the Sun. Second, they developed a way to incorporate anisotropy, or a difference in the strength of the turbulence with regard to direction.

This work demonstrates the power and flexibility of synthetic models for representing turbulent magnetic fields — and all of these features are available orders of magnitude faster than they would be from a traditional numerical model. The team anticipates making future additions to their model, all of which would give the user more customization options and make the model applicable to more astrophysical scenarios.

Citation

“BxC Toolkit: Generating Tailored Turbulent 3D Magnetic Fields,” Daniela Maci et al 2024 ApJS 273 11. doi:10.3847/1538-4365/ad4bdf

photograph of NGC 3621, the host galaxy of SN 2024ggi

Less than a year after SN 2023ixf captivated astronomers worldwide, another nearby supernova burst onto the scene. At a distance of just 22 million light-years, SN 2024ggi provides another excellent opportunity to study the behavior of red supergiant stars in their final years.

Live Fast, Die Spectacularly

The discovery of a new nearby supernova marks the beginning of a cosmic chase. After astronomers pinpoint a rapidly brightening point of light in a distant galaxy — a new supernova! — they hunt through archival data to learn more about the star that exploded. Using this method, researchers have tracked down dozens of supernova progenitor stars and have learned that core-collapse supernovae usually arise from red supergiant stars with masses in the range of 8 to 18 solar masses.

Supernova hunters have been busy recently: while the dust was still settling from SN 2023ixf — the nearest bright supernova in nearly a decade — the Asteroid Terrestrial-impact Last Alert System discovered the supernova SN 2024ggi on 11 April 2024 in the galaxy NGC 3621. This marks the first time a supernova has been recorded in this galaxy, which is just barely more distant than SN 2023ixf’s host galaxy. What can archival observations tell us about this supernova’s progenitor star?

Archival Analysis

optical and infrared pre-explosion images of the progenitor star of SN 2024ggi

Images of SN 2024ggi’s progenitor from Hubble (top row) and Spitzer (bottom row). [Xiang et al. 2024]

A team led by Danfeng Xiang and Jun Mo (Tsinghua University) turned to observations from the Hubble and Spitzer space telescopes to track down SN 2024ggi’s progenitor. In Hubble images from 1994 to 2003, the team spotted an extremely red star at the location of SN 2024ggi. The star’s reddish hue is likely due to dust that formed around the star in cast-off stellar material.

In Spitzer images of NGC 3621 from 2004 to 2019, the same star is faintly visible but crowded by other stars. By carefully removing the light from the star’s close neighbors, the team was able to monitor the star’s brightness over many years. They found that its brightness varied at both infrared and optical wavelengths with a period of about 378 days. This type of variability is common in red supergiant stars and is likely due to radial pulsations.

Surprisingly Dust Free

Xiang and Mo’s team also plotted the star’s spectral energy distribution, or how its energy output is spread across different wavelengths of light. They used two classes of models to interpret the spectral energy distribution: one model that included a veil of dust around the star and one that was dust free.

observed and modeled spectral energy distributions for the progenitor star of SN 2024ggi

Observed spectral energy distribution of SN 2024ggi’s progenitor star (black squares). The lines show the best-fit spectral energy distributions for the model with dust (red) and without dust (gray). [Adapted from Xiang et al. 2024]

These models suggested that the star had a mass around 13 solar masses and its temperature was a cool 3290K. Surprisingly, given the star’s extremely red color, the dusty and dust-free models both fit the data well, suggesting that the dust shell around the star was thin.

The thinness of the dust shell implies a low mass-loss rate for the star in the decades before its explosion, but researchers studying the subsequent supernova found the star’s mass-loss rate just before its demise to be much higher. This might mean that while SN 2024ggi’s progenitor shed mass at a modest rate during most of its life, it shed far more mass in its final years. This finding adds to the growing body of evidence that red supergiants undergo stellar tantrums before their ultimate explosions.

Citation

“The Red Supergiant Progenitor of Type II Supernova 2024ggi,” Danfeng Xiang et al 2024 ApJL 969 L15. doi:10.3847/2041-8213/ad54b3

Illustration of a supermassive black hole accreting gas from its surroundings

How do supermassive black holes get so massive? New simulations show how black holes might have grown rapidly in the early universe.

deep-sky image of galaxies

A deep-sky image from JWST. The inset shows the galaxy JADES-GS-z14-0, which is currently the most distant known galaxy. This image shows how the galaxy looked less than 300 million years after the Big Bang. [NASA, ESA, CSA, STScI, B. Robertson (UC Santa Cruz), B. Johnson (CfA), S. Tacchella (Cambridge), P. Cargile (CfA)]

Black Holes as Far as Our Telescopes Can See

When JWST first examined galaxies in the early universe, it discovered something extraordinary: galaxies just a few hundred million years after the Big Bang are home to black holes, and these black holes are massive.

How these black holes grew to millions or billions of times the mass of the Sun so quickly is an open question, but most theories fall into two general categories: these early black holes either sprouted from stellar-mass pips that bulked up at a prodigious rate, or they got their start as more massive black holes that grew at a more modest rate. Other, more speculative origin stories invoke exotic forms of dark matter or supermassive stars. All options face serious challenges, and many researchers turn to simulations to find a way forward.

Captured by Clusters

Yanlong Shi (California Institute of Technology and University of Toronto) and collaborators used simulations to test a way for young black holes to become supermassive in short order. The simulations began with 100 million solar masses of gas collected in a cloud about 330 light-years across, representative of a dense star-forming clump in an early galaxy.

simulation snapshots showing the different stages of black hole growth

Gas density (colored areas), star locations (cyan dots), and selected black hole locations (black stars) during three stages of the simulated evolution. These images show how the growing black holes are captured by tight star clusters and transported to the center of the cloud. From there, an accretion disk forms and channels gas to the black holes. Click to enlarge. [Shi et al. 2024]

Into this cloud the authors randomly scattered black hole seeds with masses between 100 and 10,000 solar masses. At first, the black hole seeds grew randomly as they encountered and devoured dense clumps of gas. But at some point, the black hole seeds were captured by nearby massive star clusters. From there, the black holes went along for the ride, trapped within the gravitational wells of the star clusters that migrated toward the center of the cloud. The black holes reached the center of the cloud much faster than if they were not shepherded by star clusters.

Once the black holes reached the center of the cloud, their growth kicked into a whole new gear. Now attracted by a deep gravitational potential well, gas from throughout the cloud sank toward the central black holes and swirled together in an accretion disk. The magnetic field threaded throughout the disk prevented the disk from fragmenting and forming new stars. In about a million years, the two fastest-growing black holes had grown to more than 2 million solar masses.

Connecting the Little Red Dots

plots showing the movement and growth of star clusters and black holes from the simulations

Another illustration of the movement and growth of the black holes. The leftmost image shows the capture of the black holes by the star clusters and the motion of these captured black holes to the center of the cloud. The images on the right show the masses and mass ratios of selected star clusters and black holes over time. Click to enlarge. [Shi et al. 2024]

This scenario appears to provide a path forward for the formation of supermassive black holes in the early universe. In particular, it shows how the capture of a black hole by a star cluster rapidly puts the black hole into prime position to accrete large amounts of gas from its surroundings. The magnetically stabilized accretion disk then provides a way for the black holes to accrete faster than the Eddington limit — the theoretical limit beyond which the outward pressure of radiation generated by accretion overpowers the inward pull of gravity.

The team’s simulations may yield a clue to the solution of another cosmic mystery. Near the end of the simulation, the assemblage of young stars and massive black holes has similar properties to the unusual “little red dot” galaxies spotted by JWST just 700 million years after the Big Bang.

While Shi’s team hopes to explore the observational implications of their model results further, the predictions will likely be difficult to test, requiring telescopes to pierce the dense, dusty gas that obscures the inner galactic regions where black holes grow.

Citation

“From Seeds to Supermassive Black Holes: Capture, Growth, Migration, and Pairing in Dense Protobulge Environments,” Yanlong Shi et al 2024 ApJL 969 L31. doi:10.3847/2041-8213/ad5a95

illustration of a flaring magnetar

Astronomers have discovered two fast radio bursts with eerily similar signals. What’s the likeliest cause of these twin bursts?

Mysterious Bursts

Artist's impression of a pulsar

Artist’s impression of a neutron star, the core of a massive star that has exploded as a supernova. [ESO/L. Calçada; CC BY 4.0]

Fast radio bursts are powerful flashes of radio emission that last anywhere from less than a millisecond to a few seconds. Astronomers have detected roughly 1,000 fast radio bursts from outside our galaxy and a single burst from within the Milky Way. Exactly what causes these bursts is up for debate, and supernovae, colliding black holes, and neutron stars — the extremely dense city-size remnants of massive stars — are all in the running.

As researchers attempt to parse the similarities and differences among the growing sample of radio bursts into a coherent theory of their origins, a curious pair of bursts has arrived on the scene. What can we learn from a nearly identical pair of bursts?

plot of normalized flux for two fast radio bursts

The flux profiles of the 2018 (red) and 2021 (blue) bursts. The flux has been normalized to the peak intensity of each burst. Note that the times on the horizontal axis have been normalized to the time between the burst components. [Bera et al. 2024]

Twins from Extragalactic Space

In 2018, the fast radio burst FRB 20181112A arrived at Earth after a journey of billions of light-years, announcing itself with a prominent 0.2-millisecond flash of radio waves and a second, subtler signal just one millisecond later. In 2021, FRB 20210912A was discovered, looking oddly familiar: it too was marked by an initial bright component and a later faint component.

Apurba Bera (Curtin University) and collaborators examined this pair of bursts to understand how deep their similarities go. Using data from the Australian Square Kilometre Array Pathfinder, Bera’s team showed that the relative emission timescales — for example, the ratio of the width of the bright signal to the width of the faint signal — are remarkably similar.

The absolute timescales of the bursts are slightly different, which the team suggests could be due to their different travel times. The 2018 burst arrived from a redshift of z = 0.4755, but the 2021 burst’s redshift is unknown. If the 2021 burst occurred at a redshift of z = 1.35 — possible, given a previous estimate of z = 1.18 ± 0.24 — the absolute timescales would be identical as well.

Possible Origins

normalized flux and position angle for two fast radio bursts

Normalized flux density and polarization position angle (PA) for the 2021 (top) and 2018 (bottom) bursts. The “A” panels show the total intensity (I), the intensity of linearly polarized light (L), and the intensity of circularly polarized light (V). Click to enlarge. [Adapted from Bera et al. 2024]

As for other similarities, both bursts are strongly polarized, meaning that the light waves were oriented in a nearly uniform direction as they traveled through space. In both cases, the polarization direction changed between the first part of the burst and the second.

Bera and coauthors note that the properties of the twin burst pair match what they’d expect for a magnetized neutron star rotating with a period of 1.1 milliseconds. This is faster than the most rapidly rotating neutron star known, and it’s just below the hypothetical limit on neutron star rotation. This may point to the existence of a sub-class of fast radio bursts arising from neutron stars spinning near the maximum rate.

The majority of fast radio bursts appear just once, but a few dozen are known to repeat. If the 2018 and 2021 bursts studied here fall into the latter category, it could help solve the mystery of their origin: the slow but steady spin-down of a rapidly rotating neutron star would leave a detectable mark on the radio signal.

Citation

“The Curious Case of Twin Fast Radio Bursts: Evidence for Neutron Star Origin?” Apurba Bera et al 2024 ApJL 969 L29. doi:10.3847/2041-8213/ad5966

An aerial photograph looking down on two large telescopes.

It seems natural that stars would spin in the same direction as, and nicely aligned with, their planets. Recent work, however, shows that might not be the case if the star in question is particularly hot.

Toppled-Over Stars

When we picture planets moving around their host stars, we usually imagine them as perfect spheres traveling along perfect circles aligned within a perfect plane. Reality, unsurprisingly, is messier than this ideal image. Some objects, like Mars, maneuver on orbits that look more like ovals than circles, while others, most famously Pluto, drift above and below everyone else on orbits that are tipped over relative to the bulk of the solar system. The closer you look, the more jumbled everything appears: while that’s maybe disappointing from an aesthetic point of view, astronomers thrive in this chaos and latch onto every irregularity they can in order to explain how a given system came to be.

An illustration of the many angles used to describe a star’s orientation. The star’s true obliquity is marked by Ψ. [Louden et al. 2024]

One property astronomers love to measure is the angle between a star’s spin axis and the orbits of its planets, also known as its obliquity. Our Sun sets a good example as a mostly-aligned host star: its north pole is tipped over a modest 7 degrees from the rest of the solar system, a slant larger than that of the leaning tower of Pisa but still respectively close to upright. About a decade ago, however, astronomers began to realize that not all stars were as well behaved. While in general stars are more likely to be aligned with their planets’ orbits than not, a good fraction of the hotter stars seemed to be nearly randomly oriented without any care for what’s circling them.

This was an intriguing but difficult to confirm finding, since the traditional ways of measuring obliquity required a tricky procedure and lots of telescope time. Researchers came up with an alternative, faster way to approximate the measurement, but progress was still slow and it was difficult to assemble an unbiased sample of stars. Since it was easier to measure the obliquities of cool stars with large planets, astronomers simply hadn’t attempted to analyze many hot stars with small companions.

New Observations

That’s where Emma Louden (Yale University) and collaborators came in. Over the course of several months, Louden and the team periodically commandeered the High Resolution Echelle Spectrometer (HIRES) instrument on the Keck I telescope to collect spectra of nearly 500 stars. Some of their targets had planets while others did not, though the barren systems were otherwise indistinguishable from their planet-hosting counterparts and formed a crucial control sample for the analysis. Since the team was aiming to fill in gaps of previous catalogs, they went after numerous hot stars and stars with planets smaller than Jupiter. After vetting their candidates and cleaning up their data, they were left with a sample that had 500% more hot stars than any previous attempt, and 50% more cool stars for good measure too.

A summary plot of the findings. Histograms on the right show the projected inclinations of different subsets of the sample, while the scatterplot on the left shows the full sample. Circles outlined in black denote planets around hot stars. Click to enlarge. [Louden et al. 2024]

The team found that the trend noticed years ago does indeed seem to hold up to this stronger statistical pressure test: hot stars, regardless of the size of their planets, tend to be more misaligned than cool stars. Going further, they also took advantage of their larger sample and looked for trends with other properties, finding weak evidence that planet period might also correlate with stellar misalignment. However, even though their sample was larger than any previously assembled, it isn’t large enough to do more than hint at this additional find.

Still, knowing that hot stars seem to misbehave in almost all circumstances does put some pressure on our theories of planetary formation and evolution. While there is still no clear-cut winner, and as the authors note, likely more than one mechanism is at play, we’re beginning to understand what’s more and what’s less likely to have happened to these tipsy, boiling stars and their planets.

Citation

“A Larger Sample Confirms Small Planets around Hot Stars Are Misaligned,” Emma M. Louden et al 2024 ApJL 968 L2. doi:10.3847/2041-8213/ad4b1b

X-ray image of Kepler's Supernova remnant

Observations of Type Ia supernovae underpin our measurements of distances to other galaxies and even our understanding of the expansion of our universe. There’s just one problem: researchers still don’t know exactly how Type Ia supernovae happen. New research explores what a Type Ia supernova in an unusual environment could tell us about the source of these explosions.

Studying Supernovae

Illustration of a white dwarf accreting gas from a red giant companion star

Accretion from a companion star onto a white dwarf is one way to trigger a supernova. [Still image from an animation by NASA’s Goddard Space Flight Center Conceptual Image Lab]

Type Ia supernovae happen in binary systems containing at least one white dwarf: the crystallized core of a low- to intermediate-mass star. In theory, Type Ia supernovae happen when a white dwarf grows larger than 1.4 solar masses and explodes.

But research increasingly points to more than one way for white dwarfs to reach this limiting mass — two white dwarfs in a binary system could collide, or a white dwarf could bulk up by accreting matter from a stellar companion. The exploding white dwarf may not even need to reach 1.4 solar masses: if a thin shell of helium siphoned from a companion star ignites on the surface of a white dwarf, it could trigger a second, catastrophic detonation in the white dwarf’s core, regardless of the white dwarf’s mass. Pinpointing these different scenarios is critical to interpreting Type Ia supernova observations.

How can we examine the progenitor of a Type Ia supernova explosion? Researchers can’t just sift through archival observations after a Type Ia supernova to see what caused it, since white dwarfs in other galaxies are too faint to see — and we haven’t spotted a Type Ia supernova in our own galaxy since 1604. We need a different approach to uncover the origins of these explosions.

Cluster Candidate

In a recent article, Joel Bregman (University of Michigan) and collaborators proposed a path forward: find a Type Ia supernova in a globular cluster. Globular clusters are roughly spherical collections of tens of thousands to millions of stars that orbit within a galaxy’s halo. Because all stars in a globular cluster have roughly the same age and composition, the age and composition of the stars involved in the explosion could also be known — even if we can’t observe the stars directly.

Hubble Space Telescope image of supernova SN 2019ein

The location of the supernova SN 2019ein relative to the globular cluster candidate. Click to enlarge. [Bregman et al. 2024]

Bregman’s team searched for records of a Type Ia supernova occurring within about 100 million light-years in a galaxy with globular clusters. The team pinpointed one promising candidate: SN 2019ein, which was discovered in May 2019 on the outskirts of the elliptical galaxy NGC 5353. The supernova popped up far from the center of this galaxy but close to a faint object that may be a globular cluster.

Detonation Scenarios

Hubble observations show that the supernova happened about 192 light-years from the globular cluster candidate. Statistical tests suggested that the supernova is likely associated with the cluster — the authors put the odds of a chance alignment at 3% — allowing researchers to use the age and composition of the cluster to constrain the properties of the supernova progenitor system.

There’s another interesting wrinkle that could further constrain the identity of the progenitor: given the large separation between the supernova and the candidate cluster, the star going supernova may not have been bound to the cluster when the explosion happened. In this scenario, dynamical interactions between binary systems could have kicked the supernova progenitor system out of the cluster, which is more likely if both stars in the binary were white dwarfs. Then, after careening through space for 3–10 million years, 1) the white dwarfs collided or 2) one white dwarf stole a thin layer of helium from the other, leading to a two-stage detonation on its surface and in its core.

The proposed scenario is rare but not impossible, but there’s not yet enough data to draw firm conclusions. This study highlights the challenge of studying the origins of Type Ia supernovae and shows what can be gained by seeking supernovae in unusual places.

Citation

“A Type Ia Supernova near a Globular Cluster in the Early-Type Galaxy NGC 5353,” Joel N. Bregman et al 2024 ApJL 968 L6. doi:10.3847/2041-8213/ad498f

artist's impression of the first stars in the universe going supernova

The galaxy RX J2129–z8He II is remarkable for its high redshift, sloped spectrum, and strong emission lines. New research suggests that the elusive first stars could be responsible for the galaxy’s properties.

The Hunt for the First Stars

Long ago, the universe was substantially less picturesque than it is today; neutral hydrogen gas absorbed all visible light and rendered the universe opaque. When the first stars glimmered into existence and assembled into the first galaxies, they began to chip away at the opaque universe, carving out increasingly large bubbles of transparent gas.

The nature of the first stars, also called Population III stars, is of great interest to astronomers, but tracking them down is easier said than done. While galaxies composed only of the first generation of stars may be out of reach, shielded from view by clouds of neutral gas, galaxies in which Population III stars mingle with later stellar generations might be easier to spot.

Thirteen Billion Years Ago in a Galaxy Far, Far Away

JWST image of the galaxy RX J2129–z8He II

JWST image of the galaxy RX J2129–z8He II, which is gravitationally lensed by the foreground galaxy cluster RX J2129. [Wang et al. 2024]

Recently, a research team led by Xin Wang (University of Chinese Academy of Sciences) may have identified such a galaxy. Using images from JWST, Wang and collaborators picked out the galaxy RX J2129–z8He II, which even in the eyes of the world’s most powerful infrared telescope is a barely discernible red smudge. JWST spectra of this galaxy place it at a redshift of z = 8.1623, just 613 million years after the Big Bang. At this time, stars and galaxies were still busily ionizing the universe, transforming it from opaque to transparent.

RX J2129–z8He II’s spectrum is tilted sharply toward short wavelengths, more so than any other known galaxy beyond a redshift of z = 7, and it’s marked by several prominent emission lines, including one from singly ionized helium atoms. These factors suggest that the galaxy contains a powerful source of ultraviolet radiation. In the local universe, emission from singly ionized helium is somewhat rare, arising from massive stars that have lost their atmospheres, binary systems containing a star and either a black hole or a neutron star, and galaxies with accreting supermassive black holes. None of these sources are likely to be the cause of the galaxy’s helium emission line. Instead, Wang’s team posits, massive Population III stars could be the source of the ionizing ultraviolet photons.

plot of the spectrum of the galaxy RX J2129–z8He II

JWST spectrum of RX J2129–z8He II, with an inset image showing the He II line. The flux increases toward shorter wavelengths before being attenuated by the intergalactic medium (IGM). Click to enlarge. [Wang et al. 2024]

Are Population III Stars Responsible?

To test this theory, Wang’s team used photoionization models to simulate the properties of a galaxy containing Population III stars as well as stars from later generations. They found that a collection of Population III stars with a total mass of 780,000 solar masses could reproduce the observed emission lines in the galaxy’s spectrum. Previous modeling suggests that this quantity of Population III stars is reasonable for a galaxy at that time period.

As for how a galaxy could host Population III stars alongside their stellar descendants, Wang’s team suggests that new Population III stars could form belatedly in pockets of pristine gas that weren’t swept up into stars in the first round of star formation, or in gas that spilled into the galaxy from the surrounding circumgalactic medium.

This study marks a promising advance in the search for the first generation of stars. In addition to identifying RX J2129–z8He II as a possible home for Population III stars, Wang’s team gained a better sense for the spectral signatures of these stars, which can be used to identify other galaxies that may host them.

Citation

“A Strong He II λ1640 Emitter with an Extremely Blue UV Spectral Slope at z = 8.16: Presence of Population III Stars?” Xin Wang et al 2024 ApJL 967 L42. doi:10.3847/2041-8213/ad4ced

spiral galaxy NGC 6744 as seen by Euclid

Small galaxies in the early universe might have had centers dominated by dark matter. New research dives into cosmological simulations to explore what these galaxies would look like in the universe today and what this might mean for the Milky Way’s dark matter past.

Dark Matter History of Small Galaxies

Recently, a research team led by Anna de Graaff (Max Planck Institute for Astronomy) used JWST to examine six small, low-mass galaxies in the early universe. They discovered something surprising: the centers of these galaxies appeared to be dominated by dark matter, a hypothetical form of matter that neither emits nor absorbs light, among other strange qualities. Though dark matter is thought to make up roughly 85% of the matter in our universe, research shows that the cores of massive galaxies in the universe today contain mostly normal matter.

To check whether the intriguing new JWST observations match our theoretical understanding of the universe’s evolution, and to explore how these dark matter–dominated galaxies might evolve to the present day, de Graaff and collaborators turned to TNG50: a massive cosmological simulation that tracks the universe from its infancy to today.

Enter the Simulation

plot comparing the fraction of normal matter in the cores of galaxies in the TNG50 simulation and the galaxies observed with JWST

Comparison of the fraction of normal matter (fbaryon) in the cores of galaxies in the TNG50 simulation (small circles) to the galaxies observed with JWST (large hexagons). Click to enlarge. [de Graaff et al. 2024]

Using TNG50, the team selected 381 simulated galaxies with redshifts and stellar masses similar to the real galaxies in the JWST sample. They found that the lower-mass galaxies in the simulated sample — those with stellar masses less than about 300 million solar masses — had centers dominated by dark matter, containing just 10–30% normal matter by mass. The higher a galaxy’s stellar mass, the higher the fraction of normal matter in the galaxy’s center.

This result agrees well with what de Graaff’s team observed in real galaxies with JWST, though the team pointed out that it’s possible that the galaxies they studied with JWST only appear to have dark matter–dominated cores. For example, if the gas in these galaxies’ centers is disrupted by outflows from newly forming stars, it could skew the estimate of the amount of dark matter present. Because the simulated galaxies do have dark matter–dominated cores, this finding suggests that this may be a real phase in galaxy evolution.

plot showing how the dark matter fraction evolves with redshift for simulated and observed galaxies

Redshift evolution of the core dark matter fraction. The colored line and shaded areas show the results from the TNG50 simulation, while the colored symbols show the results from observational studies. Click to enlarge. [de Graaff et al. 2024]

Following Evolving Galaxies

What would these early dark matter–dominated galaxies look like later in the universe’s history? Going forward in time in the simulation, the galaxies merged and grew, dwindling from 381 galaxies to just 213 due to mergers. At a redshift of z = 3 — during a period called cosmic noon, when star formation was at its peak — the low-mass dark matter–dominated galaxies had grown to contain 10 billion solar masses of stars, similar in size to other galaxies spotted in that time period.

By the present day, these same galaxies had packed on additional stellar mass, reaching about 30 billion solar masses of stars — roughly equal to the mass of stars in the Milky Way — and their centers no longer contained mostly dark matter. While more work is needed to explore this scenario, this suggests that the Milky Way and galaxies like it in the universe today were once small, low-mass galaxies with dark matter cores.

Citation

“An Early Dark Matter–Dominated Phase in the Assembly History of Milky Way–Mass Galaxies Suggested by the TNG50 Simulation and JWST Observations,” Anna de Graaff et al 2024 ApJL 967 L40. doi:10.3847/2041-8213/ad4c65

A photograph of an asteroid on a black background. Superimposed on the asteroid's surface is a colormap that ranges from red to green, denoting the reflectance.

The Double Asteroid Redirection Test (DART) mission marked humanity’s first attempt to alter the course of an asteroid, a technique that could one day avert a catastrophic impact and save countless lives. But to fully understand the outcome of the experiment and to determine the impact of the human-caused impact, astronomers need a detailed characterization of their target. A recent study aims to bridge observations taken by DART moments before its demise and those taken from back on Earth in order to measure surface properties that neither dataset could constrain alone.

Intentional Collision and In-Situ Measurements

In September 2022, NASA’s DART spacecraft approached a near-Earth asteroid named Didymos and its moon, Dimorphos. With cameras trained on Dimorphos specifically, DART took pictures with ever-increasing resolution as the distance to the moon’s surface steadily shrank. Unfortunately for both DART and Dimorphos, though, this was not a flyby mission. Instead of changing course, DART plowed straight into the moon with enough momentum to dig a fresh crater and to change the satellite’s orbital period by more than 30 minutes.

A greyscale photograph of a rocky surface.

The surface of Dimorphos, as seen by the DART spacecraft 2 seconds before impact. [NASA/Johns Hopkins APL]

The main purpose of this intentional collision was to test if it’d be possible to redirect an asteroid’s path through a brute-force impact. This is a potentially humanity-saving skill, should astronomers ever discover a large asteroid destined to collide with Earth absent a dramatic intervention, and scientists involved with the mission want to be confident that everything they learn from this single collision is applicable to any future high-stakes redirections. To more confidently extrapolate the results of this test to larger asteroids with structures and compositions that might differ from Dimophos’s, astronomers need to measure every material property of this one asteroid that they can.

Some of these properties are best measured from up close to the asteroid, and the images beamed back by DART moments before its abrupt end contain much useful information. Others, though, such as how the surface scatters light, are better constrained by observing the asteroid from many different angles, which one can do by taking observations from Earth over many months. By combining these different types of measurements, a fuller picture emerges than could be built by either dataset alone.

Adding in Ground-Based Observations

A scatter plot of phase angle vs absolute brightness showing a tight linear relationship.

The solar phase curve of Dimorphos as measured from Table Mountain Observatory. [Buratti et al. 2024]

This combination is what Bonnie Buratti, Jet Propulsion Laboratory, and collaborators accomplished in a recent study. The researchers took observations from Table Mountain Observatory of the Didymos/Dimorphos system over about five months in order to build a solar phase curve, or how the brightness of the two asteroids changes with respect to our viewing angle. This allowed them to build a particle phase function, or a model of how the surface scatters light. Then, by poring over and reprocessing the DART images, Buratti and colleagues were able to quantify the surface roughness of the asteroid, a property that would have been impossible to disentangle from the phase function without the extra information gathered from the ground.

This synthesis demonstrates that although the missions we send up to gather exquisite in-situ data, sometimes important, fundamental properties require patient observations from back home as well. In 2026, the European Space Agency’s Hera spacecraft will arrive at Didymos to survey the damage, and analysis of its data will rely heavily on context learned through studies like these in the intervening years.

Citation

“Pre-impact Albedo Map and Photometric Properties of the (65803) Didymos Asteroid Binary System from DART and Ground-Based Data,” B. J. Buratti et al 2024 Planet. Sci. J. 5 83. doi:10.3847/PSJ/ad2b60

1 20 21 22 23 24 120