
Editor’s Note: This week we’re at the 234th AAS Meeting in St. Louis, MO. Astrobites and AAS Nova will be working together to publish updates on selected events at the meeting this week; the usual posting schedule for AAS Nova will resume next week.
Plenary Lecture: Transiting Exoplanets: Past, Present, & Future (by Susanna Kohler)
The remarkable thing about planet transits, says Joshua Winn (Princeton University), is the incredible wealth of information we can obtain from simple blips of light. “Transits are by far our richest source of information about planets,” he pointed out in the opening of his plenary — transits can reveal not just properties like masses or periods of planets, but also surprising details like the composition of planet atmospheres or the obliquity of the host star.

Transit data from Kepler (bottom) compared to data from a ground-based telescope of comparable size (top).
The field of transit study has a long history, but it exploded in 2009 with the launch of the Kepler mission. Kepler studied a small patch of sky just above the galactic plane for roughly four years, building up a large sample of planet candidates that could be used to statistically explore the population of exoplanets in our galaxy for the first time. The data quality possible with Kepler was a huge step up from the observations we’d gathered from ground-based telescopes — which allowed for the detection of additional features in transit light curves that could tell us more about unusual systems.
Winn shared with us a few of his favorite weird Kepler systems, which include:
- Kepler-89, in which we observe a planet being eclipsed by another planet as the two bodies transit their host star
- Kepler-36, a system challenging our understanding of planet formation, since it contains two planets that lie at very nearly the same orbital radius but are vastly different in nature: one is a dense, rocky super-Earth, whereas the other is a fluffy, gaseous mini-Neptune
- Kepler-16, a star with a bizarre light curve that turns out to be perfectly explained by a circumbinary planet transiting across the faces of both of its hosts

Comparison of TESS’s planned coverage of the sky (blue) compared to Kepler’s coverage (yellow).
“As much as we love the Kepler mission, it did have one tragic flaw,” Winn lamented. “It didn’t cover the whole sky.” Even with Kepler’s extended K2 mission, it only accessed about 5% of the sky. This brings us to the current leader in exoplanet transit detections: the Transiting Exoplanet Survey Satellite (TESS).
TESS, launched 14 months ago, is designed to tile almost the entire sky during its 2-year primary mission; at this point, it’s already mostly through observing the southern hemisphere. TESS’s data — which is all made public immediately — includes two types: 30-minute full-frame images, and 2-minute subimages tracking 100,000 selected stars. Though TESS spends less time looking at each individual patch of sky, it will discover short-period transiting planets around a huge variety of stars throughout the galaxy. As of this morning, Winn reported, the number of TESS planet candidates stood at ~700 — and we can expect many more to come!

Past, current, and upcoming missions contributing to exoplanet exploration.
What’s the future of exoplanet study look like? TESS will serve as a bridge between Kepler and a number of upcoming missions. Targets selected by TESS can be followed up for atmospheric studies with the James Webb Space Telescope (JWST) and radius measurements with the CHaracterising ExOPlanets Satellite (CHEOPS). And the Wide Field Infrared Survey Telescope (WFIRST) stands to revolutionize exoplanet exploration for microlensing in the same way that Kepler revolutionized the field for transits.
Winn concluded with a message for any students in the audience deciding on a field of study: with transiting exoplanets, you have a rare opportunity to join an exciting field with few barriers to entry, massive amounts of data, and a very clear agenda for the next decade. It’s definitely an option worth considering!
Don’t forget that you can learn more about Winn and his work by checking out the interview conducted by Mike Foley here.
Press Conference: Even More Sun & More Milky Way (by Susanna Kohler)
This morning’s conference is following a familiar theme: even more studies about the Sun and the Milky Way! The first two presentations of the day focused on a favorite solar topic: predictions about the solar cycle and its impacts on Earth.
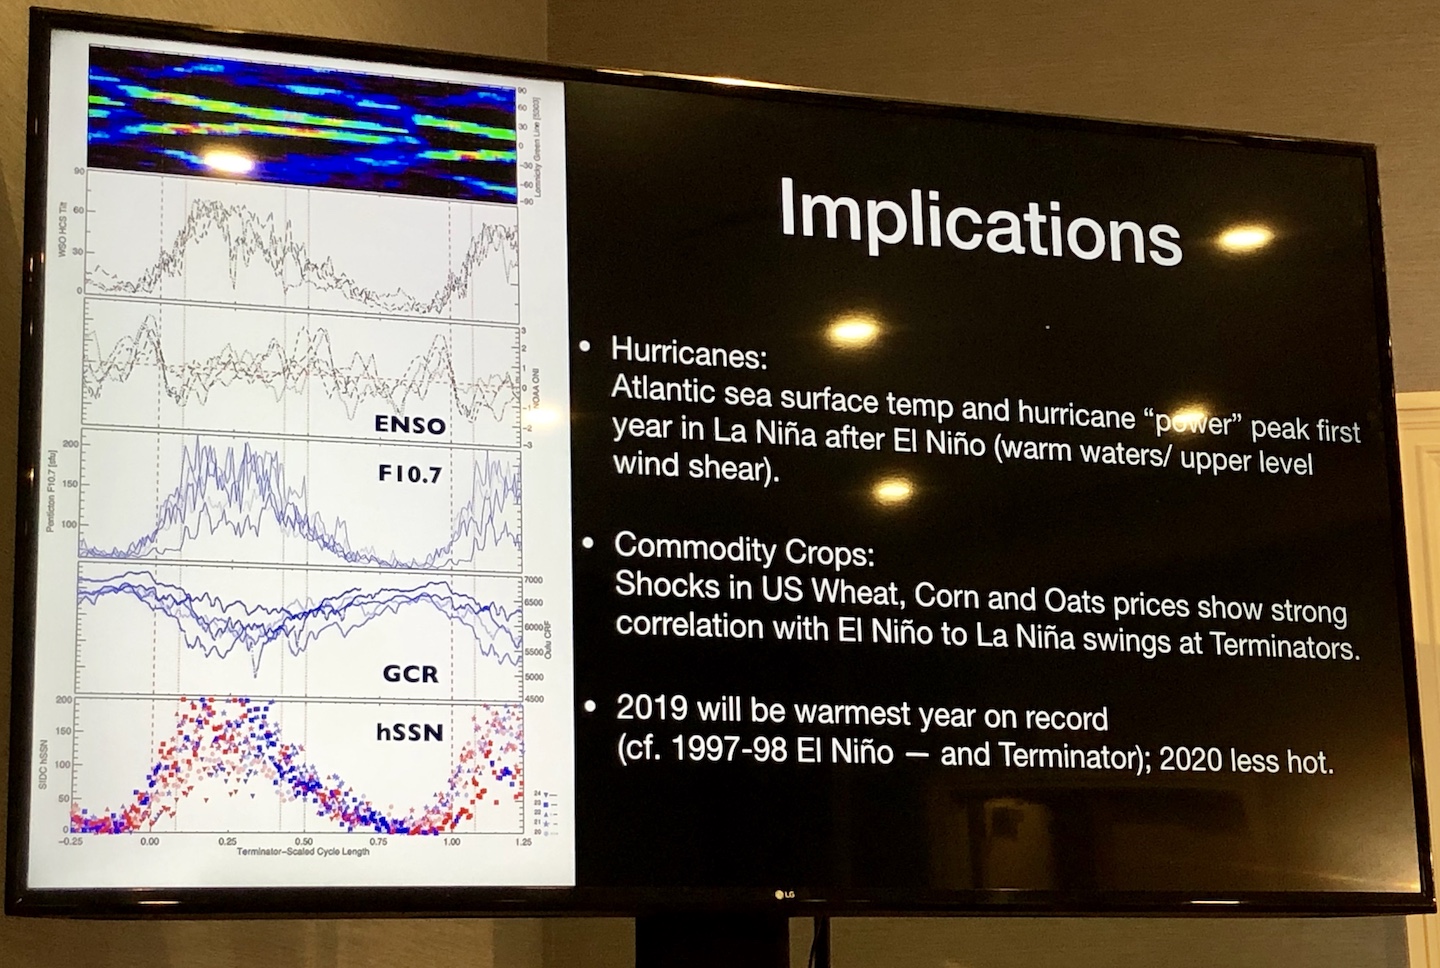
When data is scaled and stacked by terminator-to-terminator solar-cycle length, patterns become evident in factors like El-Niño behavior (ENSO), galactic cosmic-ray measurements (GCR), and sunspot number (hSSN).
Is there a relation between the solar cycle and large-scale weather patterns on Earth, like El Niño? Robert Leamon (University of Maryland & NASA Goddard SFC) argues yes — but it’s not tied to local solar-activity minima or maxima. Instead, he suggests that it’s the termination of each solar cycle — which occurs every ~11 years on average, but varies in exact timing — and the corresponding decrease in cosmic-ray flux that drives the swing on Earth from El Niño to La Niña. Leamon and collaborators use a signal processing method to analyze past data and project when the current cycle, Cycle 24, will terminate, finding that the termination will occur in April 2020 and drive the El-Niño-to-La-Niña transition shortly thereafter. Leamon concluded by emphasizing that this connection does not mean that the Sun is the cause of global warming; indeed, this coupling between the Sun’s activity and Earth’s atmosphere is only possible because climate change has already occurred.
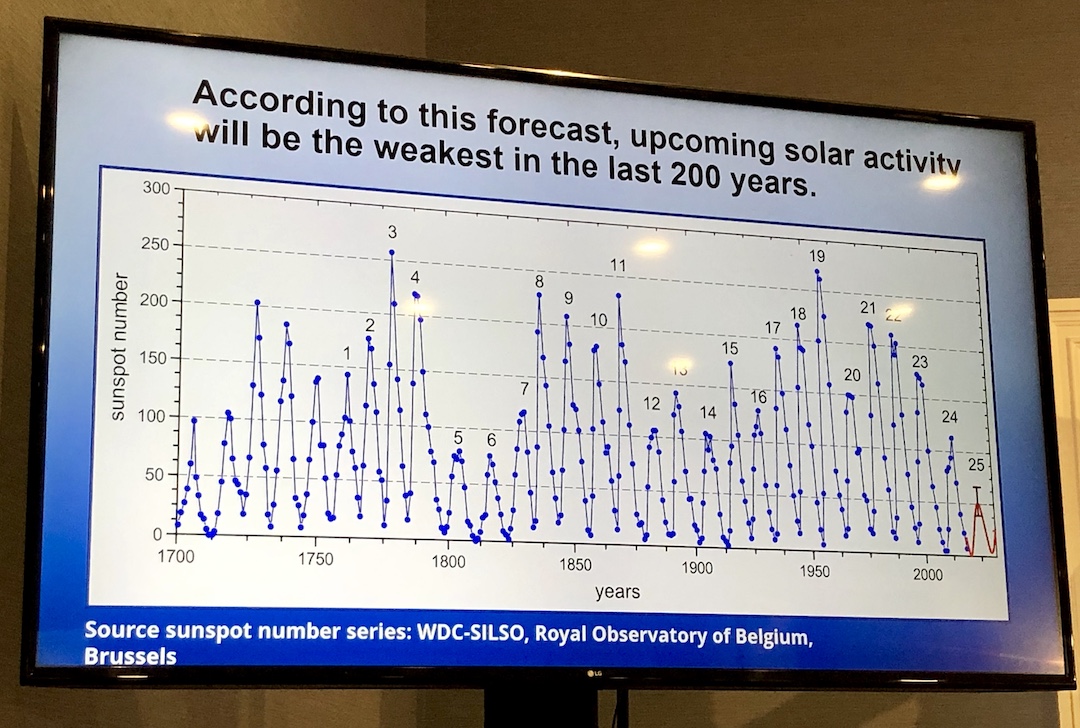
Kitiashvili and collaborators predict that the next solar cycle will be significantly weaker than previous ones.
Next up, Irina Kitiashvili (NASA Ames Research Center) introduces some predictions for long-term solar activity. By using a new technique that relates observations of the magnetic fields on the Sun’s surface to the state of the solar dynamo deep in the Sun’s interior, and by taking into account uncertainties in the data and the dynamo model, Kitiashvili and collaborators generate predictions of the future state of the Sun. They, too, estimate that the next solar cycle will begin in 2020, and they predict that the next solar maximum will be 30–50% lower than the most recent one — making it the weakest cycle of the last 200 years. Press release

Green circles mark citizen-scientist-identified “yellowballs”, intriguing young star-forming regions. [Milky Way Project]
It’s not often that you get confirmation of a prediction you made a decade ago; Sukanya Chakrabarti (Rochester Institute of Technology), however, is having that experience now. Ten years ago, she and collaborators used dynamical analysis to predict the presence of a large, dark-matter dominated dwarf galaxy that crashed into the Milky Way and produced large ripples seen in the gas of our outer galaxy. The problem? They couldn’t find a dwarf galaxy that matched their predictions. Now, a decade later, Chakrabarti may have found the culprit at last.
Gaia data recently revealed a new dwarf galaxy, Antlia 2, that has very few stars but a large amount of dark matter. Though similar in extent to the Large Magellanic Cloud, Antlia 2 is two orders of magnitude fainter! Chakrabarti and collaborators have shown that the properties and position of this galaxy beautifully match the predictions for the perturber they think smashed into the Milky Way long ago (see the gif below for the simulation of this interaction; gas is shown on the left, stars on the right). As an added test, they predict precisely where Antlia 2’s stars should be located in the future if this is, indeed, their missing galaxy. We can check whether they’re right in a year or two with the next Gaia data release! Press release
Plenary Lecture: Cosmological Inference from Large Galaxy Surveys (by Susanna Kohler)
The most surprising cosmological discovery of recent decades is the accelerating expansion of the universe — an unexpected outcome that has simultaneously driven theorists to develop new models and inspired a new generation of large cosmological surveys. These surveys will each gather a wealth of data — perhaps higher-precision measurements of the cosmic microwave background radiation, or better spectroscopic and photometric galaxy statistics — that can be individually used to provide constraints on the universe’s composition and evolution. But Elisabeth Krause (University of Arizona) asserts that the most stringent cosmological constraints will be obtained when we analyze these data with a careful eye for systematics, and when we combine the information from these different probes.
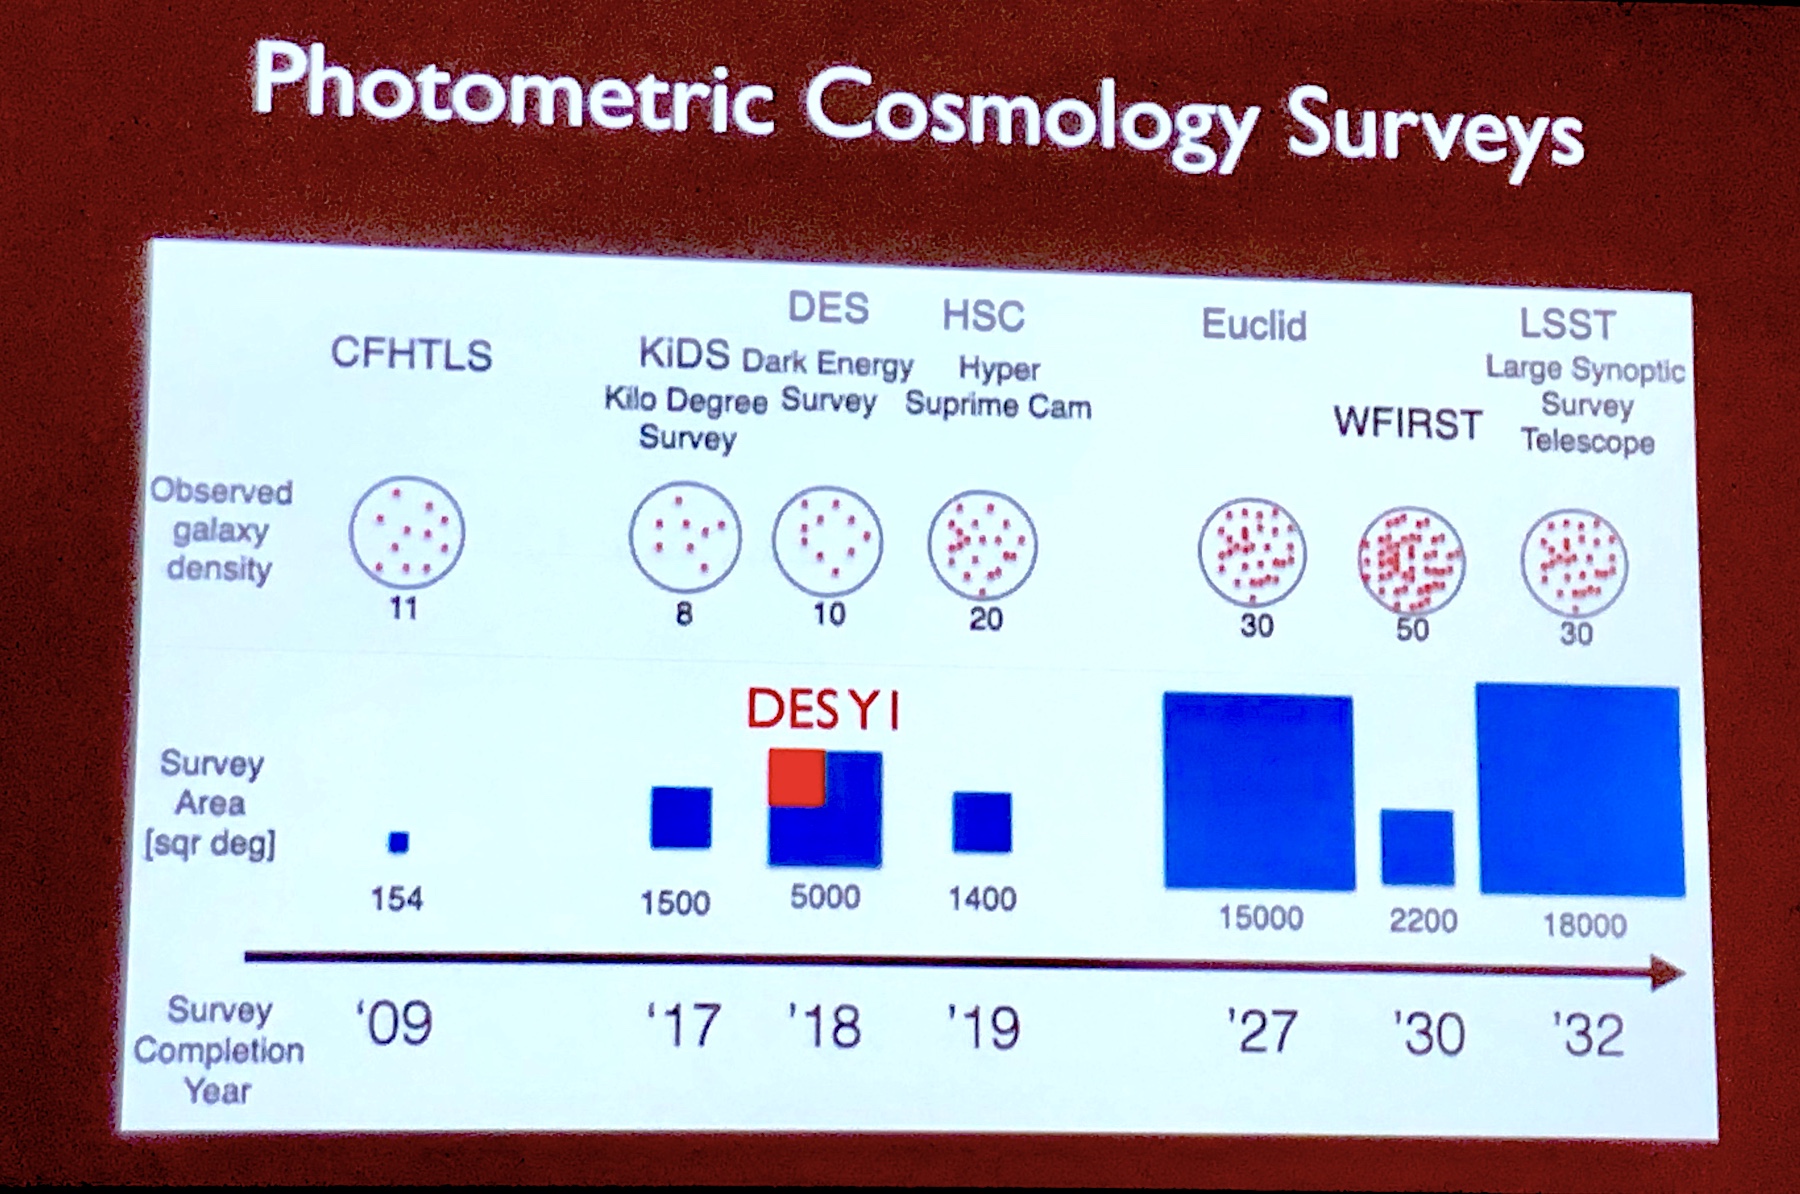
Current and upcoming photometric cosmology surveys. Can we combine information from these different probes to obtain tighter constraints?
How do we do this? First, it’s important to note that this upcoming decade of large surveys marks a new era. Gone are the days in which observations were easily analyzed, maps and catalogs easily produced, and lone geniuses were easily able to develop cosmological models from those products. In the current era of large-scale projects, Krause says, this model is no longer possible; now entire teams of people are needed to process the enormous volumes of data and jointly draw useful conclusions from them.
This new collaborative model is certainly evident in the Dark Energy Survey (DES) project, a visible and near-infrared wide-field survey that imaged millions of galaxies to produce a dataset that astronomers can use to learn about the growth of large-scale structure in the universe. But the key to good analysis is to properly account for systematics — which can include things like experimenter bias. In a collaboration of several hundred people, how do you make sure that eager scientists hoping for results for conferences, for instance, don’t end up unintentionally biasing the results? DES solved this problem by using complex blinding schemes that prevented the experimenters from seeing the data as they worked. Only once they all signed off on the conclusion of the analysis were they able to “open the box” and see what constraints came out.
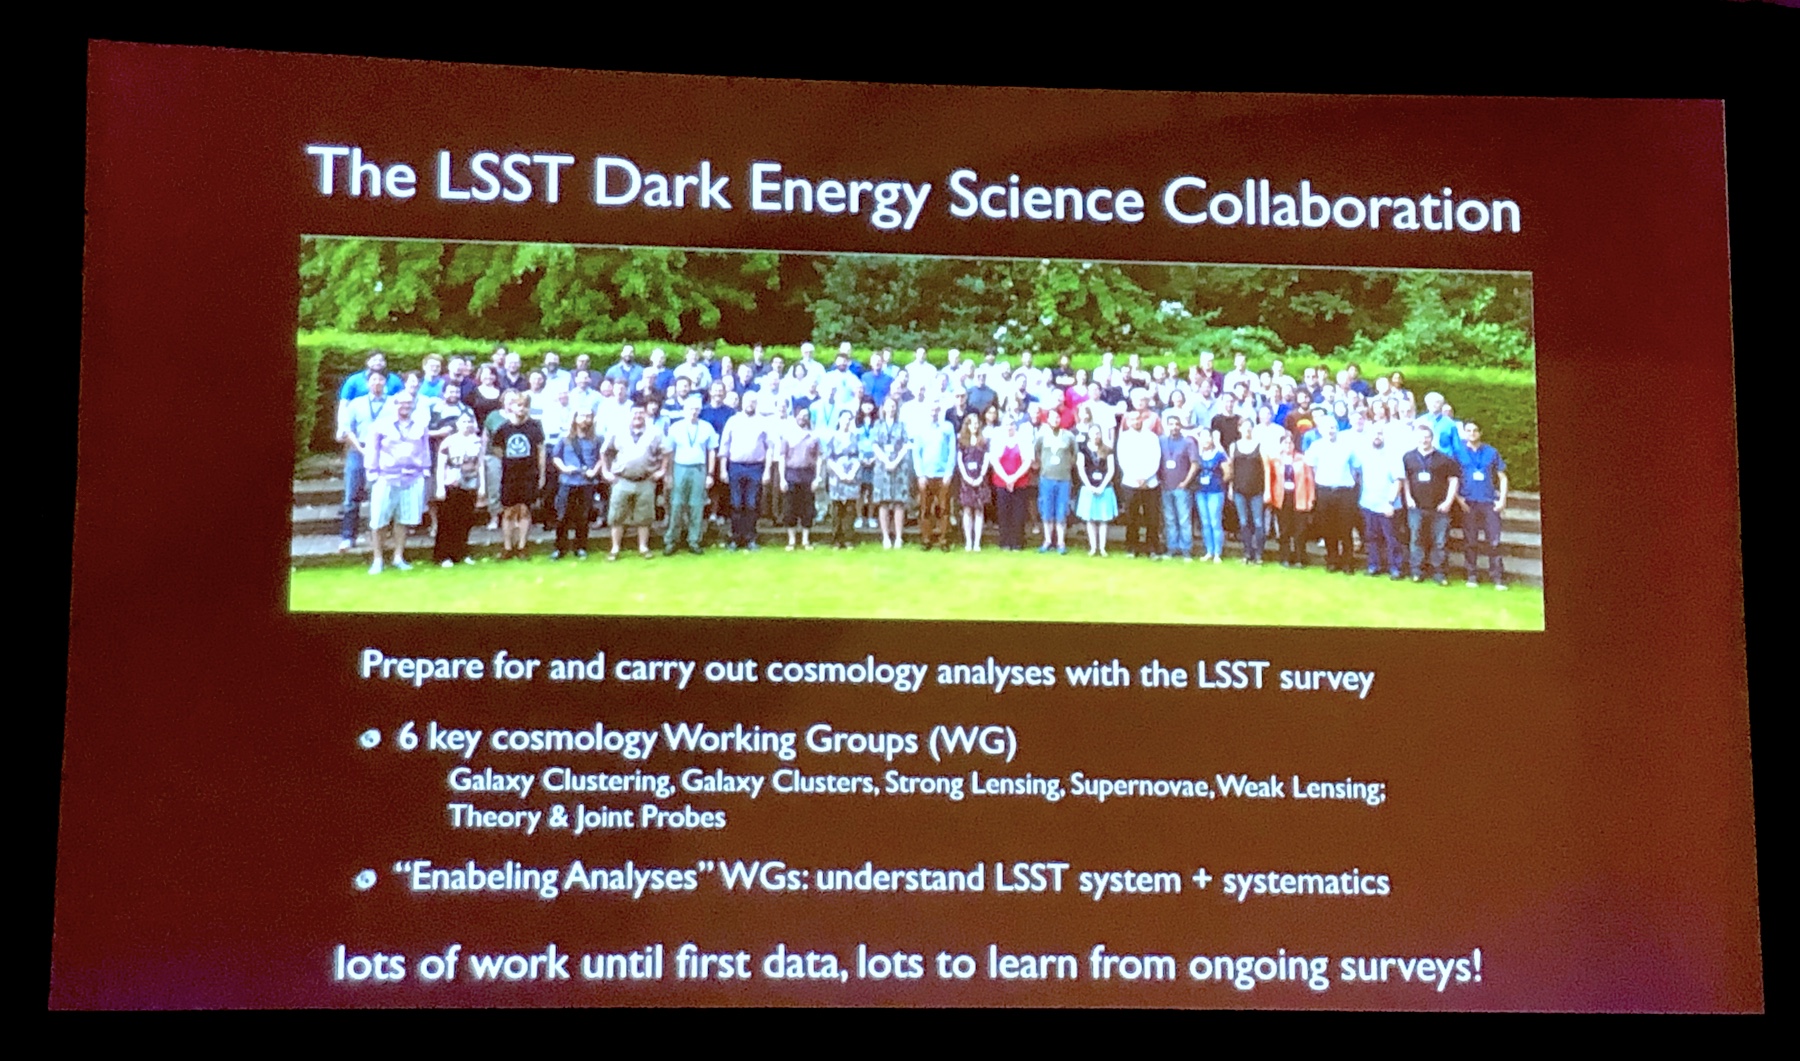
The LSST collaboration already consists of more than 600 people.
Strategies like this will be even more important in the future, as we move from datasets containing a few million galaxies to many billions of galaxies once WFIRST, Euclid, and the newly renamed Vera Rubin Survey Telescope (formerly LSST) come online, with correspondingly larger collaborations. But if we analyze these upcoming observations with careful attention to systematics, and if we combine the constraints of these surveys in thoughtful ways, we will soon have a better understanding of the nature of our universe than ever before.
Press Conference: Cold Quasars & Hot Cosmology (by Susanna Kohler)
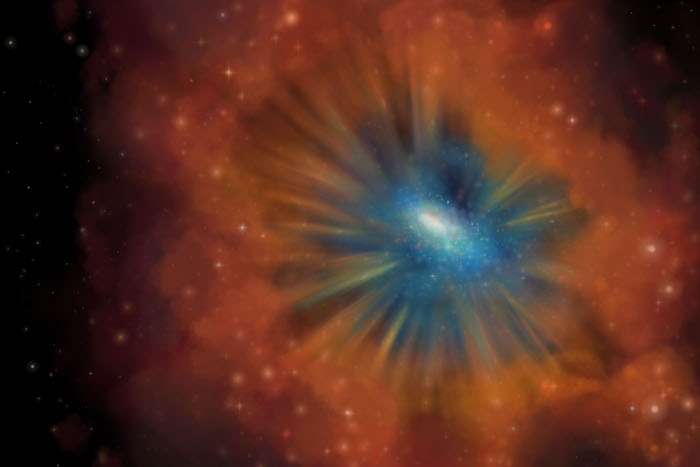
Artist’s illustration of a bright blue quasar clearing the gas and dust out from around it. [Michelle Vigeant/University of Kansas]
Fun side story: the upcoming merger of the Milky Way and Andromeda will likely proceed in exactly this way. Though both our galaxy’s supermassive black hole and Andromeda’s are quite anemic, the influx of fuel from a merger will cause the resulting, merged black hole to light up as a stunning quasar, dominating the night sky and eventually expelling the gas of the galaxy. No new stars will form after this point, so “this will spell the beginning of the end for life in the Milky Way,” cautions Kirkpatrick. Of course, she continues, this will be in ~3–4 billion years and will be around the time when the Sun evolves into a red giant, so we may have other, more pressing concerns at the time. Press release
The other two presentations of the session both addressed the same problem: the tension between local and global measurements of the Hubble constant (H0), a value that describes the rate of expansion of the universe. The best way to measure this constant in the local universe is to use the distance ladder to measure the distance to and recession speed of local galaxies. The most recent study using this approach gives a value for the Hubble constant of H0 = 74.03 ± 1.46 km/s/Mpc. Other experiments — like Planck — have instead measured H0 on global scales. By determining H0 in the early universe using observations of the cosmic microwave background (CMB) radiation, we can then evolve this value forward to present-day using ΛCDM cosmology, our best-guess model describing our universe’s evolution. This technique produces a value for the Hubble constant of H0 = 67.4 ± 0.5 km/s/Mpc. The local and global values are therefore in tension: there’s a 9% unexplained difference between the measurements. Is this difference due to systematics? Or is there new physics involved that we haven’t yet considered?
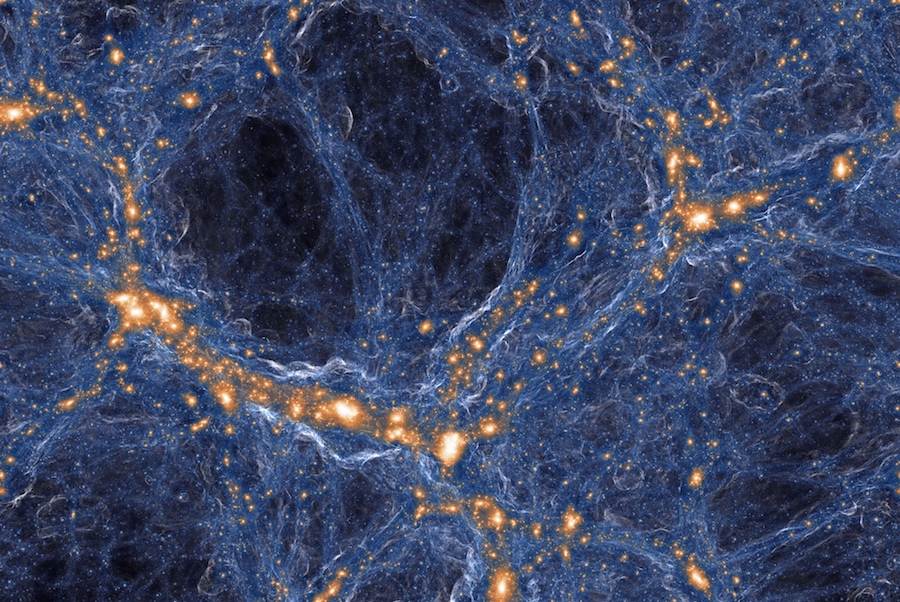
In this computer simulation, we see a region of the universe wherein a low-density “void” (dark blue region at top center) is surrounded by denser structures containing numerous galaxies (orange/white). Could such a void explain inconsistencies in the measured Hubble constant? [TNG collaboration]
So if local voids are out, it would seem that perhaps new physics is, indeed, needed to resolve the problem. Maurice Van Putten (Sejong University) has an idea: what if the fact that the universe is evolving means that ΛCDM cosmology isn’t the best model at all orders? If we take into account deviations from ΛCDM predicted by quantum cosmology, then Van Putten shows that this new model applied to CMB measurements produces a global value for H0 that nicely matches the value found from local measurements. Voila, tension is gone! It seems surprisingly simple (though the math really isn’t!), but comparison to future observations should provide a check of this theory.
Karen Harvey Prize Lecture: Where Do Solar Eruptions Come From? (by Susanna Kohler)
The final plenary of the day was given by Anthony Yeates (Durham University), who is the recipient of this year’s AAS/SPD Karen Harvey Prize, an award that recognizes early-career individuals who have made a significant contribution to the study of the Sun. In Yeates’s case, his contribution is in the form of work advancing our understanding of “how the Sun’s magnetic fields originate, evolve, and govern the dynamics of the solar corona,” and he was ready today to give us his take on where solar eruptions come from.
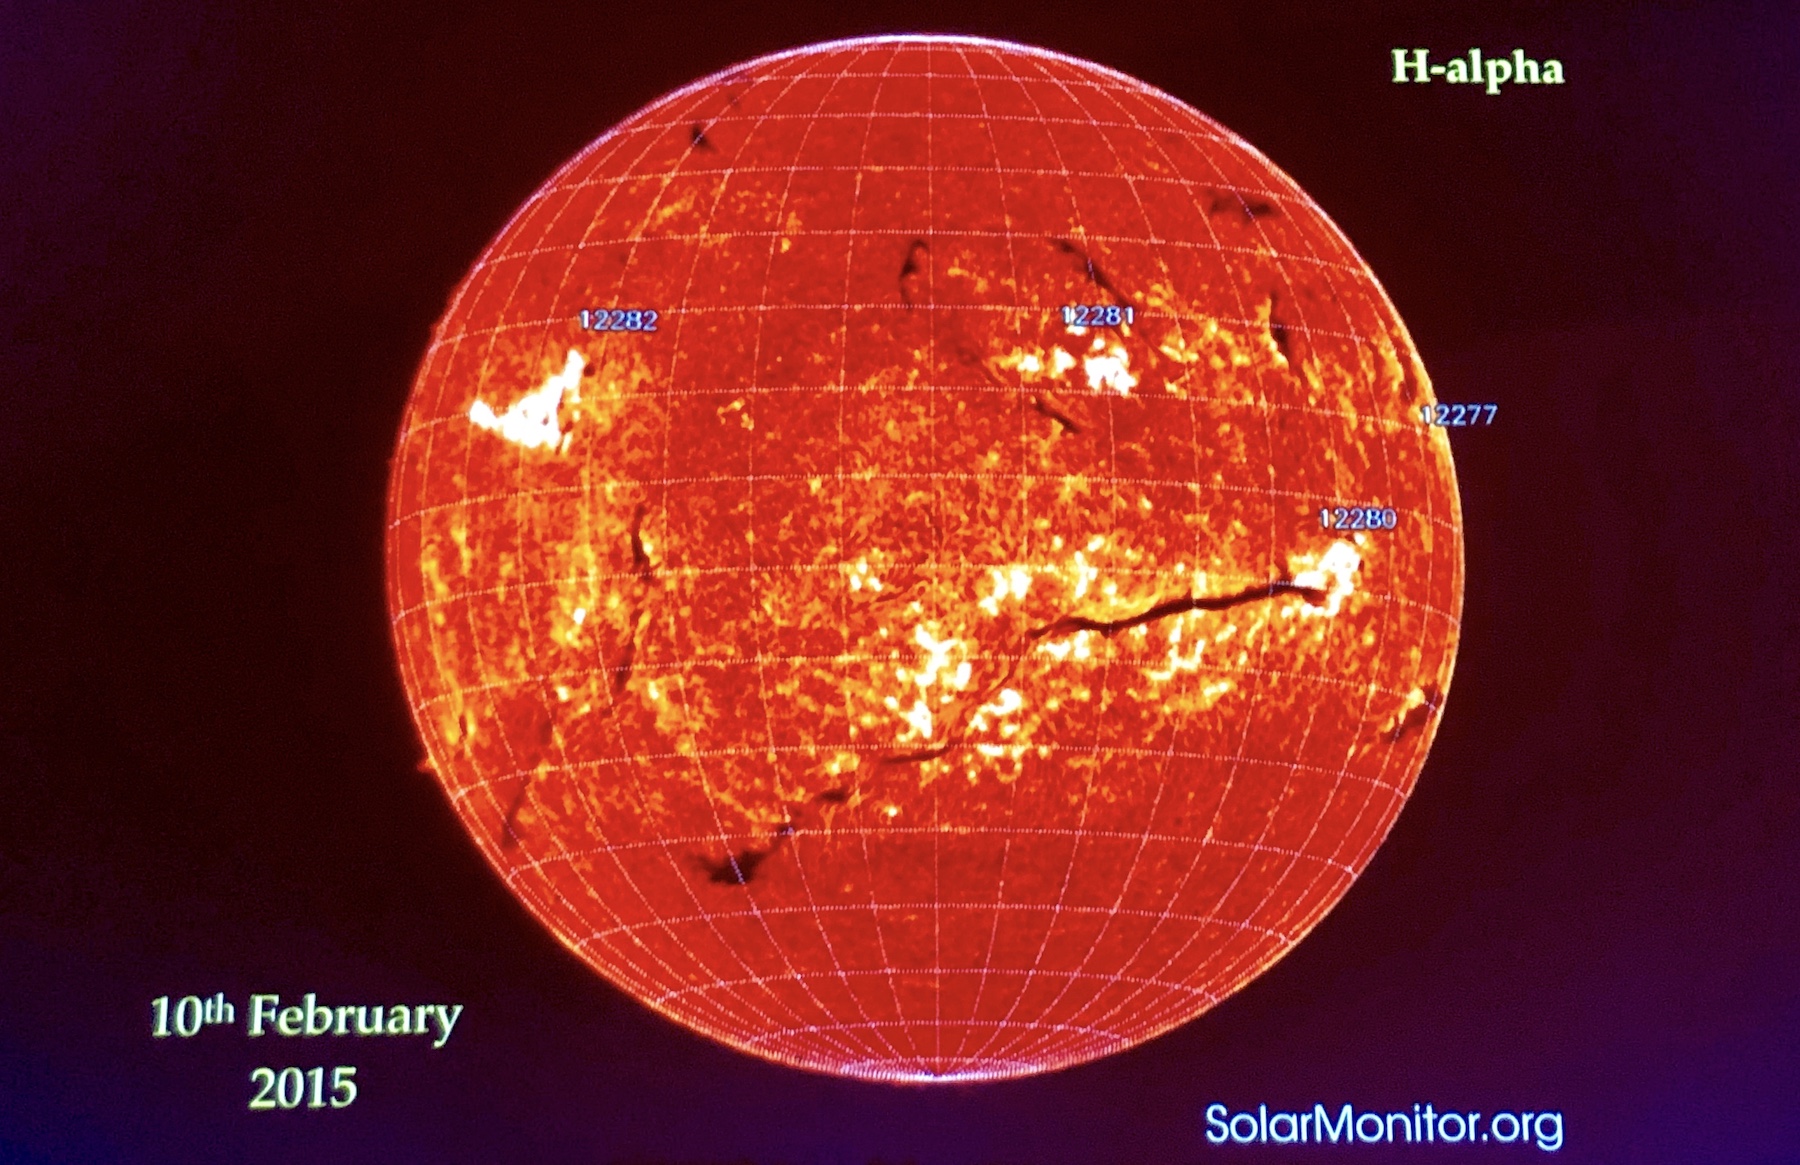
The dark structures visible against the Sun’s disk are solar filaments.
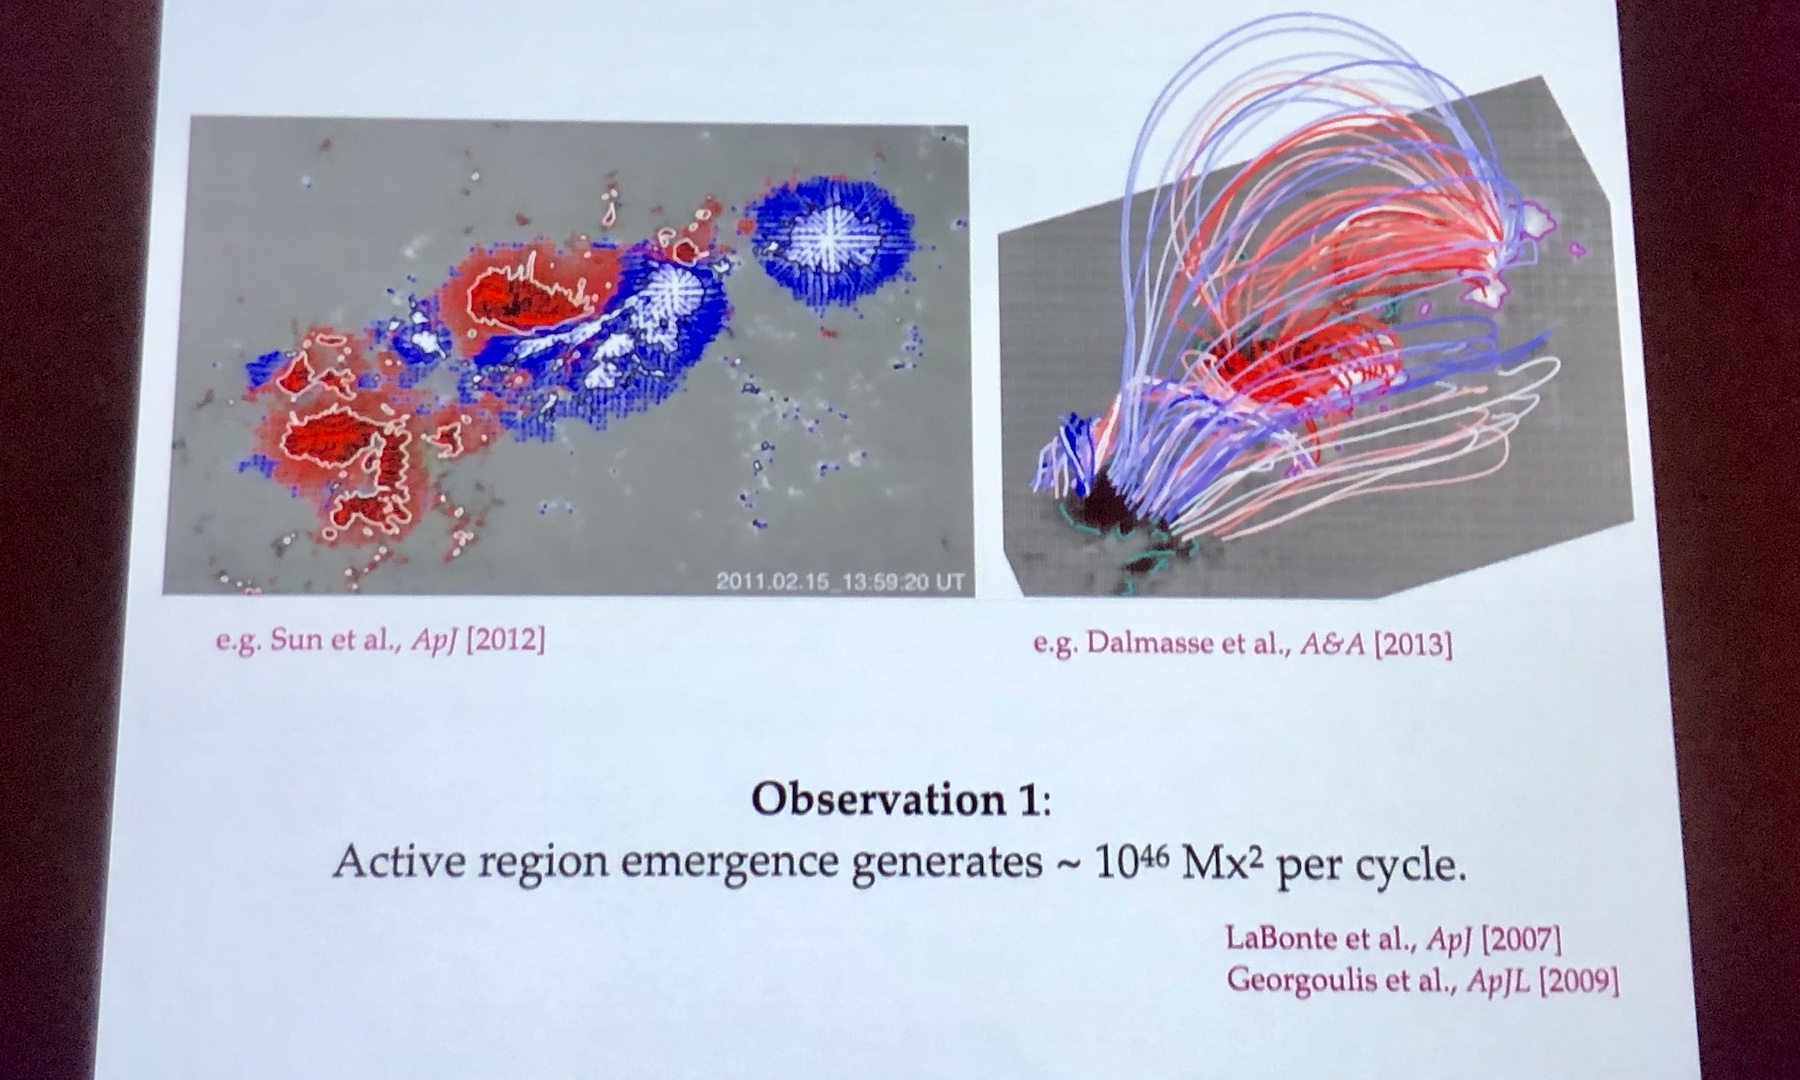
Yeates argued that the key to understanding solar eruptions is to understand how magnetic helicity is injected into and removed from the Sun’s atmosphere. He opened by showing us images of enormous magnetic filaments — dark, string-like structures visible against the Sun’s disk. These magnetically-confined channels of cool gas are what eventually give rise to eruptions and flares, and the twisted and helical magnetic fields that govern them become evident when you look at them closely. Magnetic helicity is the measure of how tangled, twisted, and linked these fields are.
Over the next half-hour, Yeates built up a compelling picture of how energy is freed from the Sun’s surface and expelled into space in an eruption.
- Step 1: Magnetic helicity is injected into the Sun’s corona by motions on the surface of the Sun. There are multiple components to this: the Sun’s rotation generates helicity, and more is added as the footpoints of magnetic field lines wander via diffusion, tangling the fields.
- Step 2: Once helicity has been added into the atmosphere, it accumulates at polarity inversion lines, locations where the magnetic polarity swaps. This build-up allows field lines to get close together — exactly what’s needed for magnetic reconnection to occur.
- Step 3: Helicity is removed from the atmosphere via coronal mass ejections. Sudden eruptions (likely following reconnection) throw some of this tangled magnetic field out into space, removing it from the Sun’s atmosphere.
Magnetic fields on the Sun are complicated!
Currently, Yeates said, observations and models are in good agreement, leading to general acceptance of this paradigm. But we still have plenty more work to do! The ultimate goal, of course, is to be able to predict when eruptions will occur. We’re certainly not there yet — Yeates earned a laugh when he described the current state as “we can predict them after they happen” — but this understanding of how energy makes its way from the solar surface into eruptions is a huge step in the right direction.
You can read more about Yeates in the interview conducted by astrobiter Mia de los Reyes here.