

Ultra-hot Jupiter WASP-121b is once again puzzling astronomers. New JWST observations have revealed aspects of this superheated planet’s atmosphere that models cannot yet explain.
An Extreme Planet
Among the more than 6,000 known exoplanets, there are many types of worlds that aren’t represented in our solar system. The most exotic and unfamiliar planets might be the ultra-hot Jupiters: giant planets nestled so close to their host stars that they are tidally locked, with temperatures on their permanently starlit sides climbing to thousands of degrees.
WASP-121b, which circles its F-dwarf host star every 30.5 hours, is one of the best-studied ultra-hot Jupiters. Previous work has started to reveal the complexity of its atmosphere, and now, data from JWST have opened a new window onto WASP-121b’s behavior.
New View from JWST
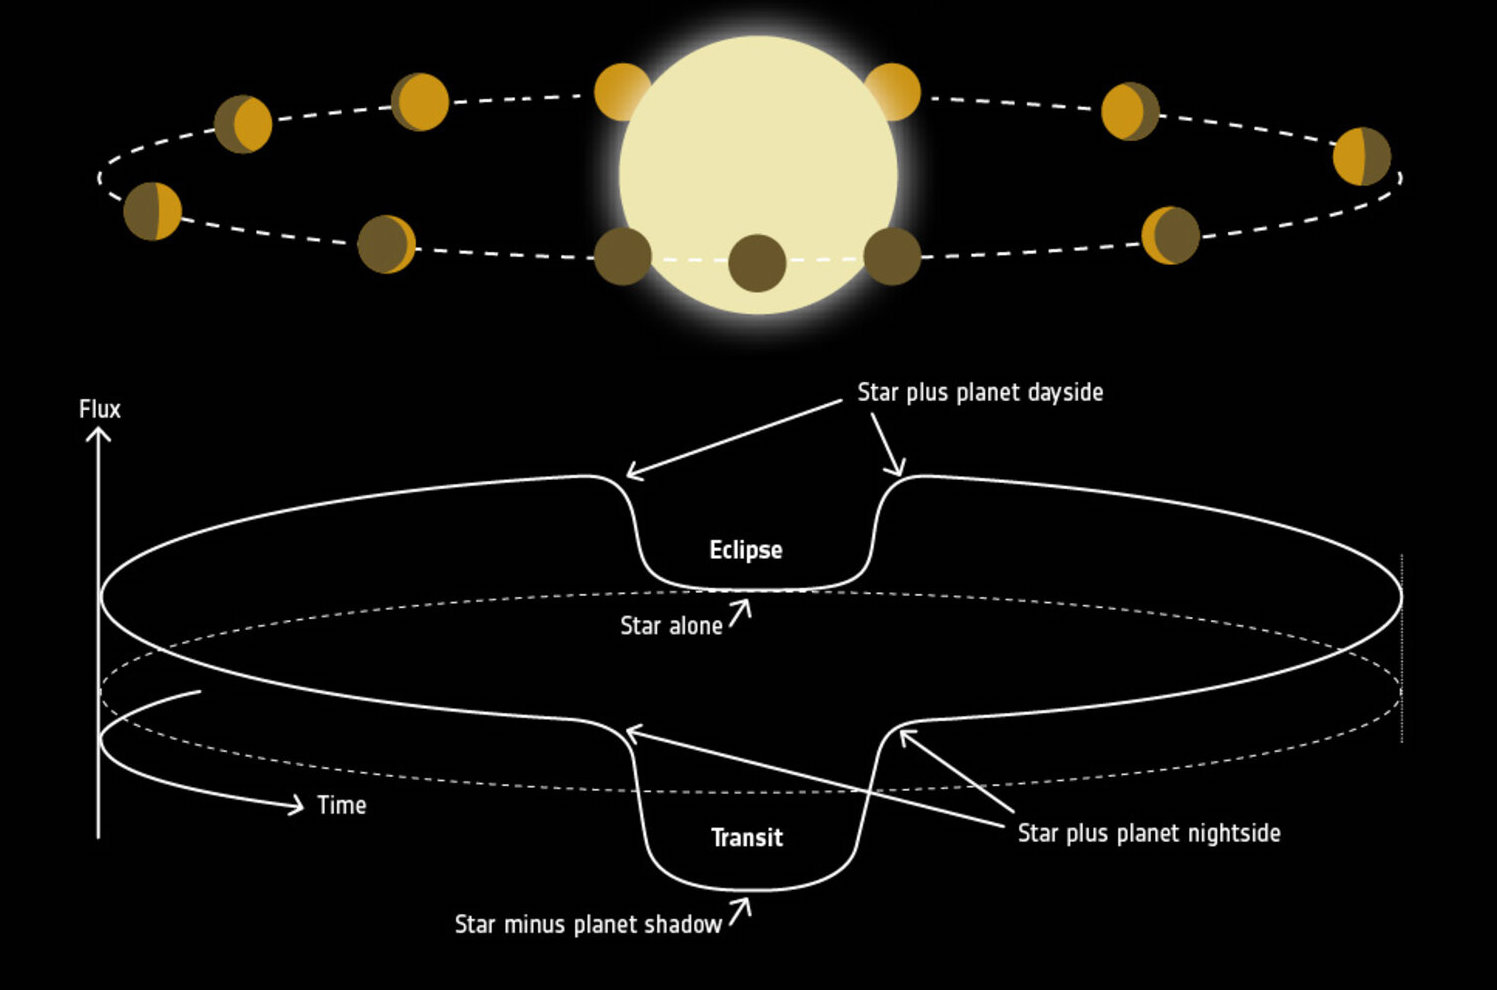
A representation of an exoplanet’s phase curve. Click to enlarge. [ESA]
The team used two 3D general circulation models to predict the planet’s atmospheric structure and extract synthetic spectra and phase curves to compare against the JWST observations. Using nine model configurations in total, the team varied several inputs, including sources of atmospheric opacity, sources of atmospheric drag, and assumptions about whether clouds are able to form on the planet’s cooler nightside.
Left with a Mystery
Frazier and collaborators found two aspects of WASP-121b’s phase curve that their models couldn’t explain: the planet emits less light overall than predicted, and the location of its phase-curve offset changes with wavelength.
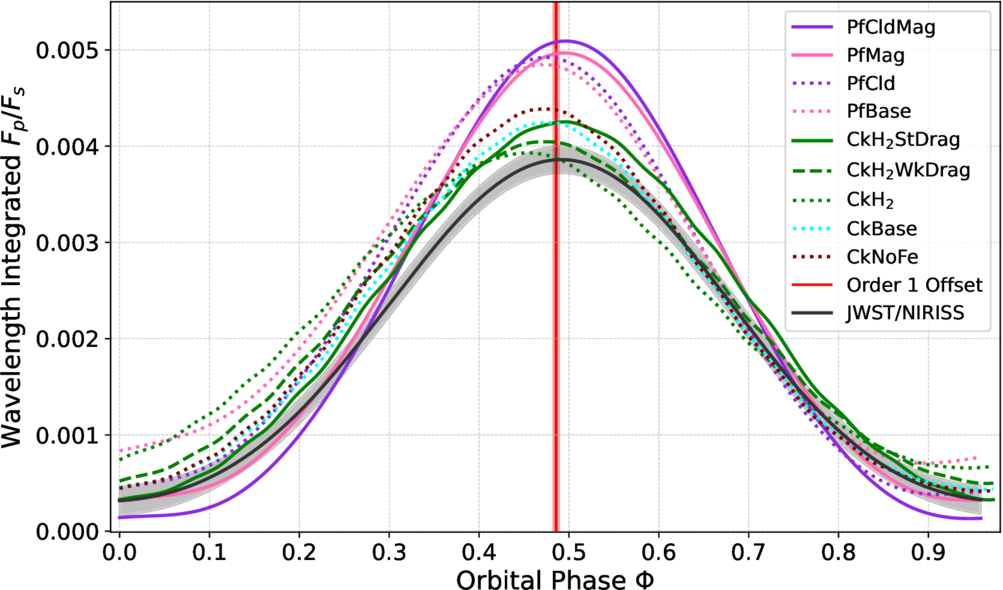
Modeled phase curves, shown as the flux of the planet divided by the flux of the star, for WASP-121b (colored solid and dotted lines) compared to the best fit to the JWST observations (black line). Click to enlarge. [Frazier et al. 2026]
The phase-curve offset is the difference between a planet’s sub-stellar point (where the star is directly overhead) and the brightest point in the planet’s atmosphere. In general, some degree of offset is expected because planetary winds tend to whisk heat away from the sub-stellar point, placing the brightest point somewhere to the east (usually). For WASP-121b, the offset is unexpectedly small — suggesting a source of drag in the atmosphere that prevents winds from transporting heat away from the sub-stellar point — and it’s larger at shorter wavelengths. This wavelength dependence isn’t predicted by any of the models, and it’s not clear what causes it.
These results demonstrate something remarkable: that our observations of a planet nearly 900 light-years away have become so precise that they’re pushing our already complex models to include more physics — an exceptionally exciting motivation for model improvement!
Citation
“The Days Drag On on WASP-121 b: Interpreting Its NIRISS Spectroscopic Phase Curve with General Circulation Models,” Robert C. Frazier et al 2026 ApJ 1004 102. doi:10.3847/1538-4357/ae69ca