
Editor’s Note: Astrobites is a graduate-student-run organization that digests astrophysical literature for undergraduate students. As part of the partnership between the AAS and astrobites, we occasionally repost astrobites content here at AAS Nova. We hope you enjoy this post from astrobites; the original can be viewed at astrobites.org.
Title: Retrieving the Red Edge on Earth-Like Planets with Heterogeneous Clouds and Surfaces
Authors: Zachary Burr et al.
First Author’s Institution: Jet Propulsion Laboratory; ETH Zurich
Status: Published in ApJ
In the next 25 years, astronomers could find signs of life on other planets with the launch of the Habitable Worlds Observatory. Atmospheric signs of life, known as atmospheric biosignatures, are how astronomers currently search for life on other planets. Figure 1 shows examples of atmospheric biosignatures with pictures of each chemical’s origin on Earth. Before E.T. can phone home, though, we have to understand what chemicals make up a planet’s atmosphere. To do this, astronomers can use spectroscopy to observe a planet’s atmosphere in different wavelengths and measure the types and quantities of chemicals present.
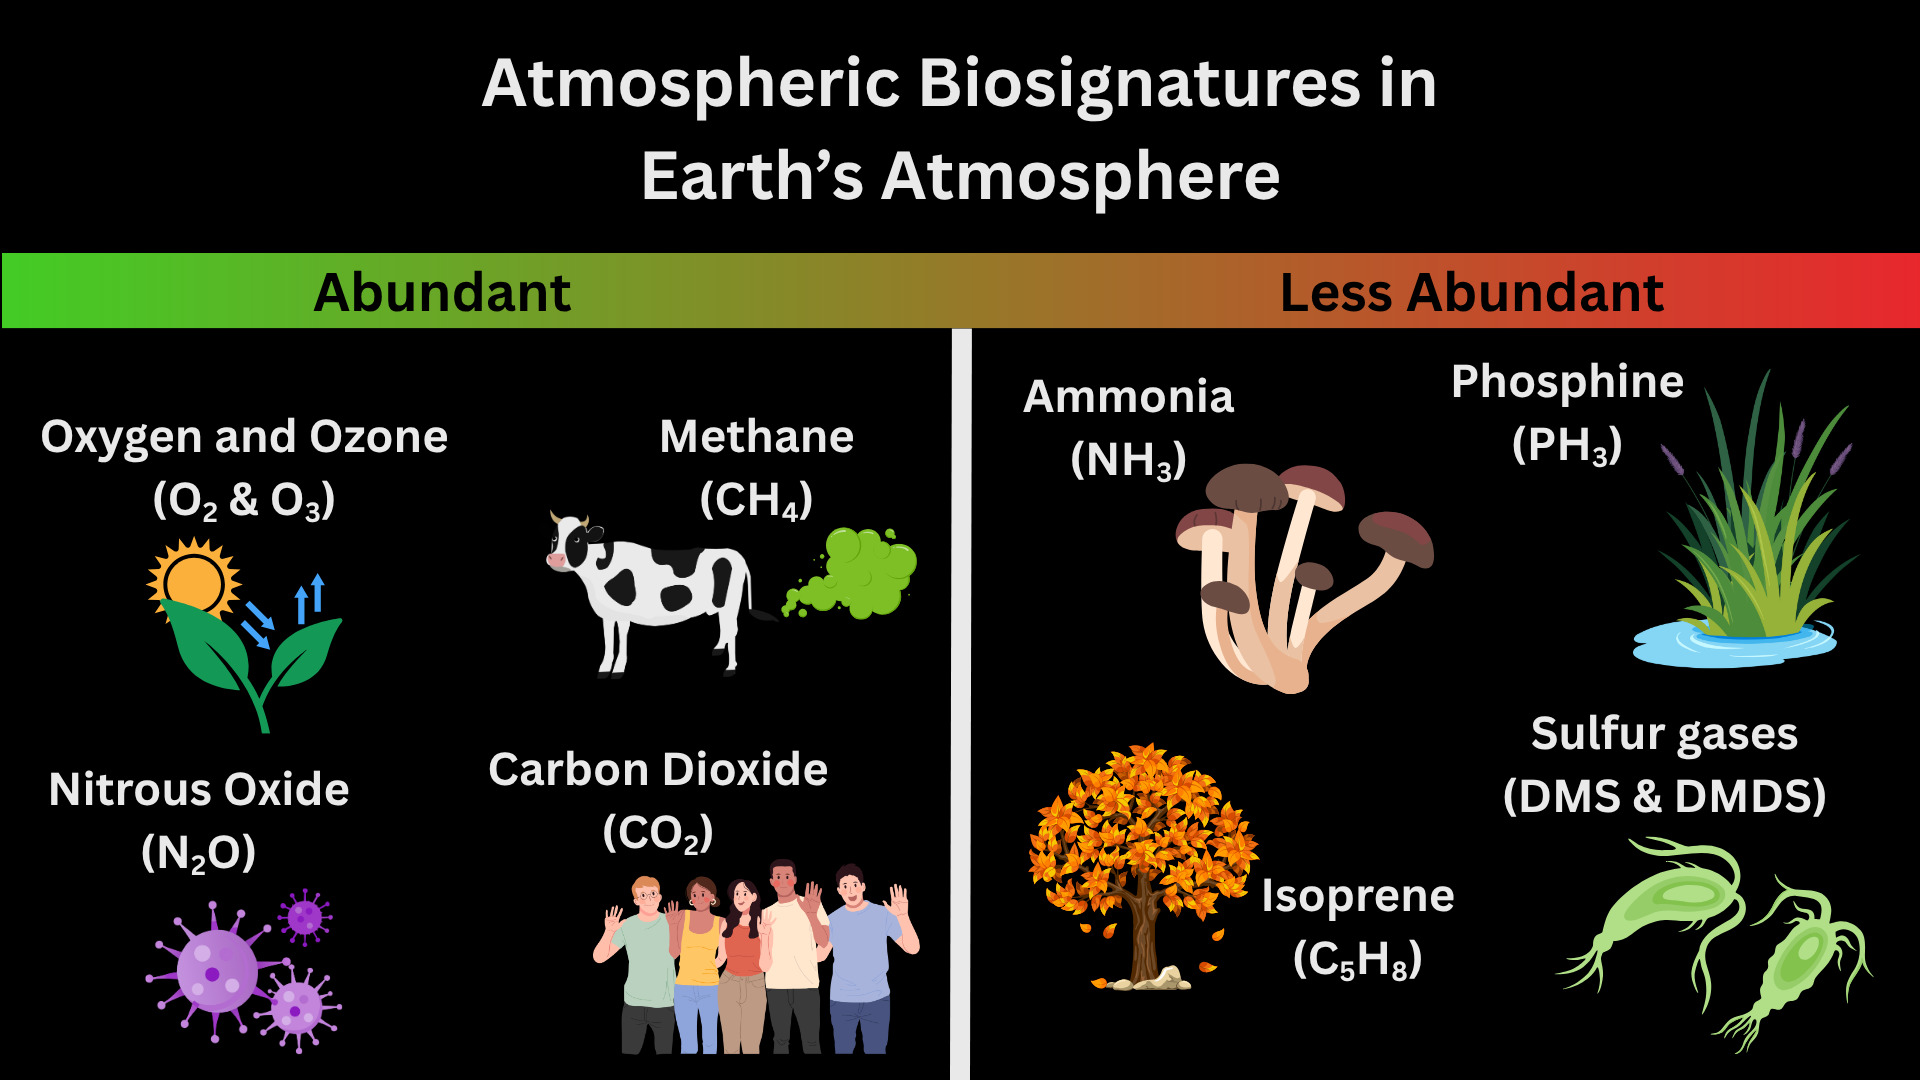
Figure 1: Atmospheric biosignatures present in Earth’s atmosphere. More abundant biosignatures include oxygen and ozone (byproducts of photosynthesis in plants and bacteria) and nitrous oxide (byproduct of bacteria that don’t need oxygen to survive). Less abundant biosignatures include isoprene (released from the breakdown of leaves that have fallen from trees) and sulfur gases (byproducts of cyanobacteria). [Kaz Gary]
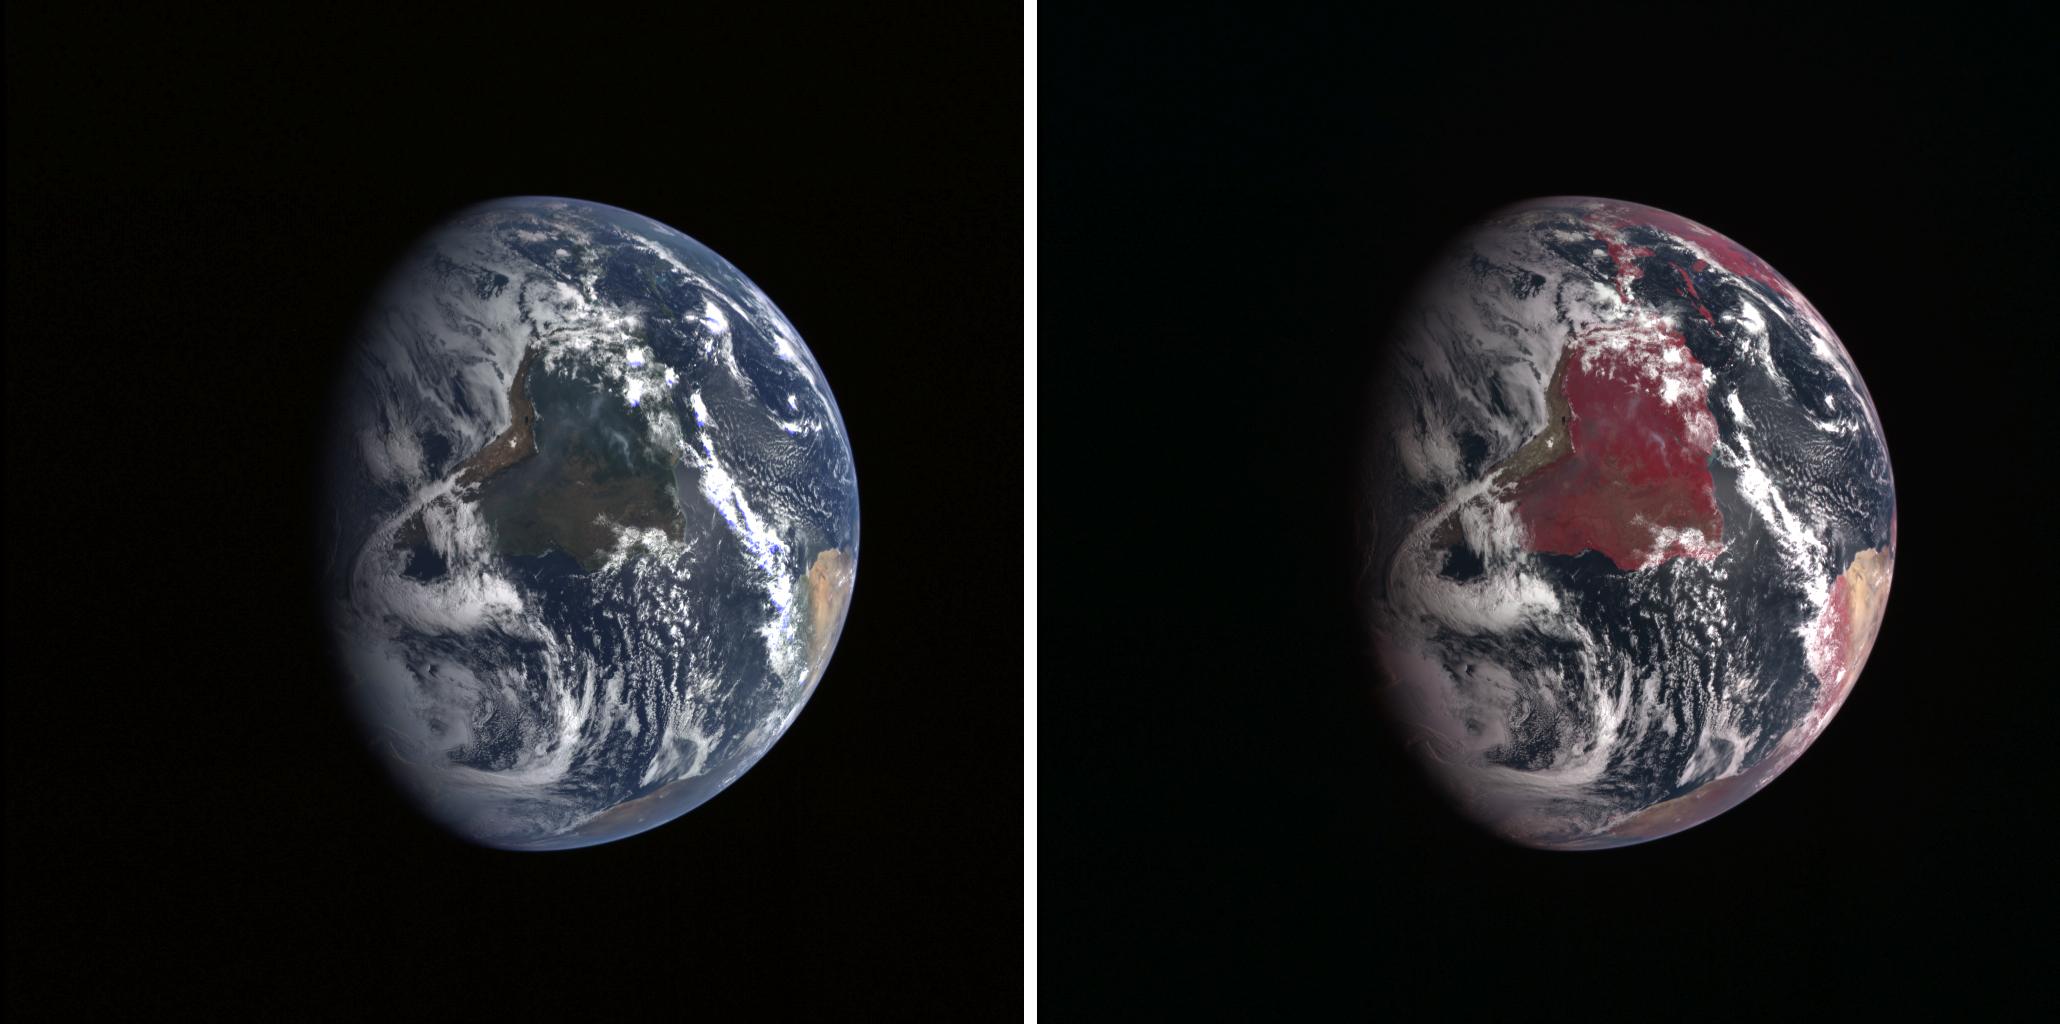
But are atmospheric biosignatures the only way to tell if life exists on other planets? Short answer: absolutely not. Let’s take Earth as an example. If we imagine Earth as a directly imaged exoplanet and take spectra of the light it reflects, you’ll find that around near-infrared wavelengths (~700 nanometers or just past the red part of the visible light spectrum), the light reflected off of Earth increases sharply. This sharp increase is called the vegetation red edge and is caused by plant and ocean life on Earth’s surface as shown in Figure 2. This is made possible because chlorophyll (the thing that makes plants green) absorbs nearly all visible light but reflects near-infrared light. The vegetation red edge is an example of a surface biosignature. In today’s article, the authors determine if the vegetation red edge will be visible in spectra of Earth-like exoplanets!
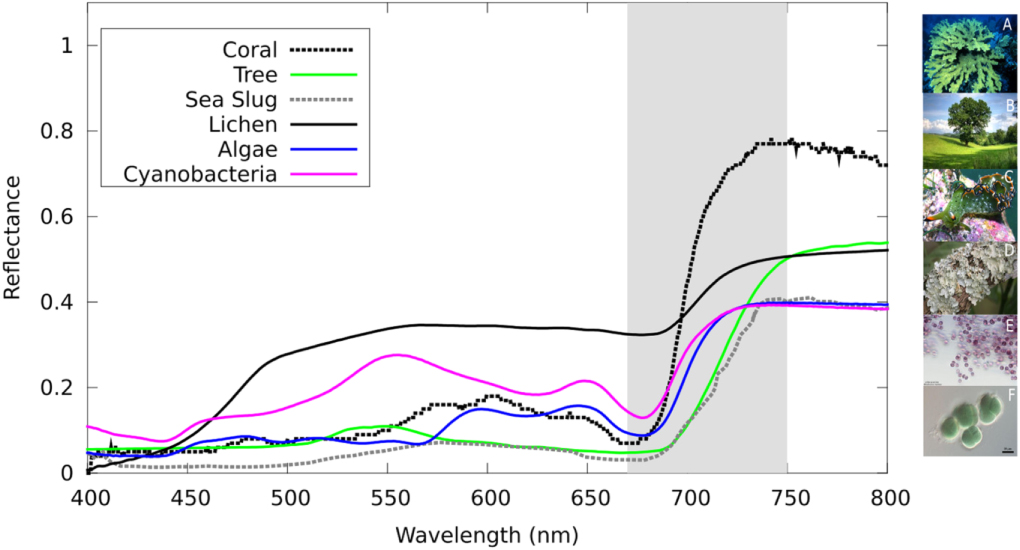
Figure 2: Spectra of different sources of the vegetation red edge on Earth. The vegetation red edge is highlighted in gray where the spectra rapidly increase and then level off beyond the visible light part of the spectrum. Each color represents a different source with pictures of each source on the right-hand side of the plot. [O’Malley-James and Kaltenegger 2019]
Snapshots
Planets rotate; that’s how we have morning, noon, and night in 24 hours guaranteed. This means that different parts of the surface will be visible at different times when we take spectra. Sometimes, we may see more ocean than land, other times not. To determine if the vegetation red edge would be visible at all points in Earth’s day, the authors simulated nine different spectra of modern-day Earth representing nine snapshots of Earth’s rotation. Additionally, they also simulated a time-averaged spectrum that shows an entire Earth day in one snapshot without the time variability. These spectra are shown in Figure 3.
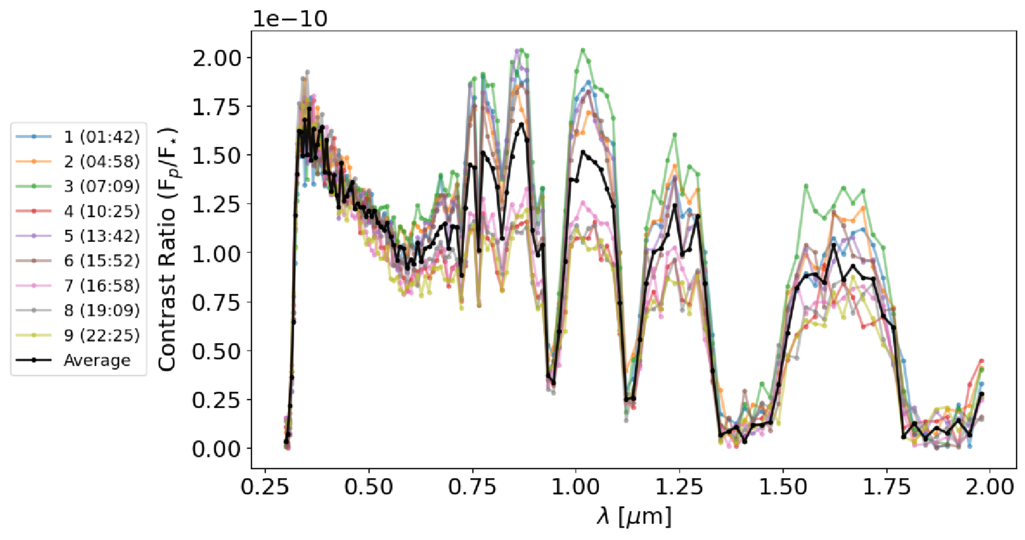
Figure 3: Spectra of a directly imaged modern-day Earth at nine different times in its rotation. The y-axis is the ratio of the planet’s signal to the star’s signal and the x-axis is wavelength in microns. Each color represents a time in UTC and the black curve represents the time-averaged spectrum. [Burr et al. 2026]
Arr! There Be… Vegetables?
After running the models, the authors were able to detect a sharp increase in the surface albedo value in every spectrum, including the time-averaged one. This result is shown in Figure 4. The authors take this result one step further in order to validate that the vegetation red edge is actually a result of surface variation of vegetation. They re-run models on each of their spectra but instead include a constant surface albedo instead of a time-varying one. This resulted in incorrectly measured radii, chemicals, and surface gravity in nearly all of the models. Without the vegetation red edge and surface features, the models could not accurately determine if life was present on Earth.
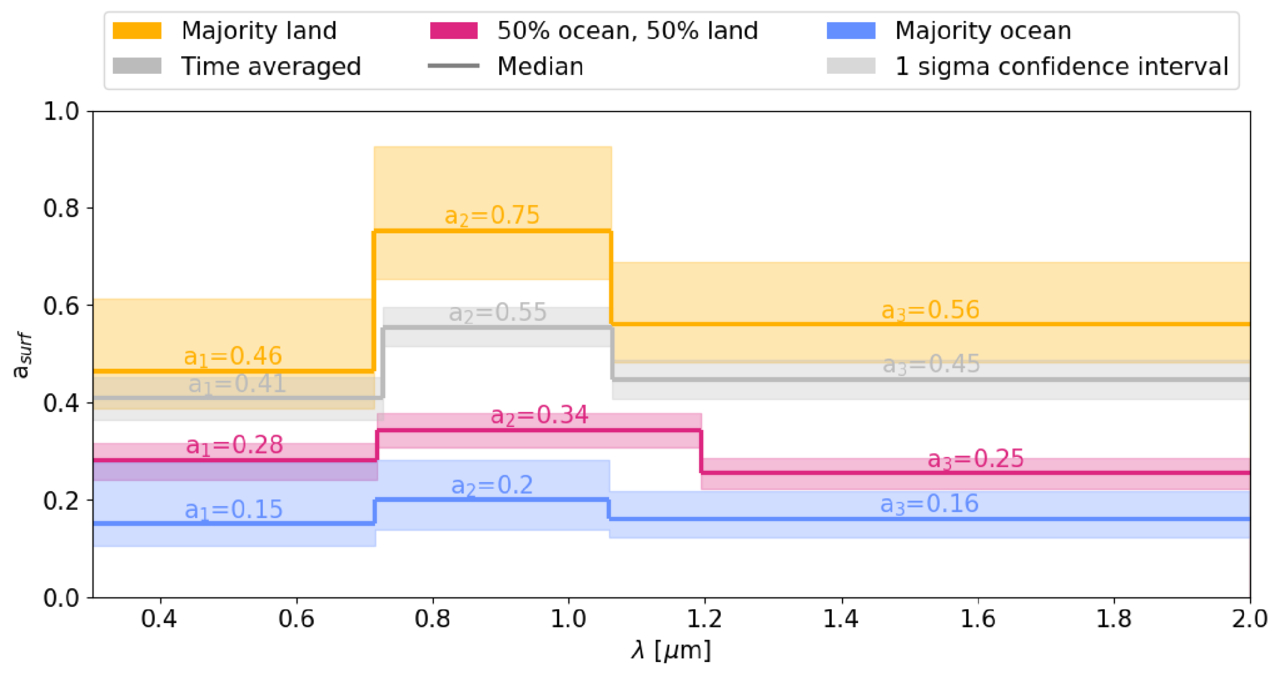
Figure 4: Retrieved surface albedos for the nine time-varying spectra. The surface albedo is broken down into three different values (a₁, a₂, a₃). Each of these values represents a change in the surface albedo at different wavelengths (i.e., how reflective the surface is at three different wavelengths). The nine spectra were broken down by the amount of surface that was visible at that time and color-coded for each category. The time-averaged spectrum is shown in gray. Each category of spectra was able to retrieve an increase in reflected light from the surface at vegetation red edge wavelengths. The spectra that had the majority land visible have the biggest increase in the surface albedo. This makes sense since the amount of visible vegetation is the largest with majority-land planets. [Burr et al. 2026]
Original astrobite edited by Madison VanWyngarden.
About the author, Kaz Gary:
I am a fourth-year PhD candidate at The Ohio State University with a passion for planets. My current work focuses on modeling exoplanet observations for the Habitable Worlds Observatory and understanding planetary atmospheres. Outside of research, I help develop planetarium shows and love all forms of science communication. In my free time, I enjoy playing tabletop RPGs, painting, watching terrible reality TV, and hanging out with my pet hedgehog.