
Editor’s Note: Astrobites is a graduate-student-run organization that digests astrophysical literature for undergraduate students. As part of the partnership between the AAS and astrobites, we occasionally repost astrobites content here at AAS Nova. We hope you enjoy this post from astrobites; the original can be viewed at astrobites.org.
Title: Unbreaking the Universe: MINERVA Measurements of Color Gradients in Massive Quiescent Galaxies Can Help Ease Too-Early Star Formation Tensions
Authors: Sam E. Cutler et al.
First Author’s Institution: Tufts University
Status: Published in ApJL
Universe Breakers
JWST launched in 2021, and one of its key goals was to observe the first galaxies as they formed. Early results from JWST found something surprising: extremely massive galaxies in the early universe that had “quenched,” or stopped making new stars, much faster than was expected. These early results led some to believe that our understanding of how quickly massive galaxies can form and quench was fundamentally wrong.
Before concluding that our understanding of the universe is broken, it’s important to find other reasons why we might see very massive galaxies in the early universe. One theory is that these galaxies are actually less massive than we think. To “weigh” a galaxy, astronomers first measure the amount of light being emitted by that galaxy. If all the light in a galaxy comes from stars (which should be true in the early universe, though active black holes can contribute a lot of light in some galaxies), you can infer the total number of stars by accounting for the average amount of light emitted per star of a certain mass; this is called the “mass-to-light ratio.” Since massive stars emit a lot more light than low-mass stars, and high-mass stars die out faster than low-mass stars, the mass-to-light ratio is higher for older stellar populations. To accurately “weigh” a galaxy, scientists therefore need both a good measurement of the total amount of light in the galaxy and how old its stellar population is. The authors of today’s article suggest that the uncertainty in these measurements might be leading to overestimates of galaxy masses and underestimates of galaxy star formation rates, possibly explaining the existence of the earliest massive quiescent (non-star-forming) galaxies.
The Impact of Color Gradients
Previous works about the massive quiescent galaxies in this study used spectroscopy to determine the galaxies’ masses and star formation rates. These spectra were taken with a “slit,” which introduces a source of error: if the slit is smaller than the image of the galaxy, some of the galaxy’s light will be missed in the spectrum. Astronomers usually correct for this by checking how much of the total light of a galaxy image is covered by the slit and scaling up the spectrum to account for the missing light, but this correction assumes that the spectrum is basically the same across the entire galaxy.
However, this assumption is rarely correct. In the local universe, star-forming spiral galaxies like the Milky Way tend to be made of a central “bulge” surrounded by a “disk” (see Figure 1). The bulge is no longer actively forming new stars, leading to a red-to-blue color gradient as you move out from the center of the galaxy. In astronomy, this is considered a “negative” color gradient. A slit that only covers the galaxy center would lead to an overall overestimate of the stellar mass and underestimate of the star formation rate. If the galaxies instead had a positive color gradient, with more star formation in the center of the galaxy, the mass would be underestimated and the star formation rate would be overestimated. Galaxies with both positive and negative color gradients have been found in the distant universe. By measuring the color gradient for each individual galaxy in their sample, the authors can correct the mass and star formation rate calculations from spectra taken with a slit spectrograph.
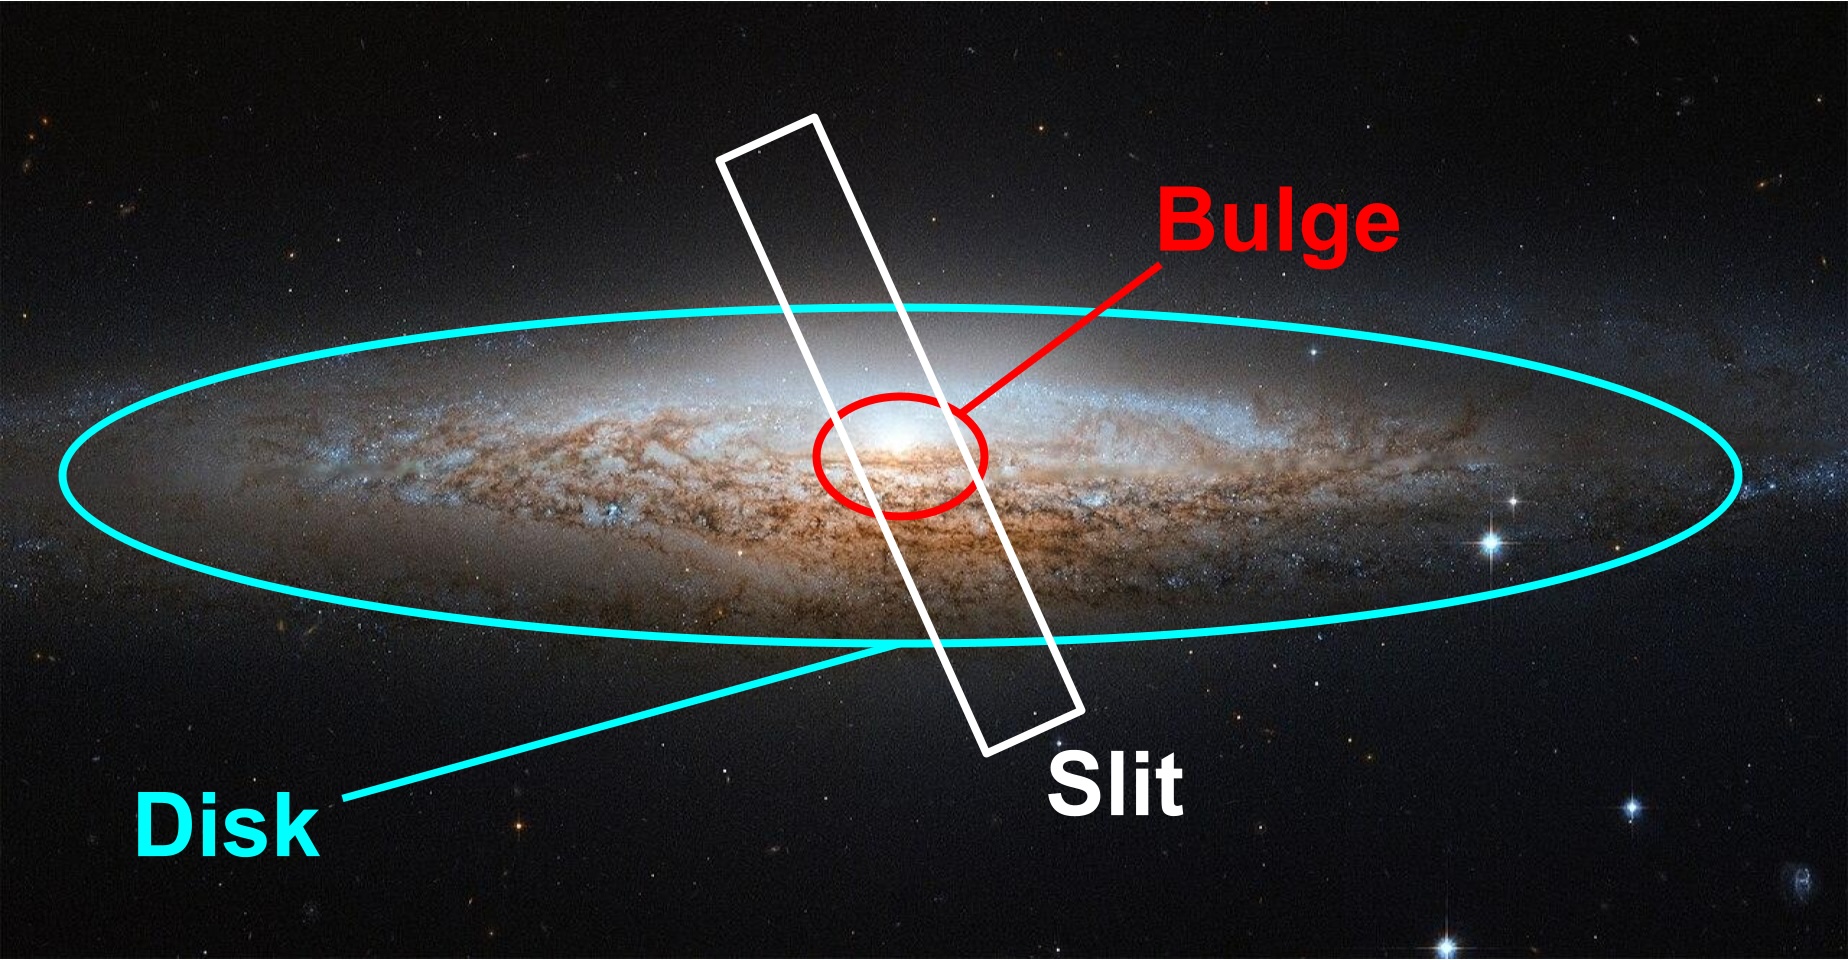
Figure 1: The spiral galaxy NGC 2683 with its bulge and disk labeled. The inner part of the galaxy (“bulge”) contains older, redder stars; the outer part of the galaxy (“disk”) contains bright blue stars that indicate that star formation is ongoing. Here, the slit spectrograph only covers the galaxy’s bulge, leading to incorrect mass and star formation rate measurements. [ESA/Hubble & NASA (CC BY 4.0) with annotations by Margaret Verrico]
Results
Instead of using spectra, the authors of today’s article use imaging in different filters to measure color gradients for a sample of four galaxies in the early universe that had previously been found to be extremely massive and no longer forming stars. They use medium-band filters, or filters that let in only a small part of a galaxy’s spectrum, to produce a spectral energy distribution at each radius. This spectral energy distribution is less informative than a spectrum (think a handprint versus a fingerprint), but it’s detailed enough to model the likely stellar population at each radius to determine whether the galaxies have positive, negative, or no color gradients, allowing for better corrections to the properties measured from the galaxies’ centers. They also model the stellar population from the central part of the galaxy that would normally be covered by a slit, as well as from the actual spectrum, to test whether any differences in their results come from their choice of modeling techniques.
The authors find that three of the four galaxies have a negative color gradient in at least some areas. The fourth galaxy has a relatively flat color gradient, though this measurement is less certain due to the object’s redshift. When the authors plot the galaxies’ colors on a diagnostic diagram that separates red and old galaxies from young and blue galaxies, they find that three of the four galaxies have centers that appear red and old but outskirts that appear young and blue (Figure 2). This means previous measurements of the mass may have been overestimated, and previous measurements of the star formation rate may have been underestimated.
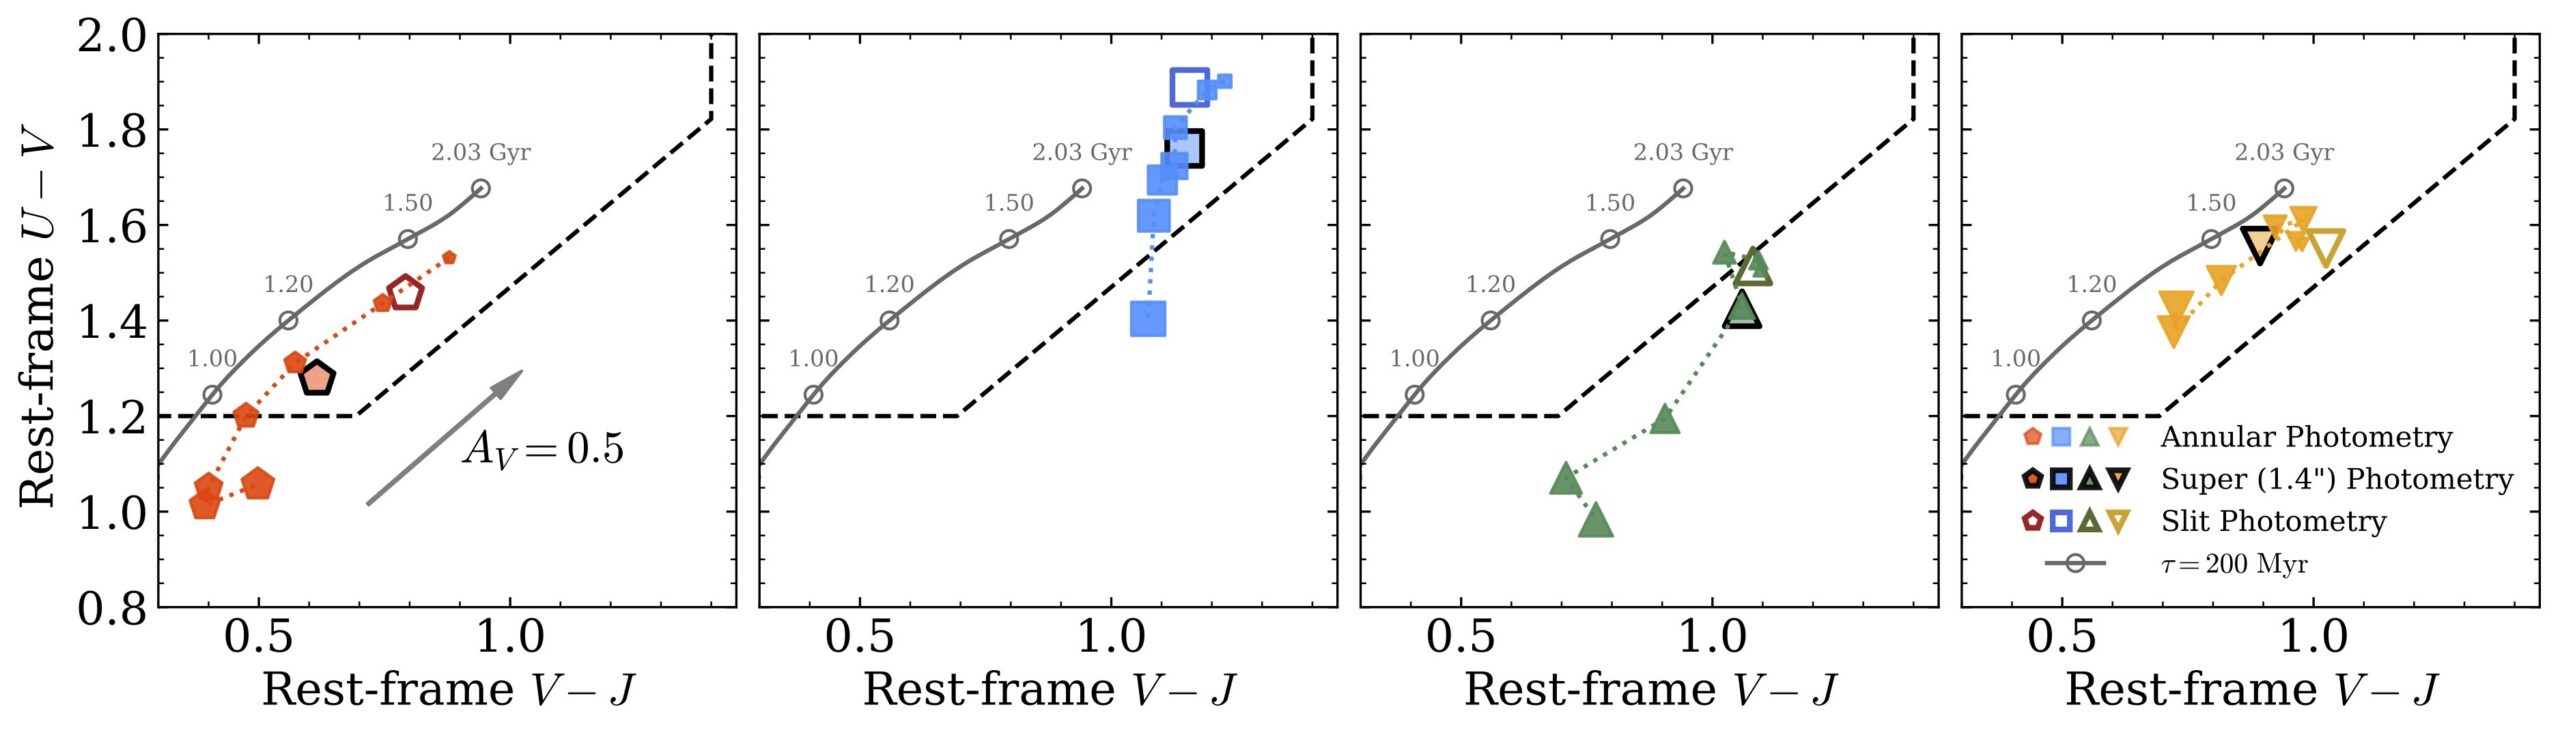
Figure 2: The location of each of the four galaxies on a color–color diagram that separates red galaxies (above/to the left of the dashed lines) from blue galaxies (below/to the right of the dashed lines). The open markers indicate the galaxy color as measured from the center of the galaxy; the filled-in markers show the color at different radii from the galaxy center. For all but one galaxy, the color at several radii is bluer than at the center, indicating that the galaxy might have younger stars at least at some radii. [Adapted from Cutler et al. 2026]
Is the Universe Broken?
To determine whether these galaxies still count as “universe breakers,” the authors use a cosmological model to predict the largest expected galaxy mass in the observed area at different periods in cosmic time. The previous results had less than a 0.3% chance of occurring under current cosmological models; with their updated numbers and stellar population models, the authors find that the observed galaxies sometimes have more than a 5% chance of occurring, though there is still tension. They point out that their analysis ignores processes that could help galaxies grow and quench in the early universe, like galaxy mergers; still, the existence of these massive galaxies with such low star formation rates remains a puzzle.
Original astrobite edited by Ansh Gupta.
About the author, Margaret Verrico:
I am a fourth-year graduate student at the University of Illinois Urbana-Champaign. I study the connection between supermassive black hole transients and their host galaxies. I am also an avid knitter and reader, and I am passionate about opening up STEM opportunities for people of all backgrounds.