
By piecing together observations from dozens of radio telescopes in Chile, planetary scientists recently completed the first-ever map of Callisto’s emission at millimeter wavelengths.
Old and Cold
In striking contrast to Io’s frenzied volcanism and Europa’s cracking ice shell, Jupiter’s moon Callisto is much quieter and colder than its Galilean siblings. Though a liquid water ocean hypothetically sloshes beneath its frigid surface, it’d be hard to infer that just by looking at the moon. Callisto’s terrain is ancient, static, and bears the scars of the millennia of exposure to space. There are no volcanoes, plate tectonics, or any other features to disturb what researchers call “evolved ruins” of the numerous craters. These have names like Valhalla, Asgard, and Lofn, since Callisto’s geologic features are named after settings and characters in Norse mythology to further reinforce their freezing existence.
This never-reset canvas makes Callisto an ideal laboratory for studying the long-term effects of asteroid impacts, dust accumulation from nearby natural satellites, and other processes that modify a planetary surface over time. One way to infer the composition and structure of the first few meters of material is to observe the way the temperature changes over the course of a day. For example, ice and rock respond differently to temperature changes; similarly, small-grains of either material warm up and cool down at different speeds than their larger-grain counterparts.
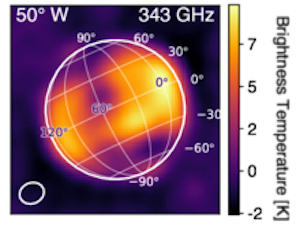
The residuals from one of ALMA’s observations of Callisto. [Adapted from Camarca et al. 2025]
Mapping from Afar
A team led by Maria Camarca, California Institute of Technology, just finished churning through all of the data and assembling their map of Callisto’s temperature residuals. Though the final spatial resolution was at best a few hundred kilometers, meaning a comparable map of Earth would blur all of New England together, this represents the most detailed thermal map of Callisto yet. The map was detailed enough to easily spot the largest craters, and several impact craters including Valhalla stood out as being 3–5K colder than all of the surrounding terrain. The team spotted another anomalously cold region that coincides with the location of maximum carbon dioxide gas density recently seen with JWST.
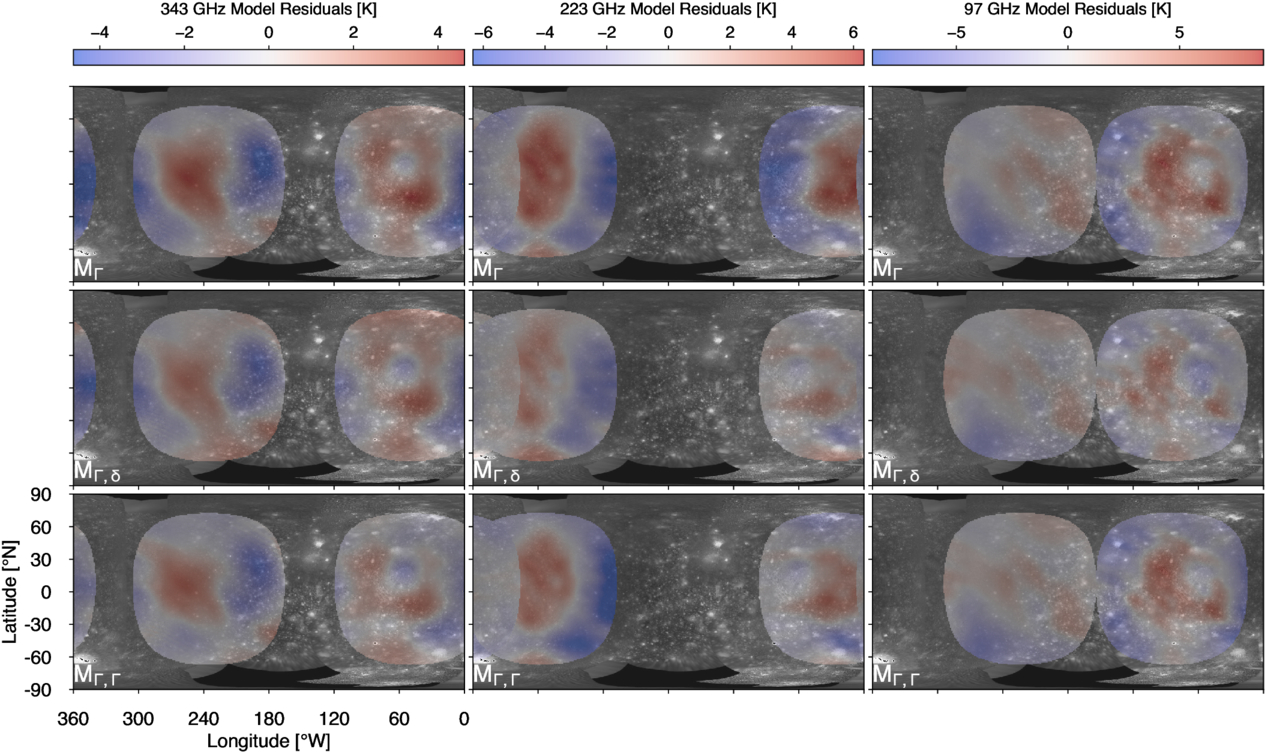
A map of Callisto’s thermal emission (red/blue) overlaid atop visible images of the surface collected by spacecraft. Click to enlarge. [Camarca et al. 2025]
Citation
“A Multifrequency Global View of Callisto’s Thermal Properties from ALMA,” Maria Camarca et al 2025 Planet. Sci. J. 6 183. doi:10.3847/PSJ/ade7ee