
The gorgeous, nearby, face-on TW Hydrae protoplanetary disk has proved challenging to quantify: just how much gas is sitting between those rings? A new study presents a possible answer and develops a new technique for addressing the question along the way.
Covert Disks
Much like babies cling to their blankets, young stars wrap themselves in disks of gas and dust when they’re very young. Although this state of infancy lasts only a short few million years, this temporary cosmic comforter is a profoundly important artifact of a star’s birth, at least from our earthly perspective. That’s because all planets, asteroids, and humans formed from this material: we are the worn remains of a structure long ago dispersed, clumps of matter that couldn’t get blown away in our Sun’s angsty teenage years when it scattered the rest of its protoplanetary disk.
Basic measurements such as how gas is distributed around young stars are therefore vital for our models of planet formation. Unfortunately, this measurement is notoriously tricky to make since the most dominant component of the disk, hydrogen gas, stubbornly refuses to emit light while at the temperatures in this environment. Most of astronomy relies on catching photons flung our way across the void, but if the hydrogen refuses to play catch, we can’t see it.
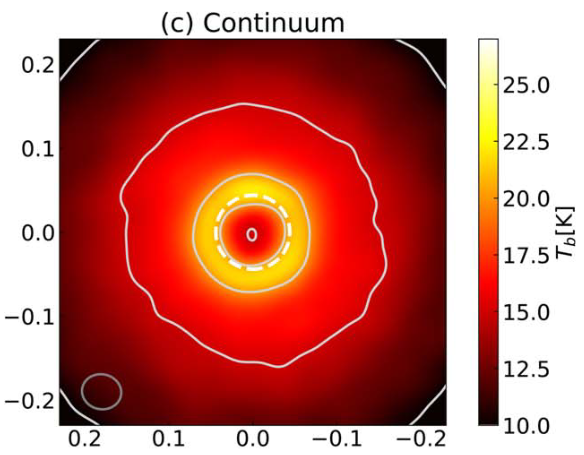
Emission from dust in the TW Hydrae protoplanetary disk, colored by brightness temperature of the dust. Axes are in arcseconds. [Tsukagoshi et al. 2019, reproduced in Yoshida et al. 2022]
Pressure Wings
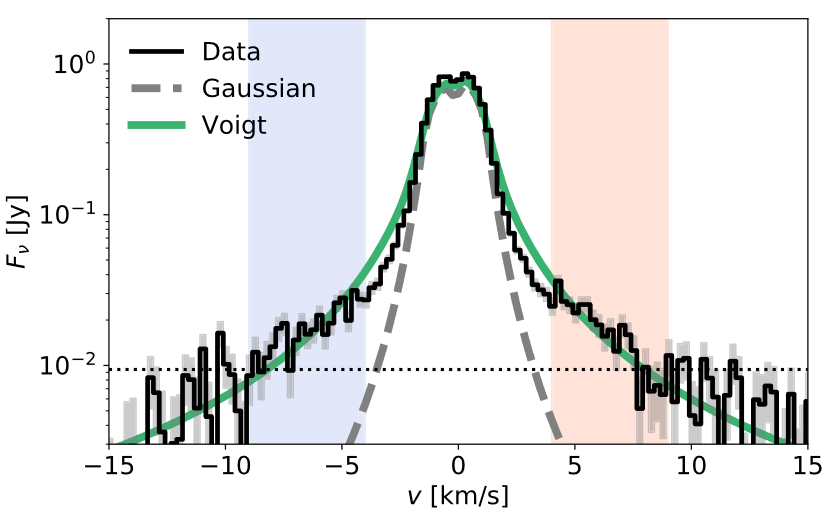
An illustration of the pressure-broadened wings. The dashed line marks a typically used Gaussian shape, while the green line shows the best-fitting Voigt profile, which captures broadening. The data are shown in black, and the 3-sigma significance level is denoted by the dotted line. [Yoshida et al. 2022]
Typically, astronomers assume these lines follow a roughly Gaussian shape. However, Yoshida and collaborators found that in the inner regions of the disk, the “wings” of the lines were wider than expected. After considering various explanations for what might cause this broadening, they concluded that the wings are the result of higher pressures along the midplane of the disk.
This new method should be applicable to other disks moving forward, so astronomers can hope for similarly refined measurements in the near future.
Citation
“Discovery of Line Pressure Broadening and Direct Constraint on Gas Surface Density in a Protoplanetary Disk,” Tomohiro C. Yoshida et al 2022 ApJL 937 L14. doi:10.3847/2041-8213/ac903a