
Scientists have long puzzled over slow and regular variations in the brightness of many evolved giant stars. Now, clues from newly analyzed infrared observations may finally have solved this mystery.
Unexplained Changes
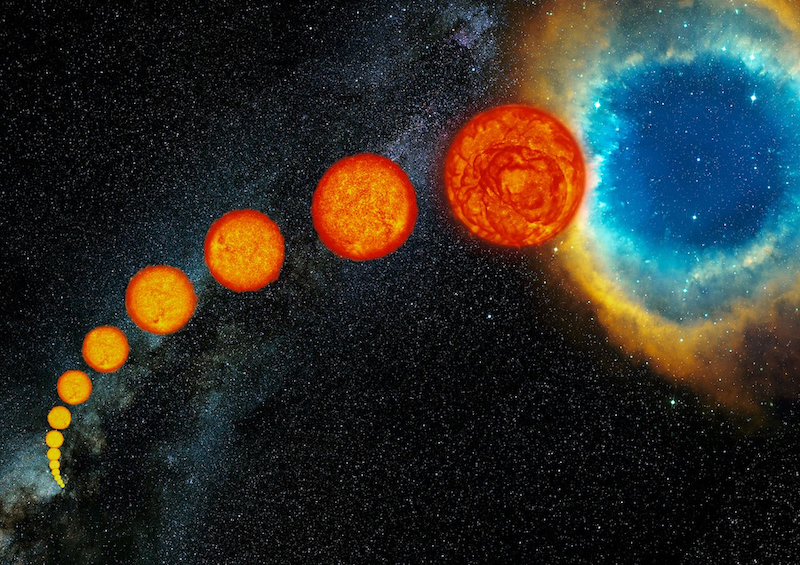
Artist’s illustration of the life stages of a star like the Sun, which eventually will age into a cool red giant star and then eject its outer layers to form a planetary nebula. [ESO/S. Steinhöfel]
Most of this variability of red giants is reasonably well understood, but there’s one type that has remained mysterious: so-called long secondary periods.
Common Evolution
In addition to showing ordinary variation from pulsations, long-secondary-period red giants show regular dips in their optical light curves that occur on timescales an order of magnitude longer than the pulsations — typically several months to several years.
Evolved stars with long secondary periods are surprisingly common: at least a third of luminous asymptotic giant branch stars and supergiants show these long-period variations. Yet despite their ubiquity, long secondary periods have remained unexplained for decades. Are these variations intrinsic to the aging star? Or are they caused by some external factor?
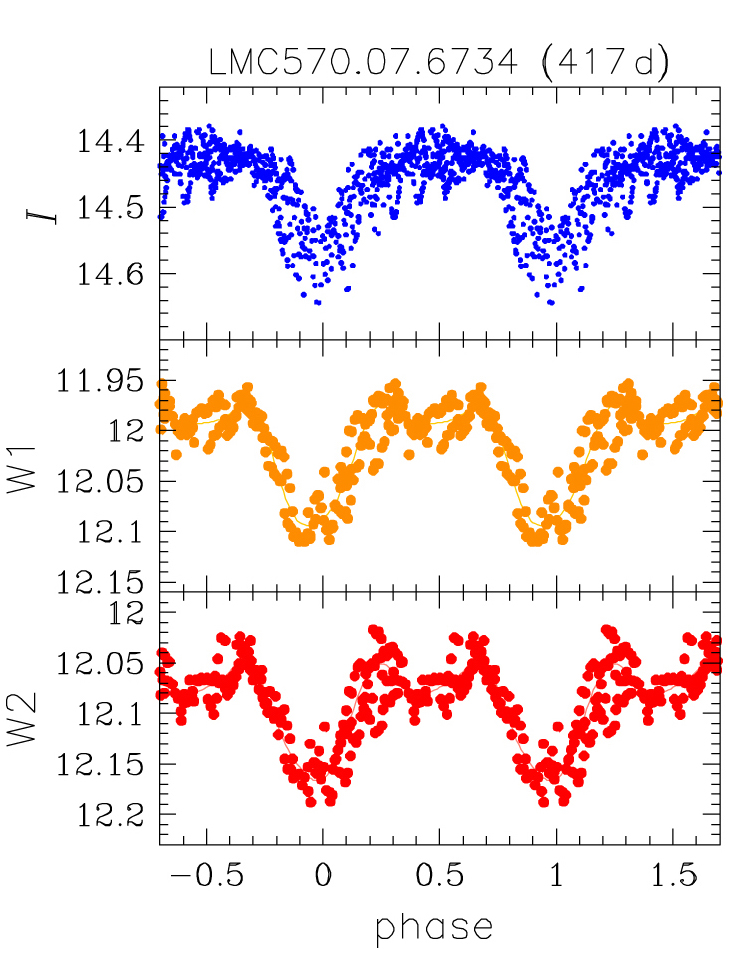
An example set of light curves from a long-secondary-period variable star shows the primary eclipses in all three light curves. Secondary eclipses appear only in the two infrared bands (W1 and W2, the orange and red data), not in the optical band (I, the blue data). [Adapted from Soszyński et al. 2021]
Optical vs. Infrared
Soszyński and collaborators gathered optical observations of a sample of 16,000 known long-secondary-period variable stars in the Milky Way and the nearby Magellanic Clouds. For roughly 700 of these stars, the authors then obtained corresponding light curves at two infrared wavebands from the NEOWISE-R mission.
A striking feature was immediately evident when comparing the optical and infrared observations of these variables: where the optical light curves showed a single long-period dip in brightness, the infrared light curves of about half of the stars also showed a second dip that appeared exactly out of phase with the primary dip.
Former Planet, Now Dusty Shade
What does this mean? Soszyński and collaborators argue that these second dips confirm that the long-period variability is caused by eclipses from a binary companion.
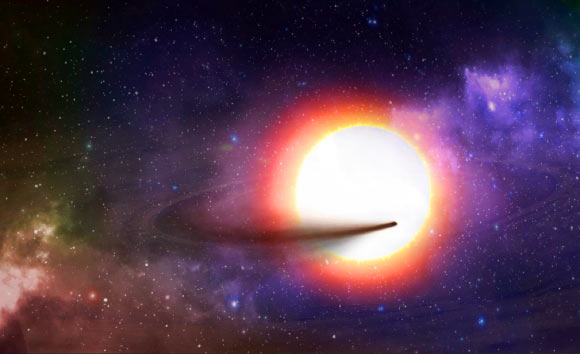
Artist’s illustration of an orbiting planet trailing a comet-like tail of dust. A dust-shrouded brown-dwarf companion is the best explanation for long-period variability seen in the light curves of many evolved stars. [Maciej Szyszko]
This solution to the decades-old mystery of long secondary period variability in red giants opens a door to new discoveries. By studying the shape of the eclipses in the variable stars’ light curves, there’s plenty more we can now hope to learn about how stars like the Sun evolve alongside their planets.
Citation
“Binarity as the Origin of Long Secondary Periods in Red Giant Stars,” I. Soszyński et al 2021 ApJL 911 L22. doi:10.3847/2041-8213/abf3c9
2 Comments
Pingback:Rozwiązywanie zagadki zmienności czerwonych olbrzymów – PTMA Kraków
Pingback:Rozwiązywanie zagadki zmienności czerwonych olbrzymów – Astronomia Śląska