
Editor’s note: Astrobites is a graduate-student-run organization that digests astrophysical literature for undergraduate students. As part of the partnership between the AAS and astrobites, we occasionally repost astrobites content here at AAS Nova. We hope you enjoy this post from astrobites; the original can be viewed at astrobites.org.
Title: The Landscape of Galaxies Harboring Changing-Look Active Galactic Nuclei in the Local Universe
Authors: Sierra A. Dodd et al.
First Author’s Institution: University of California, Santa Cruz
Status: Published in ApJL
As we grow older and learn more about ourselves, we sometimes think about changing our appearance: a new hairstyle, clothes, or maybe even a tattoo! Active galactic nuclei (AGN) are, in this respect, no different. Over the course of a galaxy’s lifetime it will accrete gas and dust that will make its way to the centre, where its supermassive black hole (SMBH) resides. As the SMBH feeds on this material, it will emit huge amounts of radiation and become an AGN. However, certain conditions can cause disruptions in the AGN’s gas supply. Whilst the cause of these disruptions is unclear, we can see the effects in the AGN’s changing spectrum. Either they “turn on” as broad optical emission lines emerge or “turn off” as those lines disappear. Today’s authors are interested in identifying what kind of galaxies host these changing-look AGN (CL-AGN) to try to isolate the conditions that might trigger these changes.
Constructing the AGN Lookbook
Identifying CL-AGN involves a comparison between two sets of spectra of the same galaxy taken at two different times to find the changes in the broad emission lines. Different studies will approach this task in their own way but are ultimately following this principle. This is true for all identification techniques, but CL-AGN have only been identified as a phenomenon relatively recently, so very few have been found. To produce today’s sample of 17 CL-AGN, the authors have had to combine detections from three different studies that follow this broad approach but with their own unique characteristics. So, what one study calls a CL-AGN might be slightly different from another. In addition, all but two of these detections are turn-on AGN. The authors argue that the lack of turn-off AGN is due to the relative abundance of quiescent galaxies in the nearby universe. Within these galaxies, it is much easier to see the emergence of broad emission lines. As a result, their sample may not be particularly representative of the underlying CL-AGN population, but the authors are very forthcoming about these issues and have shown care in constructing their sample.
Their comparison sample is a set of 500,000 local galaxies with measured stellar masses, star formation rates and numerous other spectral properties. Most of these quantities are measured across the whole galaxy and are also broken down into bulge and disk components. These data, mostly drawn from the SDSS, will allow today’s authors to place the CL-AGN within the wider galaxy population and isolate the conditions that trigger this change.
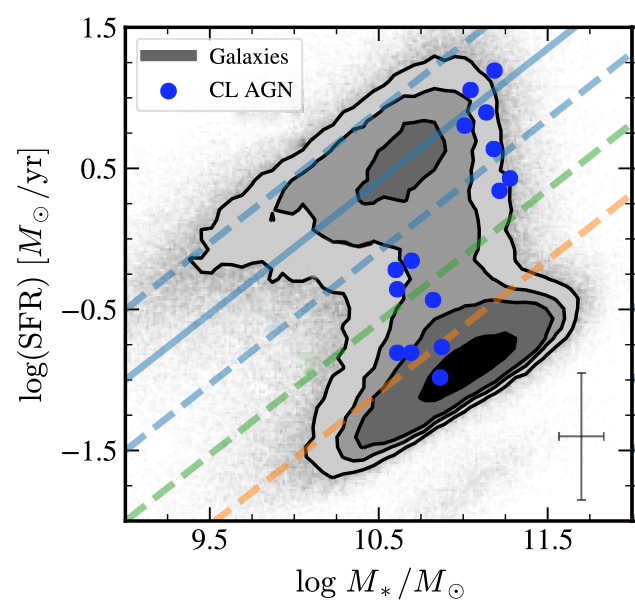
Figure 1: Distribution of host galaxies’ star formation rates and stellar masses. Blue circles show the distribution of CL-AGN compared to the underlying comparison galaxies (grey contours). Dashed lines indicate different star formation classifications: green-valley galaxies lie between the dashed blue and orange lines. [Dodd et al. 2021]
Results
From their analysis, we can determine three key consistencies about the preferences of CL-AGN. Figure 1 shows that the CL-AGN are all consistent, within errors, of being hosted in green-valley galaxies. These are a rarer form of galaxy that lie in between the blue, actively star-forming galaxies and their red and dead counterparts. Green-valley galaxies are believed have recently undergone a burst of extreme star formation, possibly implying the presence of large amount of cold gas at the centre which could fuel the mostly turn-on activity seen in this sample.
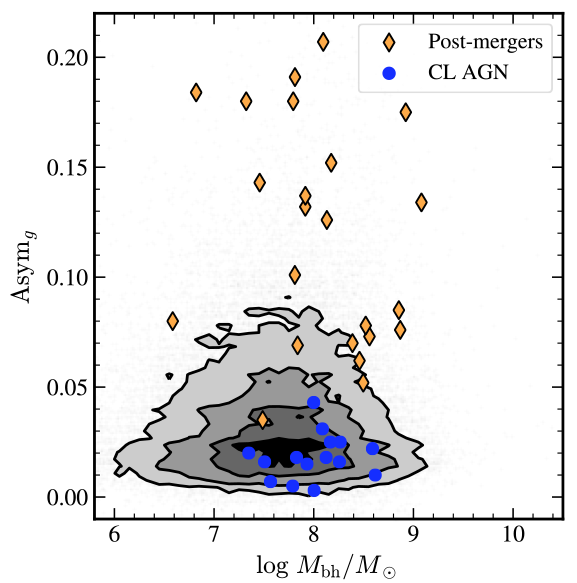
Figure 2: Asymmetry of the host galaxy against SMBH mass. Blue circles show the tight distribution of CL-AGN compared to the underlying comparison galaxy distribution (grey contours) and merging galaxies (yellow diamonds). [Dodd et al. 2021]
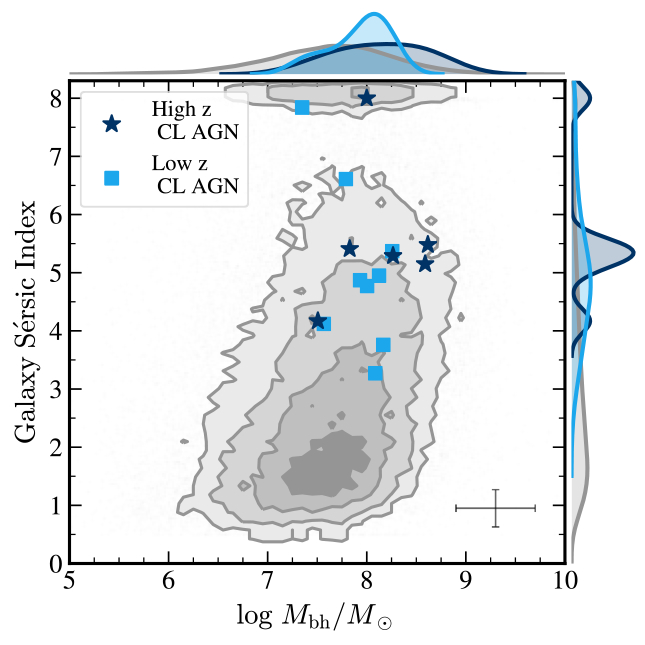
Figure 3: Sersic index (indicating the concentration of galaxy light) against SMBH mass. Both the squares and stars show how CL-AGN are distributed compared to the underlying comparison galaxy distribution (grey contours). [Dodd et al. 2021]
Original astrobite edited by Alison Crisp.
About the author, Keir Birchall:
Keir is a PhD student studying methods to identify AGN in various populations of galaxies to see what affects their incidence. When not doing science, he can be found behind the lens of a film camera or listening to the strangest music possible.
2 Comments
Pingback:Badanie galaktyk gospodarzy AGN o zmiennym wyglądzie – PTMA Kraków
Pingback:Badanie galaktyk gospodarzy AGN o zmiennym wyglądzie – Astronomia Śląska